


As an investor’s portfolio grows over the years, it typically evolves into a collection of investment accounts, including savings accounts, brokerage accounts, IRAs and 401(k)s. Monitoring each account accurately to ensure optimal performance can be a demanding task that many individual investors think they do not have the time for. Fortunately, with ongoing technological advancements, portfolio management software programs have continued to improve, and they increasingly give investors more power to easily track their investment portfolios. Above all else, portfolio management software programs provide the consolidation that is crucial when handling multiple accounts. Ultimately, these programs can help propel an individual investor toward their financial goals.
In this issue’s comparison, I dissect four portfolio management software programs: Fund Manager 2016, Investment Account Manager 3.0, Quicken Premier 2016 and Personal Portfolio Manager 7. The first three software programs appeared in our previous comparison article. Personal Portfolio Manager 7 is being added into the mix this year for the first time. Besides updating each program’s features and functions, I provide examples that help demonstrate what each software package has to offer, including their significant reports.
Why Choose Software Over Online Trackers?
As the capability of the internet has improved and expanded over the years, running complex tools with real-time updates is possible through your Web browser. Web-based portfolio trackers have become extremely popular among individual investors in recent years, and significantly outnumber portfolio tracking software choices. Web-based portfolio trackers offer real-time updates (typically for a fee) and up-to-the-minute news coverage on holdings in your portfolio. Top online portfolio managers allow you to directly sync your investment accounts into the browser, which is advantageous since you won’t have to enter updates manually.
However, there is one key area where software-based portfolio managers are a step above web- based counterparts: performance reports. With software-based programs investors have access to a bevy of powerful reports, many of which are not available by using a Web-based portfolio tracker.
A Word About Mac Options
There were no Mac-based software packages worth mentioning for the purposes of this article. Moreover, the vast majority of AAII members use Windows, which has a wider range of portfolio management software selections. Investment Account Manager 3.0 (IAM3) does work on Mac-based computers, but not organically. A Mac user would have to gain access to Windows emulating software in order to run IAM3. Quicken offers a Mac-based Quicken 2016 program that tracks portfolio and individual stock values, but the various investment reports and tools that Quicken Premier 2016 provides are missing from the Mac version.
My suggestion for Mac users is the premium online portfolio tracker from Morningstar.com, which is featured in the CI Best of the Web “Portfolio Tracking, Analysis & Optimization sites.” If any of our members are Mac users and know of high-quality and well-equipped portfolio management software packages that they would like to share, please leave a comment below providing details about the program and why it works well for you. We would love to learn more about Mac-based software.
Features and Functionality
Understanding your personal needs when it comes to investing and portfolio management is the first step in determining which software suits you best. Each of the four programs compared here have the same goal in mind: make managing your various investment accounts easier and more efficient (cost- and time-wise). That being said, each program functions in its own unique way and includes some key features and attributes that its respective competitors may not offer. Perhaps most important is the bottom line: Since the programs come at a cost, unlike most online portfolio trackers, it is essential to select the most appropriate one for your investing needs.
Our comparison grid details all of the features offered by our four picks. The information is broken down below as each feature is discussed. For starters, Table 1 shows the system requirements, cost and contact information for each program.
| Program Name | Fund Manager 2016 | Investment Account Manager 3.0 | Personal Portfolio Manager 7 | Quicken Premier 2016 |
| Company | Beiley Software, Inc. |
Quant IX Software, Inc. |
OWL Software | Quicken Inc. |
| Telephone | 480/705-0129 | 800/247-6354 | 410/849-3590 | 650-564-3399 |
| Demo Available (Cost) | Yes (free) | Yes (free) | Yes (free) | No |
|
Platform (Mac, Windows) |
Windows |
Windows, Mac (only with Windows emulating software) |
Windows | Windows |
| Subscription Price | $99, Personal; $295, Professional |
$89/$129 ($20 discount for AAII members) |
$69 | $104.99 |
Costs and Time Commitments
Beyond the monetary cost, consider the time you will need to spend learning how to use the program. Regardless of how simple or challenging a program is to run, know yourself first. If you are handy with computers and have experience working with similar tools in the past, the learning curve will be vastly different than, say, for someone with limited computer skills who is generally new to the investing world. Of course, you cannot forget about your personal needs and expectations for a program either. If, for example, you invest heavily in real estate, all you have to do is check the comparison grid and see which companies handle that particular asset. Your choices will dwindle from there and make the decision process a lot less complicated.
The best way to accurately determine if a program is the right fit for you is to try it out for yourself. Fund Manager 2016, Investment Account Manager 3.0 and Personal Portfolio Manager 7 all offer free trial demos for their software, allowing you to try the programs out and gauge their strengths and weaknesses. Fortunately, it is quite simple to download a demo of these three programs; unfortunately, Quicken Premier 2016 does not offer a demo or trial version of its software.
Securities/Assets Handled
When you are evaluating the scope of securities a prospective program accommodates, consider not only the types of securities or assets you currently hold, but also potential securities or assets you may want to purchase down the line. All programs feature the basic security classes such as stocks, bonds, mutual funds and exchange-traded funds (ETFs). When it comes to other securities like derivatives, you need to pay close attention to what each program has to offer. Table 2 shows the securities and assets handled by each of the programs. (This information is also included in the master comparison grid.)
|
Securities/ Assets Handled |
Fund Manager 2016 | Investment Account Manager 3.0 | Personal Portfolio Manager 7 | Quicken Premier 2016 |
| agencies | x | |||
| annuities | x | x | ||
| bonds | x | x | x | x |
| cash/money market accounts | x | x | x | x |
| CDs/T’bills | x | |||
| college funds | x | |||
| commodities | x | |||
| ETFs | x | x | x | x |
| closed-end funds | x | x | ||
| exchange rates | x | |||
| futures | x | |||
| indices | x | x | ||
| investment clubs | x | |||
| liabilities | x | |||
| MLPs | x | |||
| mutual funds | x | x | x | x |
| options | x | x | x | x |
| physical assets | x | |||
| real estate | x | |||
| stocks | x | x | x | x |
| Treasury bills | x | x | ||
| user-defined | x |
A good program will allow you to measure your portfolio’s diversification with ease. The ability to label each holding by asset type and industry is particularly important because it will ensure that asset allocation and industry reports will be generated accurately. For example, you may want to examine the sector or industry breakdown of your equity portfolio or the state-by-state make-up of a municipal bond portfolio.
Your ability to assess your asset allocation quickly and correctly is critical as an investor. Look into what each prospective program has to offer. Remember, just because you do not hold a particular asset or security now does not mean you will not in the future. Plan ahead and decide what program fits both your current and upcoming investments.
Transactions Handled
The transactions each program supports are closely tied to the types of securities that the program can handle. All of the programs compared here can handle a number of fundamental transactions such as buy/sell, cash dividends, and interest income. It’s fair to say that all four of these programs handle enough types of transactions to cover the needs of most individual investors.
Each program varies in its coverage of other transactions such as short sales, purchases on margin and the reinvestment of dividends. Table 3 lists the transaction types each program offers (also included in the master comparison grid).
| Transaction | Fund Manager 2016 | Investment Account Manager 3.0 | Personal Portfolio Manager 7 | Quicken Premier 2016 |
| Account fees | x | x | ||
| Accrued Interest | x | x | x | |
| Buy/sell | x | x | x | x |
| Dividend reinvestment | x | x | x | x |
| Dividends | x | x | x | x |
| Foreign tax | x | x | x | |
| Interest | x | x | x | |
| Margin interest expense | x | x | x | |
| Mergers | x | x | x | |
| Options | x | x | x | |
| Return of capital | x | x | x | |
| Shares transferred between accts. | x | x | x | |
| Short Sale | x | x | x | x |
| Spin-offs | x | x | x | |
| Stock dividend distribution | x | x | x | |
| Stock splits | x | x | x | x |
| Transfers in/out | x | x | x | |
| User-defined categories | x | x | x |
A separate item related to the types of transactions that are handled is security lot assignment. This feature is important for investors interested in tracking performance and tax liability issues. A lot is the total number of units involved in a trade on a securities exchange. If, for example, you reinvest dividends from your stocks and mutual funds, you will be tracking many lots over an extended period of time. The best portfolio management software programs will automatically match buy and sell lots for different accounting strategies in order to reduce the investor’s tax exposure. Some of the most common strategies include first-in-first out (FIFO), average cost and specific lot. Using a program that offers all three is convenient and can be a central factor when choosing between programs. Table 4 outlines the security lot assignments that each program offers (also included in the master comparison grid).
| Security Lot Assignments | Fund Manager 2016 | Investment Account Manager 3.0 | Personal Portfolio Manager 7 | Quicken Premier 2016 |
| average cost | X | X | ||
| covered/noncovered | X | |||
| FIFO | X | X | X | X |
| LIFO | X | X | ||
| min/max gain | X | X | ||
| single/double category | X | |||
| specific lot | X | X | X | X |
Moreover, three out of four of these portfolio management packages can automatically import your transactions from a brokerage account (excluding Personal Portfolio Manager 7). This saves quite a bit of time since you won’t have to enter each position and transaction manually. Keep in mind, however, that you may still have to enter cost basis for each position.
Transaction Reports
Reports allow you to analyze your portfolio and investments in various ways. One prime area where portfolio management software is a step above online trackers is the level of detail the paid programs offer within their reports. Looking at the top of Table 5, you can see that each program lines up virtually identically in terms of the transaction reports offered.
| Fund Manager 2016 | Investment Account Manager 3.0 | Personal Portfolio Manager 7 | Quicken Premier 2016 | ||
|
Maximum Portfolios/ Securities per Portfolio |
Personal, unlimited/500; Professional, unlimited/5,000 |
unlimited/ unlimited |
999/ unlimited |
1,000+ /1,500+ |
|
| Reports | Current Holdings | X | X | X | X |
| Holdings by Lots | X | X | X | X | |
| Tax Schedules (Interest/Dividend/ Capital Gains) | X | X | X | X | |
| Projected Cash Flow | X | X | X | X | |
| Customized Reports | X | X | X | X | |
| Portfolio Alerts | X | X | X | X | |
| Performance Reports | Security/Industry/ Asset |
X (security/asset) |
X | X | X |
| Portfolio (Single/Multiple) | X | X | X | X | |
| Holding-Period/ Between-Period Returns | X | X | X | X | |
| Value-Weighted IRR/Time-Weighted Returns |
X (time-weighted) |
X |
X (value-weighted) |
X (value-weighted) |
|
| Tax-Adjusted Returns | X | ||||
| Benchmark Comparison | X | X | X | ||
| Data Support | Data Services Supported | internet | internet, QuoteMedia | internet | Quicken |
| Imports Brokerage Transactions | X | X | X | ||
| Import Formats Supported* | OFX, QFX, QIF, PRN, CSV, TXT, ASCII | CSV, XLS, QIF, QFX, OFX, Captools | ASCII, TXT | QFX, OFX, QIF, QXF, CSV, TurboTax, Microsoft Money | |
| Export Formats Supported* | CSV, QIF | CSV, XLS, TXT, PDF | ASCII, TXT | QIF | |
| Tax Scheduling/Planning | X | X | X | ||
| Screening | Stock | X | X | X | |
| Mutual Fund | X | X | X | ||
| ETF | X | X | X | ||
| Calculates Rate of Return | X | X | X | X | |
| Interactive Charting | X | X | X | ||
| *Format Key: ASCII = universal plain text; CSV = comma-separated values; OFX, QFX = Open Financial Exchange; QIF, QXF, PRN = Quicken; TXT = text file; XLS = Excel | |||||
However, just because the programs offer the same functionalities in some areas does not mean that they all fit your needs perfectly. One program may present a more favorable layout that you prefer over the other choices. Moreover, you need to know what reports each program offers that you currently do not use during your analysis. As mentioned above, keep in mind that your investment approach and strategy may change over time. Working with a program that expands as your investments widen in terms of assets and securities is very important, but just as important are the reports you may use alongside those potential future investments. Consider the now when you are choosing a program, but also ensure that your investing future is not compromised by the selection. Doing so will save you time and effort down the road and allow you to have a flexible investment approach.
The main transaction reports offered by each of the top four portfolio management software programs are as follows.
Current Holdings: Reflects the composition of your portfolio. One of the most basic reports, it includes the securities you hold in the portfolio, along with units, original costs and current market value. Most software programs also include asset allocation and gain/loss data, and security statistics such as beta, dividend yield and price-earnings ratio.
Holdings by Lots: Breaks down the details of the current holdings report into finer increments, indicating each purchase at a specific date and price. This provides a comprehensive history of your transactions and equips you with guidance when selling.
Tax Schedules: Reports that pertain to Schedule B and Schedule D IRS forms. Designed for computing interest and dividends received from a portfolio, Schedule B reports allow you to estimate tax debt (or credit) before year-end statements arrive. Tax Schedule D reports compute long- and short-term capital gains and aggregate assets that will yield capital gains with tax liabilities. Ideally, the program should keep track of foreign tax withheld on your securities in order to better ensure that proper credit is accounted for when filing your taxes. Tax reports are usually given for a specific tax year, so programs will generally include an option to select the appropriate year to report upon.
Be aware that none of the portfolio management software programs specialize in tax reporting, so their capabilities may be limited. Be cautious when utilizing the programs for tax purposes. If you are going to rely on the portfolio management program to produce these tax schedules, make sure adjustments can be made should tax laws change regarding factors such as short- or long-term holding periods in the future. If your situation is complex, be extremely vigilant and consider seeking a tax professional. Tax reports are very delicate and can be tricky to handle.
Projected Cash Flow: Serves as a forecast of the expected portfolio cash income from dividends, interest and bond maturities. For investors in or nearing retirement, this report is extremely useful since many retirees heavily depend on income-related investments. Having the capabilities to estimate your retirement income will allow you to structure asset holdings based on future needs. Bond maturity schedules can be quite useful in assisting investors redeploy capital that is coming due. These schedules can also be utilized to help mitigate interest rate risk.
Customized Reports: Come in handy if you like to keep your options open and have the flexibility to adjust reports based on your personal preferences. The customization choices can be content-related such as selecting the time period, or cosmetics-related, such as setting column/row headings or changing font size.
Portfolio Alerts: Inform you when a security has crossed a predetermined price threshold. Such alerts may highlight a need for investigation that might otherwise go unnoticed.
Performance Reports
One of the most fundamental parts of the portfolio management process is to determine and analyze performance. Performance reports summarize how well your investment holdings have fared. Table 5 and the comparison grid shows each program’s performance report capabilities. Look at this carefully because some programs may stand out over others depending on your needs. Performance reports are covered in more detail below in the description of each program.
The best programs will offer reports for securities, industries and asset classes that include asset allocation and performance analysis. Some programs allow for an examination among various asset classes, while others provide industry, sector and individual security breakdowns. Be on the lookout for a program that has the ability to produce reports for multiple portfolios rather than one that only concentrates on a single portfolio. This helps address the diversified aspects of all your accounts.
All four programs in our comparison calculate a return for the current holding period, which shows gain or loss from the time the security is purchased. They also all provide returns for a designated period, called between-period returns. Between-period returns allow you to track security performance during a known market environment. The programs store snapshots of your portfolio’s holdings and values at various times and tabulate information on the portfolio’s performance during particular market cycles.
Some portfolio management software programs offer the ability to calculate both value-weighted internal rate of return (IRR), also known as dollar-weighted return, and a time-weighted rate of return. Which return best suits your needs?
For an individual investor looking to measure the true performance of a personal portfolio, the IRR is most desirable. The IRR is considered both a value- and time-weighted calculation because it takes into account when inflows and outflows are made to the portfolio, the amount of these flows and the combined impact upon the overarching rate of return.
Time-weighted returns are most often used to analyze the performance of investment decisions made by a portfolio manager or money manager. These calculations ignore the impact of any cash added to or removed from the portfolio. Individual investors should consider cash inflows and outflows because they are extremely common with retirement accounts and impact the portfolio’s rate of return.
Tax-adjusted return reports generate pretax and aftertax returns, calculating the tax liabilities of your transactions and reporting the impact on the rate of return of the securities and portfolios.
Data Support
Most portfolio management software programs are able to download prices and portfolio values from the internet. Many also allow users to directly download transactions and holdings from their respective brokerage accounts, if the user provides brokerage login information and account number.
Some programs allow users to import data without directly syncing the software to their brokerage account. If you are concerned about security issues, this method does not require brokerage account login information or account number. The import and export formats each program permits are shown in Table 5 and on the comparison grid, with explanations of each abbreviation at the bottom of the table.
Other Key Features
Each program provides special features to help attract investors to use their product. Special features can help differentiate programs during your selection process.
Examples of key features include screening (stock, mutual fund, ETF), interactive charting, tax planning and a multitude of other portfolio analysis and tracking tools that aid overall portfolio management. Key features are discussed below in the review of each program, since many vary from program to program.
Top Portfolio Management Software Programs
Fund Manager 2016
Fund Manager, presented by Beiley Software, offers three different versions of its software: personal, professional and advisor.
The personal version of the program is well-suited for individual investors, providing a bevy of portfolio managing features including the retrieval of values via Internet, the ability to generate a number of helpful charts and reports and even listings of bond and income schedules.
The professional version is geared more toward frequent traders and includes more advanced capabilities, primarily for trading purposes. Most notably, it offers technical analysis, risk/reward scatter plots, and moving average alerts.
The advisor version of the program offers client management features suitable for professional investors such as financial advisers and brokers/dealers.
The personal, professional and advisor versions of Fund Manager cost $99, $295 and $1495 each, respectively. For the purposes of this comparison, the professional version of Fund Manager was tested and is the main focus of this description.
The software functions on Windows operating systems as old as Windows XP and is a pure investment management software program. If you are looking for a program with personal finance capabilities, Fund Manager may not be for you. However, Fund Manager provides solid reports and performance tools.
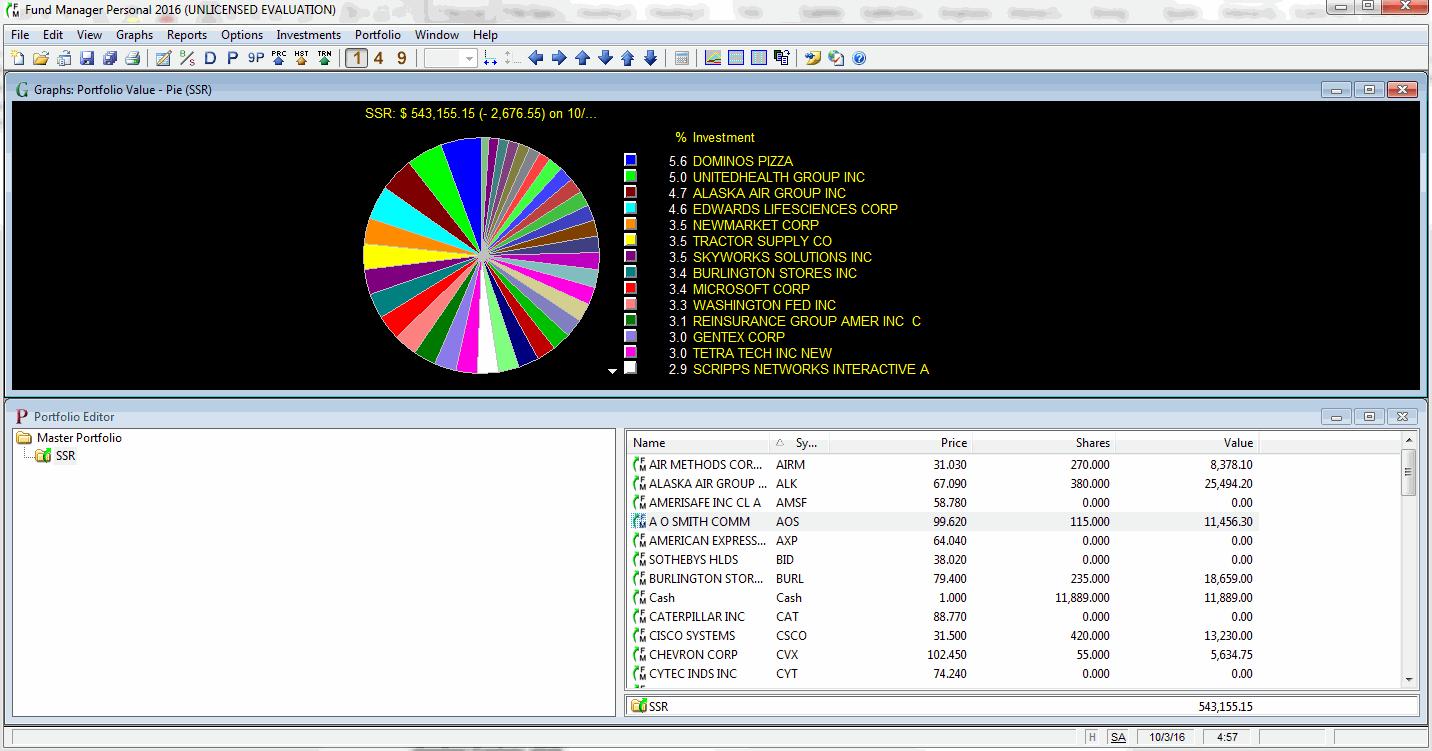
Upon installing Fund Manager for the first time, the setup wizard automatically starts and presents ways in which the user can create a portfolio. The most expedient and easiest way to create a portfolio is to load your personal portfolio through your brokerage account. As mentioned earlier, if you are uncomfortable doing this for security reasons, you can export your brokerage account transactions into a compatible file and then import the transactions into the program. By choosing this method, users avoid disclosing their brokerage account login information. While it may not be as convenient as syncing your brokerage account information, it is easier than entering in the data manually. Double-check the export and import compatibility to ensure that your preferred file format is supported through the program. Compatible file formats are listed in the data support section of the comparison grid.
It is very important to confirm the assigned asset type after uploading your positions. Double-checking this will be beneficial when running reports in the future. In addition to the default asset type choices in the program, users can create their own as a “user-defined” asset type.
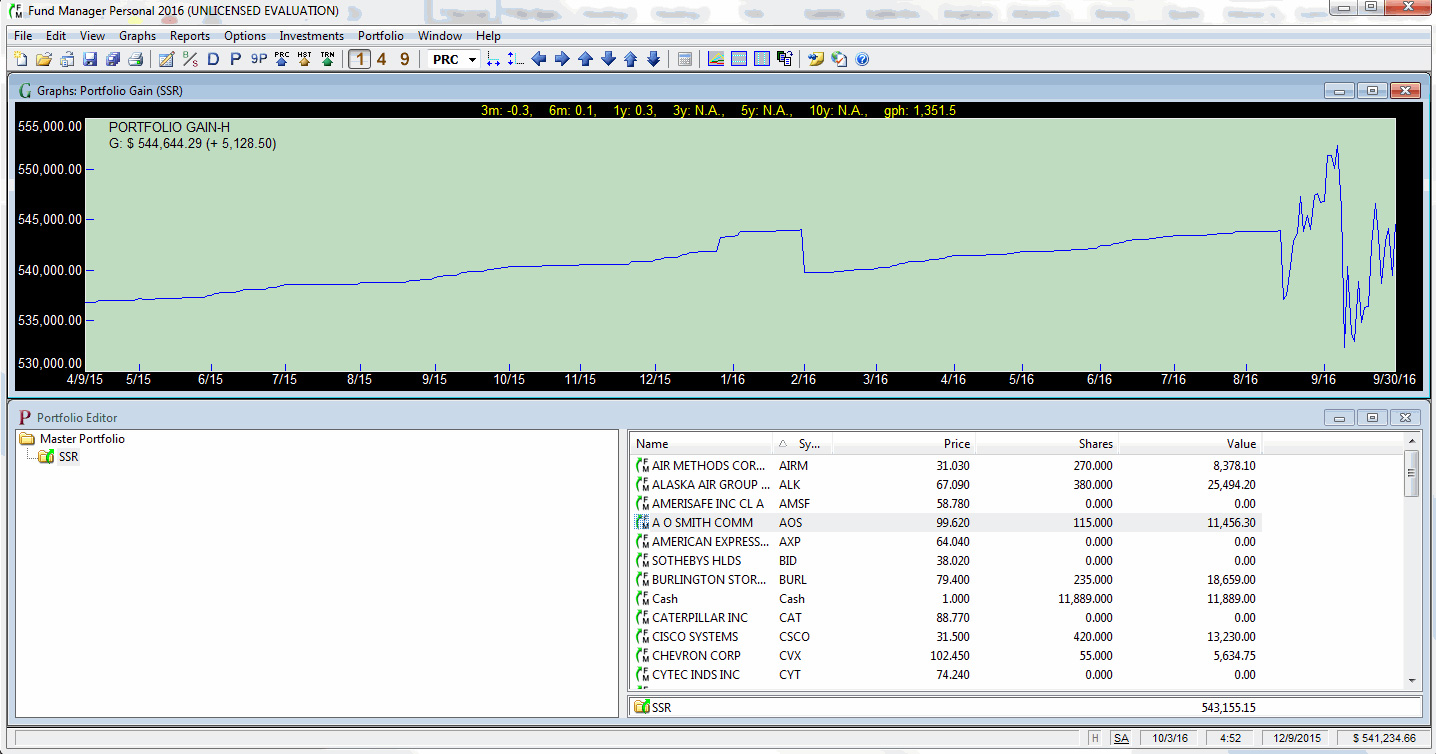
Once your personal portfolio is in the program (either through importing or manual entry), you can produce an assortment of graphs and charts, featuring a number of key metrics and portfolio fundamentals. Before selecting a graph, highlight the portfolio you want to analyze on the lower left-hand side of the screen. In the professional version, a set of risk/reward scatter plots are available to analyze performance versus risk. These plots view the relationships within each investment, asset type, currency, investment goal or sector. The scatter plots also have the functionality to graph the time-weighted return against the standard deviation of monthly returns, which allows users to identify underperforming securities based on the volatility of the investment. To select a specific graph, click on Graphs in the top toolbar.
In additional to the numerous graphs that Fund Manager offers, the program also provides users with over 20 reports.
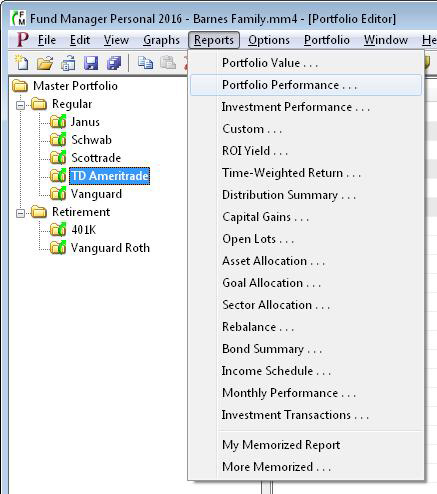
Time-weighted returns can be calculated based on individual securities and asset allocations, as well as for a particular time range. Another helpful report is the distribution summary. This report shows distributions paid for a particular time period and includes dividends, short-, mid- and long-term capital gains, and foreign tax distributions.
The asset allocation report goes beyond the portfolio asset allocation itself by showing the beginning value and percentage, invested amount, distribution, ending value and percentage gain for the selected time period. Rebalance reports is another key item available for Fund Manager users, outlining the differences between your current asset allocation and a target asset allocation. Before running any asset allocation report, ensure each holding and cash are accurately labeled.
Other key reports offered by Fund Manager include bond summary, income schedule, and monthly performance.
For more about Fund Manager, read the CI article that Beiley Software owner Mark Beiley wrote about his program earlier this year.
Investment Account Manager 3.0
Quant IX Software’s Investment Account Manager 3.0 (IAM) is a pure portfolio management program that is a great fit for investors who want extensive tracking analysis tools, priced at $89. Including the optional QuoteMedia data feed (further explained below), the cost of the program is $129. Investment Account Manager 3.0 offers a $20 discount to AAII members.
As mentioned, this program provides a trial demo account. The 30-day trial account provides a fully working version of the program. What’s nice about this program’s demo is that they have a few sample portfolios all set to go, immediately upon download. You can import your personal portfolios into the trial program, but for security and time reasons, it is convenient to be able to work with the program right away rather than finagling with your personal accounts. If you were strongly considering purchasing Investment Account Manager 3.0, you would want to import your current holdings and see how it functions. Importing your transactions from your brokerage account is a painless task, as this program has a user-friendly interface that is straightforward to work with.
New to the program is a re-designed and easier-to-use ledger entry system.
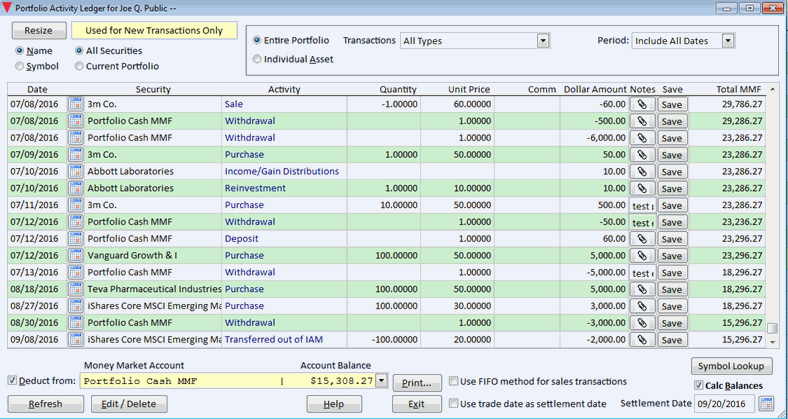
As a comprehensive portfolio management software program, Investment Account Manager 3.0 offers investment tracking features for a variety of asset types: cash, money market funds, U.S. government and agency securities, tax-exempt bonds, corporate bonds, preferred stocks, mutual funds, exchange traded funds, common stocks, options, and other investments. For common stocks, the program allows users to define stocks by size, style and sector. For mutual funds and ETFs, investment objective and fund composition can be tracked. Assets with maturity dates, such as fixed income and options, can be listed on a Maturity Schedule report to ladder investments and gauge reinvestment risk. Detailed transaction accounting includes purchases, sales, dividends, interest, expenses, universal stock split/dividend, spin-offs and mergers, tender/exchanges, return of capital, dividend reinvestment plans, security transfers, option activity and short sales. In all, Investment Account Manager 3.0 allows users to monitor the most common investment types, providing more than 50 professional reports that summarizing investment holdings and transaction activity.
In order to update portfolio values, you must click on the Update Prices button at the top of the program, since the program does not automatically update the values.
Investment Account Manager 3.0 also includes expanded and more comprehensive portfolio allocation and rebalancing tools, as shown below.
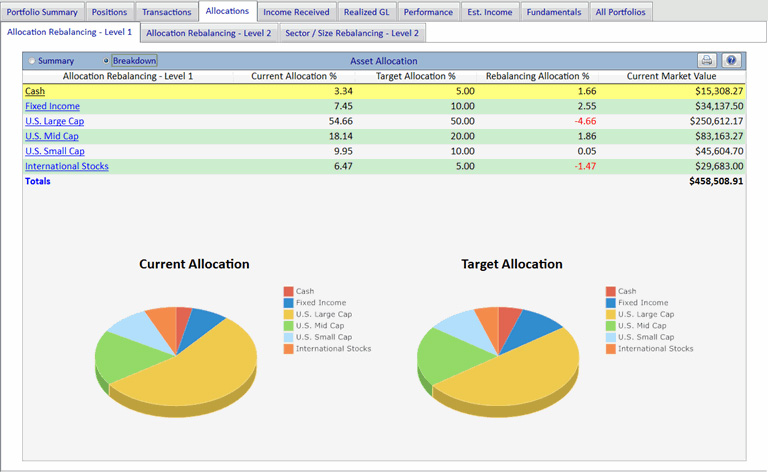
To meet long-term investment goals, most investors will need to maintain a well-balanced portfolio of stocks, bonds, cash and other investments. Investment Account Manager 3.0 provides several levels of portfolio allocation tools. In level 1 allocation analysis, the program offers portfolio allocation by asset class, identifying rebalancing needs based on user-defined allocation targets compared to current portfolio allocation weightings. In level 2 allocation analysis, Investment Account Manager includes the ability for investors to set target allocations for their stock holdings based on sector and size and then identifies rebalancing needs for their portfolio. Level 2 allocation by sector identifies the rebalancing needs based on user-defined allocation targets compared to current portfolio allocation weightings for common stocks based on sector. Level 2 allocation by size identifies the rebalancing needs based on user-defined allocation targets compared to current portfolio allocation weightings for common stocks based on large-, medium- and small- capitalization stocks.
Further, if using the optional QuoteMedia data feed, the fund allocation analysis (breakdown by allocation percentages for asset type, sector and size compositions) can be automatically populated and updated for mutual funds and exchange-traded funds. These allocation percentages are used in the level 2 allocation reports to include the portfolio compositions of any funds (mutual funds and ETFs) held in your portfolio when Investment Account Manager derives asset allocation percentages. This means each fund’s proportional impact (amount invested in cash, bonds and stocks, by sector, by size) will be included along with any individual holdings of each asset type held outside of your funds, providing a total allocation analysis of your portfolio.
New to Investment Account Manager 3.0 is the ability for users to store performance results for individual portfolios. These results can be derived and stored for monthly, quarterly or yearly periods. These performance results are used for deriving comparison returns and are listed on the Portfolio Performance Comparison Report. Returns can be derived using the internal rate of return (IRR) iterative model. The model properly weights the timing of cash flows (additions/withdrawals) for a portfolio or an individual asset, for a selected date range, to provide the return calculation. Internal rate of return can be equated to the compounded effective interest rate that a savings account would have had to earn in order to reach the portfolios’ current present value including all investment flows (purchases, sales, income, interest, reinvestment, etc.), while adjusted for timing of the specific flows.
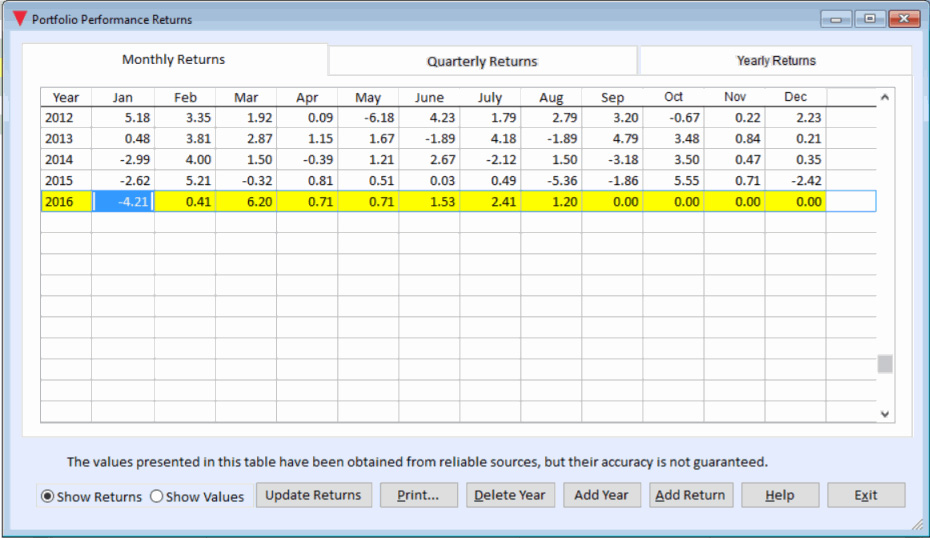
After deriving and storing the third, sixth, ninth, or 12th month of a calendar year, users will be prompted to decide whether they would like to derive the coinciding return for first, second, third or fourth quarter using geometric linking. Likewise, when the 12th month of a calendar year has been derived, users will be prompted if they would like to derive the coinciding yearly return using geometric linking. Geometrically linking provides a means of smoothing individual period returns and improves the measure of the time-weighted rate of return by geometrically linking interim (sub-period) IRRs.
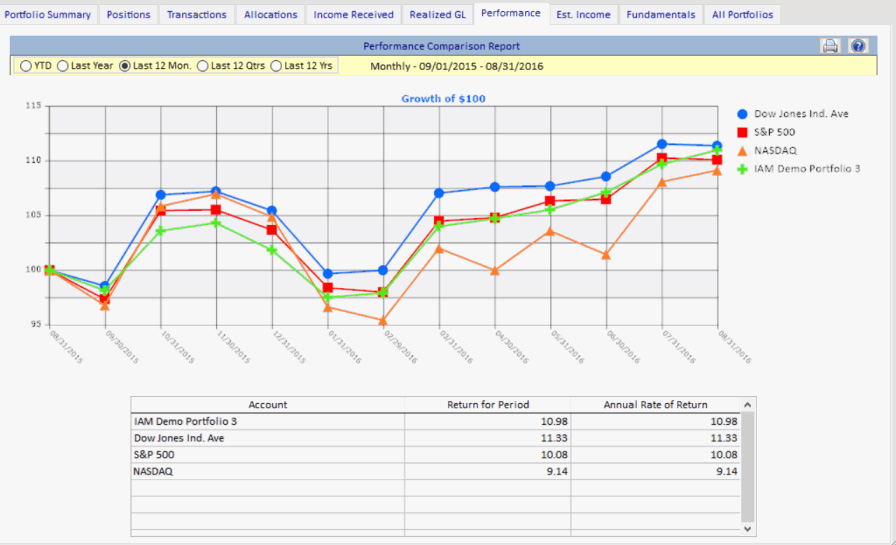
Once returns have been stored, users can plot their portfolio’s performance with comparisons to user-defined benchmark indexes on the Investment Account Manager Portfolio Performance Tab and matching Portfolio Performance Comparison Report. The Performance Comparison Report illustrates the growth of $100 for the selected portfolio and benchmark indexes for the selected monthly, quarterly, or annual periods.
The program allows users to track an unlimited number of portfolios. Each portfolio is unique, and transactions are segregated by account. This provides the user the ability to design portfolios by objective, reconcile quickly with specific accounts, and track various accounts with a single tool. New to Investment Account Manager 3.0 is the ability to group portfolios together for reporting purposes.

Once you have created portfolio groups, you can manage your portfolios on the comprehensive report setup screens. These screens allow you to customize any of the reports to create combinations of your portfolios. If for example, you have both tax-deferred and currently taxable accounts within the program, and you were interested in better understanding the overall asset allocation of all of your holdings, you would select the Asset Allocation Report and include all of your portfolios on that report using the report setup screen. Within seconds, the program produces a report showing your combined allocation by asset class (cash, bonds, stocks and other), by stock sector, and by stock size (large, medium or small cap). With this information at a glance, you can better decide if you are meeting the objectives you have set forth for your individual portfolios, as well as for the aggregate whole.
A very useful help section covers most of the program’s functionalities and capabilities in a comprehensive, step-by-step manner. To open the Help Menu, select the Help pulldown on the taskbar, and click on Contents.
If you have used Investment Account Manager in the past, be cognizant of the array of program improvements, and take advantage of the free trial offer to see what the product is all about through your own lens. The program is updated regularly for user suggestions, improvements, and corrections as needed.
Thanks to Matthew K. Willms, president and co-founder of Quant IX Software, for providing the collection of screenshots and detailed descriptions of the program’s latest features.
Quicken Premier 2016
Quicken is one of the most well-known financial software programs available. The current version is Quicken Premier 2016, which can be bought for $104.99. Unlike the other programs in this article, Quicken Premier is a comprehensive money management tool on top of portfolio management software. Due to this extra functionality, the program is proficient in handling investment accounts as well as a variety of banking accounts, including checking and savings. You can track and pay your bills, account for cash transactions, and even get reminder transactions, which comes in handy if you have a tendency to lose track of your bill payments. At the same time, users can receive support with buy/sell decisions on the program, offering tremendous function flexibility.
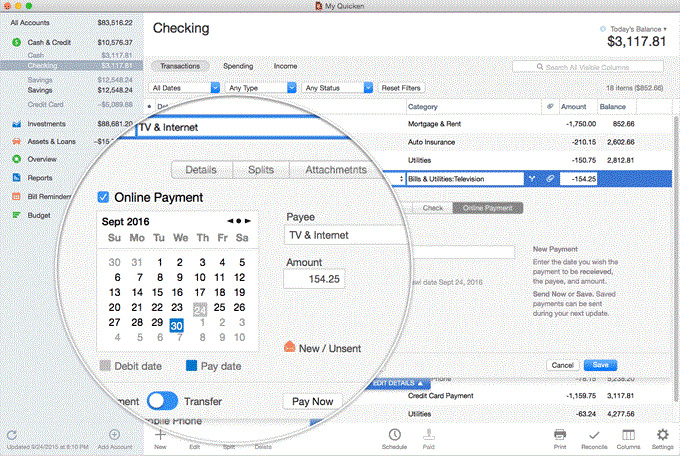
Since Quicken Premier is a money management tool, it has an expanded number of banks and brokerages to which it can automatically sync. The sync process is similar to that of the other programs, where you are required to submit your brokerage account information. Some nice features are that Quicken also automatically categorizes most of the items after syncing with an online account and portfolio values are updated every 15 minutes. Keep in mind that if you do not want to automatically sync your brokerage transactions to the program, you can always manually enter in the data.
The assets handled include cash, stocks, bonds, mutual funds, ETFs, options and even college funds. Unfortunately, there currently is no support for real estate investments, annuities or other user-defined securities. If for some reason the asset classes are not identified when you load your personal portfolio into the program, you can quickly correct any missing or inaccurate information by clicking on the name of the security and selecting “edit security details.”
Quicken Premier offers a comprehensive roster of reports, including reports for capital gains, investing activity, transactions, income, performance and asset allocation, to name a few. The reports menu at the top of the program lists all reports.
The Investing activity report displays your interest, dividends, short- and long-term capital gains and realized gains. Moreover, the report will feature your beginning and ending values along with deposits and withdrawals. The time-period ranges are flexible: You can toggle between daily, monthly, quarterly, yearly or just create your custom time period.
Another report worth mentioning is one that shows the maturity date of fixed-income investments. Typically, this information is provided by a broker only for customers who have a full- service account. These types of reports assist investors in building a bond ladder, a series of bonds with interest payments and maturity dates spaced across several months or years. Investors use bond ladders in order to reduce interest rate risk and also to receive income on a regular basis.
In addition to its solid functionality with money management, Quicken also offers some tax capabilities. Quicken Premier is the only program of the four in this comparison that offers tax- adjusted return performance reports, and also includes TurboTax as a data import functionality. Furthermore, the program assists in tax scheduling and planning, since taxes play a role not only in our investments, but also in our money management as well. Some of the tax reports assist users in determining their capital gains. If you use itemized deductions, the program also features a Schedule A report. Like the investing activity reports, the tax-related reports can also be shown across customizable time ranges.
Personal Portfolio Manager 7
Personal Portfolio Manager from OWL Software is the new addition to our comparison. This program is used by both individual investors and professional portfolio managers. A 30-day free trial demo is available to test out its functionalities and capabilities. The program costs only $69, which is the lowest price among the programs discussed here.
It is very important to understand not only that the program runs on Windows, but it runs only on specific versions of Windows. The system requirements are Windows 95 through Windows 8. If you have already upgraded to Windows 10, Personal Portfolio Manager is out of your selection choices. Since many Windows users are upgrading to Windows 10, it will be essential for OWL Software to upgrade its system requirements so Personal Portfolio Manager does not become an obsolete platform.
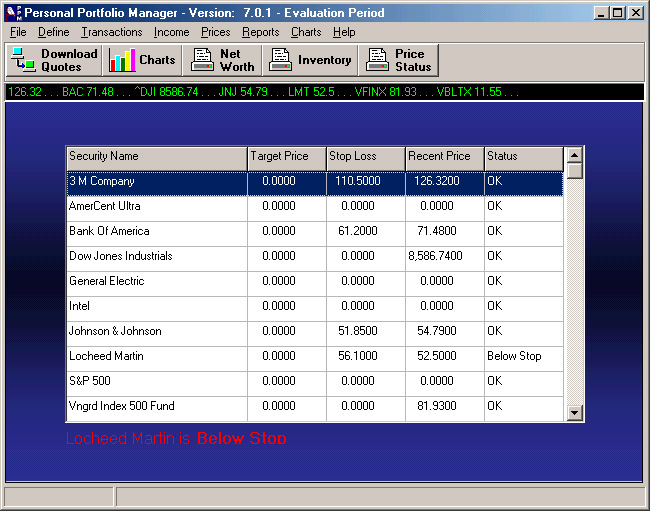
The Personal Portfolio Manager software lets users set up and manage up to 999 portfolios with an unlimited number of securities. With this software, users can manage brokerage accounts, plan for retirement and conduct “what-if,” technical and trend analysis on the data within their portfolios. Investors can manage and track portfolios consisting of stocks, bonds, mutual funds, closed-end funds, cash accounts, physical assets, liabilities and even options. A nice functionality is giving users the flexibility of using IRS-approved capital gain/loss calculation methods. Other key tools for analysis include stochastics, RSI and moving averages.
There are a few downsides to the program, however. Portfolio data is not updated automatically, so users must update the data through the program on demand. Additionally, the program does not support brokerage accounts, so all transactions must be entered manually. However, version 7 does include built-in capabilities for downloading current and historical stock quotes from the internet for free.
The program supports basic transactions such as buys/sells, dividends, reinvestments, splits and reverse splits. Reports include status reports (net worth, inventory, etc.), income reports (interest, dividends, realized capital gains), transactions reports and numerous performance reports such as return on investment and return on value.
Personal Portfolio Manager offers a User’s Guide located in the Help pulldown of the taskbar. This comprehensive guide will be of great assistance when you first start out with the program.
Unlike the other programs in this comparison, Personal Portfolio Manager does not offer many extra features such as tax scheduling/planning or stock screens. However, this program can still do the job based on your needs. If you need more complexity and the added features, I suggest checking out the other programs, but if you are a basic individual investor who does not need all the bells and whistles, this program may do the trick.
Conclusion
All four programs compared here provide users with great choices to manage, track and analyze their investments. Three of the four programs offer trial demo accounts, and I highly suggest you take advantage of these opportunities. Researching what each portfolio management software program has to offer is a step in the right direction in terms of the decision-making process, but it certainly is not the last. Hands-on experience is the best way to get a grasp of a program’s functionality, features and ease-of-use. On top of that, there is no cost to accessing the demos, so it only makes sense to test-drive the program before purchase.
I am not rating the portfolio management software on a scale based on attributes such as performance, documentation, ease of use, price, and pros/cons as was done in previous editions of this article. The ratings are subjective and everyone has their own taste and preference. Some users’ needs may be best fit in Program A rather than Program B, so I prefer to remove the bias and let you decide.
Fund Manager, Investment Account Manager and Personal Portfolio Manager are all focused portfolio management software programs. Quicken Premier has an added functionality that lets users take care of personal finance measures such as paying/tracking bills. If personal finance capabilities are a must, Quicken Premier may be worth considering even though it does not offer a trial demo.
The downloadable comparison grid assembles all the features of each program into a spreadsheet for comparison.
Best of luck throughout your selection process.
Discussion
FREE REPORT

Kenneth Dodds from SC posted over 9 years ago:
Barbara Schumann from MD posted over 9 years ago:
Kenneth Dodds from SC posted over 9 years ago:
Brian Gilmour from BC posted over 9 years ago:
Jackie McClellan from IL posted over 9 years ago:
John Izydorczyk from FL posted over 9 years ago:
John Izydorczyk from FL posted over 9 years ago:
Jackie McClellan from IL posted over 9 years ago:
F P from CT posted over 9 years ago:
Jackie McClellan from IL posted over 9 years ago:
David Nelson from CA posted over 9 years ago:
Donald Myers from AZ posted over 9 years ago:
Kenneth Stone from WA posted over 9 years ago:
Jeff Stanat from CO posted over 9 years ago:
Terry Iorns from NM posted over 8 years ago:
Terry Iorns from NM posted over 8 years ago:
L Scheirman from CO posted over 7 years ago:
Donald Myers from AZ posted over 7 years ago:
Carol from CO posted over 6 years ago:
HUGO D from CA posted over 5 years ago:
You need to log in as a registered AAII user before commenting.
Log InCreate an account