In any race, it does little good to get out in front of the pack if you can’t maintain your lead.
For growth stocks, keeping pace is the only way to stay in the race. While the market rewards companies that are able to grow quickly, it can also brutalize companies that are not able to sustain their growth.
For that reason, if you are using a growth-based stock selection approach, it is important to look for companies exhibiting sustainable or increasing growth in sales or earnings.
Martin Zweig—named stockpicker of the year for two years running in the 1990s by the Hulbert Financial Digest—is a strong advocate of growth. He outlined his strategy in his book “Martin Zweig’s Winning on Wall Street” (Warner Books, 1997).
Zweig’s approach is to identify stocks that have:
- Strong growth in earnings and sales,
- A reasonable price-earnings ratio given the company’s growth rate, and
- Relatively strong price action.
A screen adapted from Zweig’s methodology is built into Stock Investor Pro, AAII’s fundamental stock screening program and research database.
Figure 1.
Zweig Screen Performance
|
|
CLICK ON IMAGE TO
SEE FULL SIZE.
|
|
Zweig’s Performance
The companies passing the Martin Zweig screen have been reported and tracked on AAII.com for over seven years with impressive results.
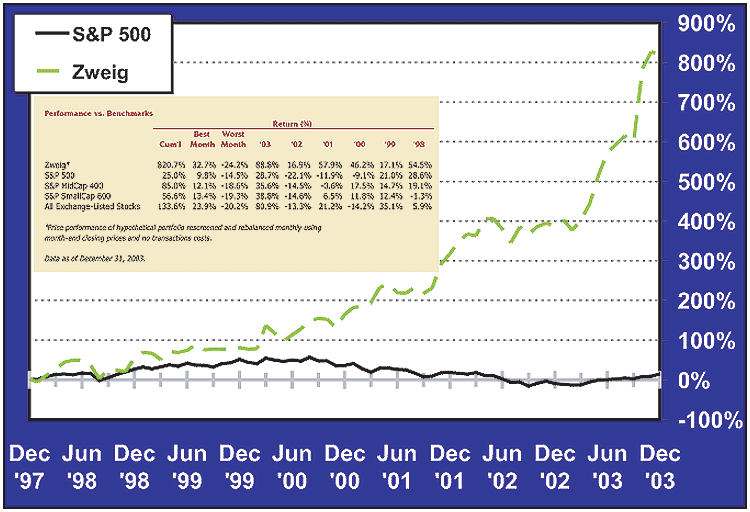
As indicated in Figure 1, stocks passing the Zweig screen have surpassed the performance of the S&P 500 index since December of 1997, as well as the MidCap 400 and SmallCap 600 indexes.
Overall, the Zweig screen has generated a cumulative return of 820.7% over the period from December 1997 to December 2003.
| TABLE 1. Current Portfolio Characteristics |
| |
Zweig |
Exchange- Listed Stocks |
| Price-earnings ratio |
17.3 |
21.0 |
| Price-to-book ratio |
3.9 |
2.1 |
| EPS growth rate (hist 5yr) |
23.5% |
2.3% |
| EPS growth rate (est 3-5yr) |
15.0% |
13.8% |
| Market cap (million) |
$1,554.4 |
$339.4 |
| Relative strength vs. S&P |
81.0% |
41.0% |
| Monthly Observations |
| Average no. of passing stocks |
13 |
|
| Highest no. of passing stocks |
29 |
| Lowest no. of passing stocks |
1 |
| Monthly turnover |
45% |
The characteristics of the stocks passing the Zweig screen are presented in Table 1.
While the screen does have some value elements, Zweig leans more toward growth. Despite this, however, the median price-earnings ratio (share price divided by earnings per share) of those companies currently passing the Zweig screen (17.3) is lower than the price-earnings ratio for all exchange-listed stocks (21.0).
Interestingly, however, the median price-to-book ratio for the Zweig stocks (3.9) is above the median value for all exchange-listed stocks (2.1).
Given the stringent growth requirements of the Zweig screen, it is perhaps not surprising that the passing companies have a median five-year growth rate in earnings of 23.5% compared to just 2.3% for all exchange-listed stocks.
As shown in Table 1, the companies that pass the Zweig screen have been strong price performers, and the current crop does not disappoint. Looking at the relative strength versus the S&P 500, the companies passing the Zweig screen outperformed the S&P 500 by 81.0%, whereas exchange-traded stocks have outperformed the index by 41.0%.
Passing Companies
Table 2 lists the 13 stocks that currently pass the screen, with the list ranked in descending order by 26-week relative strength. The number of companies passing the Zweig screen matches the historical average number of companies that pass. Specific criteria for the screen are listed below Table 2.
| TABLE 2. Keeping Pace: Stocks That Passed the Zweig Screen |
| |
EPS Dil Cont Growth |
Sales
Grth
3 Yrs
(%) |
Price-
Earnings
Ratio
(%) |
L/T
Debt/
Eqty
Q1
(%) |
Ind L/T
Debt/
Eqty
Q1
(%) |
26-Wk
Rel
Strth
(S&P=0)
(%) |
Description |
Q5 to Q1
(%) |
3 Yrs
(%) |
| iMERGENT, Inc. (O: IMGG) |
80.0 |
26.4 |
33.8 |
16.0 |
3.8 |
0 |
63 |
electronic commerce servs |
| Tractor Supply Co. (M: TSCO) |
50.0 |
24.7 |
20.7 |
26.8 |
16.9 |
45.5 |
49 |
farm supply |
| Bradley Pharm’ls (N: BDY) |
116.7 |
112.3 |
28.1 |
23.9 |
72.2 |
4.1 |
40 |
OTC & prescription pharm’cals |
| Pediatrix Medical Gp (N: PDX) |
32.9 |
17.8 |
27.0 |
17.3 |
0.4 |
38.1 |
29 |
physician management services |
| Pulte Homes, Inc. (N: PHM) |
39.9 |
20.9 |
25.7 |
10.5 |
71.5 |
42.3 |
27 |
homebuilding holding company |
| CACI International (N: CAI) |
37.5 |
25.4 |
20.3 |
29.4 |
0.0 |
0 |
26 |
information technology services |
| Countrywide Financ’l (N: CFC) |
341.2 |
22.6 |
33.8 |
6.7 |
13.3 |
54.6 |
26 |
mortgage banking holding co |
| Standard Pacific (N: SPF) |
152.9 |
17.4 |
16.2 |
8.9 |
121.3 |
42.3 |
23 |
homebuilder |
| Coventry Health Care (N: CVH) |
68.2 |
51.1 |
18.3 |
18.0 |
20.1 |
38.1 |
21 |
managed health care |
| Hibbett Sporting Gds (M: HIBB) |
61.9 |
17.6 |
17.0 |
24.7 |
0.0 |
21.7 |
21 |
sporting goods stores |
| H&R; Block, Inc. (N: HRB) |
128.6 |
35.4 |
15.9 |
15.7 |
52.6 |
8.9 |
14 |
tax & investment servs |
| Lowe’s Companies (N: LOW) |
30.2 |
28.1 |
18.5 |
24.1 |
37.3 |
45.5 |
14 |
home improvement stores |
| MBNA Corporation (N: KRB) |
70.0 |
18.6 |
16.3 |
14.7 |
114.9 |
0.8 |
6 |
bank holding co |
|
*Minus sign designates net sell transactions; plus sign indicates net buy transactions.
Source: AAII’s Stock Investor Pro / MarketGuide Inc. Data as of December 31, 2003. Insider transaction data from MSN Money Web
site.
|
One of the cornerstones of Zweig’s stock-picking strategy revolves around what he terms “reasonable gains in sales and earnings.” To this end, the Zweig screen examines both short-term and long-term growth.
For short-term growth (same-quarter growth in fully diluted earnings from continuing operations for the latest fiscal quarter), Countrywide Financial leads the way with a growth rate of 341.2%, spurred by record mortgage banking earnings. Meanwhile, home-improvement store Lowe’s Corporation just cleared Zweig’s 30% growth rate hurdle at 30.2%.
In terms of longer-term growth, Bradley Pharmaceuticals had the highest three-year growth rate in earnings at 112.3%, while Standard Pacific was at the other end of the spectrum with a growth rate of 17.4%.
While Zweig is interested in growth, he is leery of paying too much for it. Ideally, he likes to select stocks whose price-earnings ratios are near or slightly above the “market” average. He avoids stating any absolute ceiling, citing the fact that valuation levels rise and fall over time.
The Zweig screen requires a minimum price-earnings ratio of 5.0 to avoid potentially troubled firms, and a maximum level of one and a half times the median, or midpoint, price-earnings ratio for the entire Stock Investor database.
As of January 2, 2004, the median price-earnings ratio for the stock universe was 20.4, placing the upper restraint at 30.6 (1.5 times 20.4). The price-earnings ratio for the 13 companies passing the Zweig screen ranged from a low of 6.7 for Countrywide Financial to 29.4 for CACI International—a provider of information technology and communication solutions.
Conclusion
When following any stock screening strategy, it is important to remember that the process is only a stepping-off point for further analysis. Martin Zweig’s principles help to reveal a collection of companies exhibiting strong earnings and sales growth, reasonable price-earnings ratios relative to the overall stock universe, and strong relative strength.
However, the stocks passing this or any other screen are not buy recommendations, they are merely a manageable subset of the overall stock universe on which to perform additional due diligence.




No comments have been added yet. Add your thoughts to the discussion!
You need to log in as a registered AAII user before commenting.
Log InCreate an account