



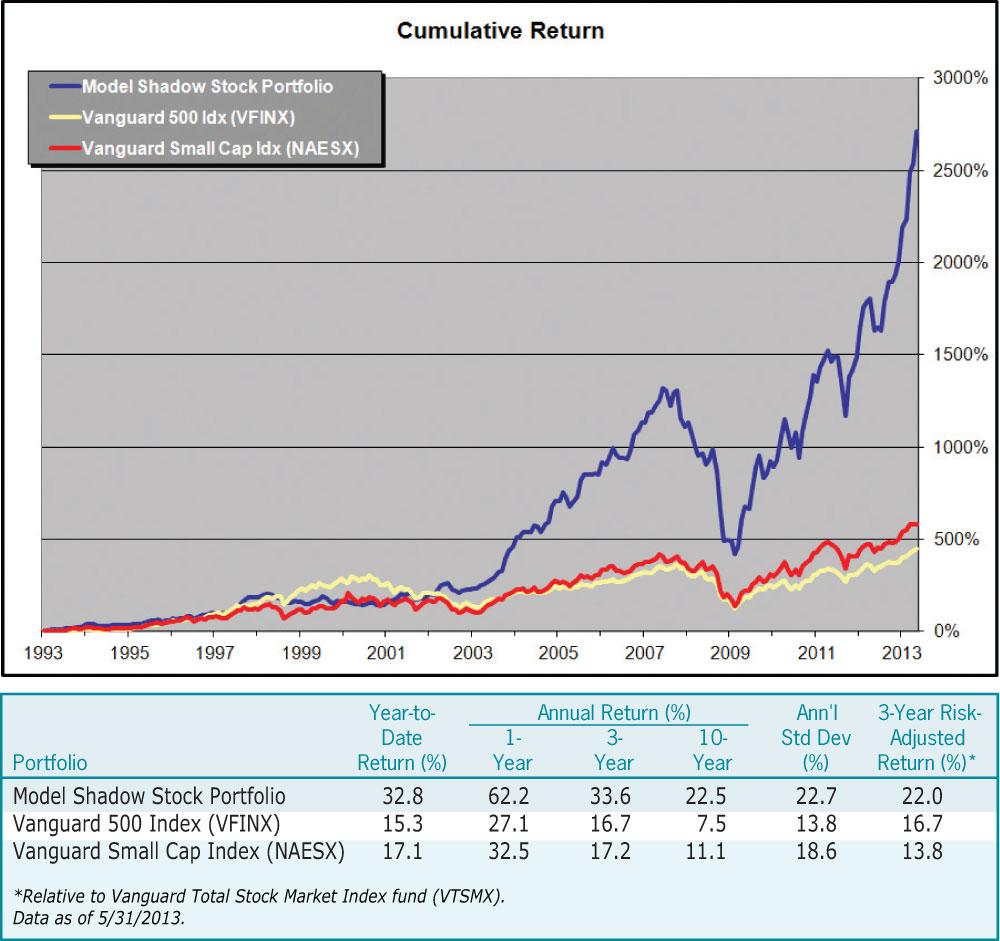
It has been a very strong year for the Model Shadow Stock Portfolio. The portfolio is up 32.8% year-to-date compared to the S&P 500 index, which is up 15.3% as measured by the Vanguard 500 Index fund  (VFINX).
These results as well as results over longer periods can be seen in Figure 1 and Table 3.
Most U.S. indexes are now above their highs prior to the Great Recession. There has been quite a bull market run, but for most indexes it has been mostly recovery of previous losses. Most pundits keep talking about a correction and get excited every time there are a few down days, but the trend keeps edging up—at least so far.
There is concern that as bond returns go up investors will switch out of stocks. I think it may be a while before bond yields increase significantly, and I think more investors are switching into stocks and will continue to do so for some time to come. To me the stock market does not look frothy or exhibit excessive exuberance. However, the market is always volatile in both directions even if it is overpriced or underpriced.
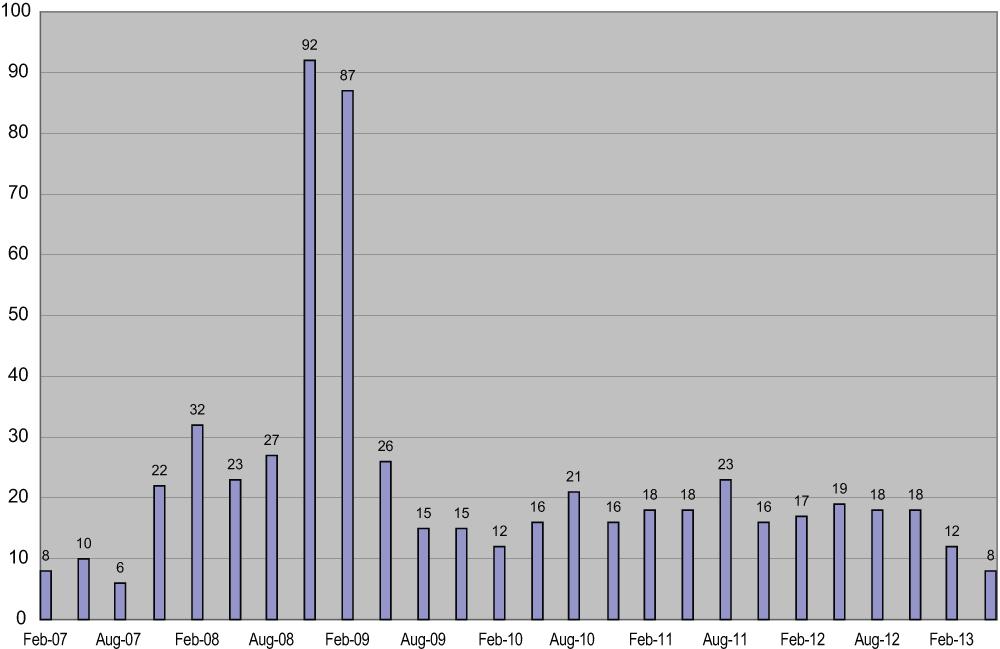
We have been following the number of qualifying stocks each quarter under our liquidity rules for the portfolio. We were down to eight this period and four of those were Chinese stocks. This is clearly on the low side when we observe Figure 2. While we do not have enough history for a meaningful analysis, it does indicate that the market is getting more reasonably priced—at least the small-cap value part of the market.
| Current | 52-Week | Market | P/E | P/B | Div | |||
| Price | High | Low | Cap | Ratio | Ratio | Yield | ||
| Company (Ticker) | ($) | ($) | ($) | ($ Mil) | (X) | (X) | (%) | Notes |
| Addus Homecare Corp. (ADUS) | 17.99 | 18.90 | 3.57 | 195.9 |
18.9
|
1.80 | 0.0 | |
| Alamo Group, Inc. (ALG) | 42.50 | 44.13 | 27.07 | 513.1 |
17.6
|
1.64 | 0.7 | |
| Alpha & Omega Semicon (AOSL) | 7.89 | 10.45 | 6.64 | 201.2 |
41.5
|
0.71 | 0.0 | |
| CSS Industries, Inc. (CSS) | 27.65 | 31.50 | 17.86 | 261.8 |
17.0
|
1.05 | 2.2 | |
| Ducommun Incorporated (DCO) | 19.43 | 26.71 | 7.71 | 206.0 |
11.6
|
0.91 | 0.0 | |
| Ennis, Inc. (EBF) | 17.11 | 17.60 | 13.70 | 447.6 |
18.0
|
1.24 | 4.1 | |
| Flexsteel Industries (FLXS) | 22.73 | 26.29 | 18.56 | 161.4 |
12.4
|
1.09 | 2.6 | |
| Gilat Satellite Networks (GILT) | 5.49 | 6.20 | 2.31 | 228.9 |
nmf
|
0.94 | 0.0 | |
| Hardinge Inc. (HDNG) | 12.75 | 14.69 | 8.20 | 149.9 |
9.6
|
0.95 | 0.6 | |
| Hooker Furniture Corp. (HOFT) | 17.50 | 18.31 | 10.01 | 188.1 |
21.9
|
1.43 | 2.3 | |
| International Shipholding (ISH)* | 18.63 | 20.93 | 13.00 | 134.6 |
8.7
|
0.47 | 5.4 | qualified as of 5/31/2013 |
| Key Tronic Corp. (KTCC) | 11.36 | 12.28 | 7.15 | 119.2 |
8.8
|
1.28 | 0.0 | |
| Kimball International (KBALB) | 9.79 | 13.25 | 6.72 | 292.5 |
20.0
|
0.93 | 2.0 | |
| Marlin Business Services (MRLN) | 23.38 | 25.97 | 13.74 | 300.7 |
22.3
|
1.66 | 1.7 | |
| Medical Action Industries (MDCI) | 8.40 | 8.99 | 2.25 | 137.7 |
nmf
|
1.47 | 0.0 | |
| Mitcham Industries (MIND) | 15.61 | 18.79 | 11.51 | 200.4 |
12.3
|
1.13 | 0.0 | |
| Olympic Steel, Inc. (ZEUS) | 25.33 | 26.83 | 14.77 | 276.8 |
230.3
|
0.95 | 0.3 | |
| PC Connection, Inc. (PCCC) | 16.79 | 17.65 | 8.90 | 438.5 |
13.2
|
1.46 | 0.0 | |
| PCM Inc (PCMI) | 7.66 | 9.11 | 5.06 | 87.8 |
13.7
|
0.75 | 0.0 | qualified as of 5/31/2013 |
| RCM Technologies, Inc. (RCMT) | 5.57 | 6.72 | 4.89 | 68.7 |
22.3
|
1.15 | 0.0 | |
| Renewable Energy Gp (REGI) | 13.53 | 14.51 | 4.28 | 414.7 |
11.5
|
1.11 | 0.0 | |
| REX American Resources (REX) | 27.92 | 30.97 | 14.43 | 228.3 |
nmf
|
0.91 | 0.0 | earnings probation (2012 Q4) |
| Rocky Brands, Inc. (RCKY) | 14.62 | 16.41 | 10.74 | 109.9 |
12.2
|
0.87 | 2.7 | |
|
Saga Communications (SGA) |
46.05 | 51.61 | 25.31 | 261.7 |
16.7
|
2.43 | 0.0 | approaching value limit |
| Salem Communications (SALM) | 7.46 | 10.14 | 4.46 | 184.0 |
nmf
|
0.98 | 2.7 | earnings probation (2013 Q1) |
| Shoe Carnival, Inc. (SCVL) | 24.28 | 25.37 | 18.80 | 496.9 |
17.0
|
1.65 | 1.0 | |
| Standard Motor Products (SMP) | 33.80 | 34.62 | 11.94 | 776.3 |
16.6
|
2.43 | 1.3 | approaching size & value limits |
| TravelCenters of America (TA) | 11.13 | 12.5 | 4.18 | 328.7 |
9.9
|
0.86 | 0.0 | |
| VOXX International (VOXX) | 11.12 | 11.64 | 5.55 | 265.2 |
11.8
|
0.59 | 0.0 | |
| Willis Lease Finance (WLFC) | 13.25 | 16.28 | 11.31 | 116.9 |
nmf
|
0.53 | 0.0 | |
| *Company is new to the portfolio. Added 6/6/2013. | ||||||||
| Source: AAII’s Stock Investor Pro/Thomson Reuters. Data as of 5/31/2013. | ||||||||
Explanation of Notes
Approaching Size Limit: Stocks are sold if their market capitalization goes above three times the initial maximum criterion. The current market capitalization maximum for initial screening is $240 million. Stocks are marked “approaching size limit” if their current market cap exceeds 2½ times the initial criterion, or $600 million.
Approaching Value Limit: Stocks are sold once their price-to-book-value ratio goes above three times the initial criterion. The current initial price-to-book ceiling is 0.80. Stocks are marked “approaching value limit” if their current price-to-book-value ratio exceeds 2½ times the initial criterion, or 2.00.
Earnings Probation: If the last 12 months’ earnings from continuing operations are negative, the stock is put on probation; if a subsequent quarter has negative earnings prior to 12-month earnings becoming positive, the stock is sold. The date within the parentheses lists the fiscal quarter during which the company first reported negative trailing 12-month earnings.
Qualified as of: Stock still qualified as a buy when the screen was run with current data. Stocks that don’t currently qualify as a buy are held until they meet one of the sell rules.
See the Model Shadow Stock Portfolio area of AAII.com for more information.
Portfolio Changes
Table 1 lists the current holdings in the Model Shadow Stock Portfolio. We sold Sterling Construction Co. (STRL) because of negative earnings. We replaced it with International Shipholding Corp. (ISH), as can be seen in Table 2. Saga Communications (SGA) was on the border of the value limit, but our general rule when a decision is close is not to trade because turnover is the known enemy.
Variations on the Basic Portfolio
Many members ask if we have measured the results an investor would obtain if he followed the rules but made different selections or acted more frequently than quarterly. Unfortunately, the variations become almost infinite because of the various changes that can be made, and we cannot track all the possibilities. Here are some possibilities.
| Company | Reason |
| Buy | |
| International Shipholding Corp. (ISH) | |
| Sell | |
|
Sterling Construction Co. (STRL) |
negative earnings |
Variation 1. The Model Shadow Stock Portfolio is a real portfolio, so I can only buy when I free up cash by selling. So I select a required number of stocks from all that qualify. I use a liquidity requirement ($150,000 average volume per day), but an individual with a $100,000 portfolio and 20 stocks could tolerate much less liquidity and could choose differently.
Variation 2. I only make changes quarterly. With a database (such as AAII’s Stock Investor Pro) individuals can follow the rules monthly or weekly and get different selections than I obtain.
Variation 3. A new follower of the portfolio only buying stocks when I buy them might take two years or more to become fully invested, so investors may want to buy qualifying stocks at a later time than I do. This is also true of investors with new funds to invest who don’t want to wait until they sell something.Even if we could define all the possibilities, backtesting is very inaccurate because of the difficulty in establishing the price at which a given volume of shares could have been traded. This is particularly true with micro-cap stocks, which have wide bid/ask spreads.
Looking Ahead
Strong tax receipts and the cost-cutting sequester has put off the day of reckoning for Congressional and administration decision-making, so a governmental shutdown is no longer imminent and foreign concerns seem somewhat reduced. But there will surely be another problem cropping up over the next three months.
We will review the portfolio again in the October issue of the AAII Journal, and in the meantime you can keep abreast at here.
| Average Annual Return (%) | Cumulative Value of $10,000 ($) | |||||
|
Model
|
Vanguard
|
Vanguard
|
Model
|
Vanguard
|
Vanguard
|
|
|
Shadow
|
500
|
Small Cap
|
Shadow
|
500
|
Small Cap
|
|
|
Stock
|
Index
|
Index
|
Stock
|
Index
|
Index
|
|
| Year |
Portfolio
|
(VFINX) |
(NAESX)
|
Portfolio
|
(VFINX) |
(NAESX)
|
| 1993 | 32.3 | 9.9 | 18.7 | 13,230 | 10,989 | 11,870 |
| 1994 | 2.0 | 1.2 | -0.5 | 13,492 | 11,118 | 11,810 |
| 1995 | 20.7 | 37.4 | 28.7 | 16,291 | 15,282 | 15,204 |
| 1996 | 22.3 | 22.9 | 18.1 | 19,927 | 18,775 | 17,959 |
| 1997 | 44.3 | 33.2 | 24.6 | 28,756 | 25,010 | 22,375 |
| 1998 | -8.9 | 28.6 | -2.6 | 26,188 | 32,168 | 21,790 |
| 1999 | 0.0 | 21.1 | 23.1 | 26,187 | 38,945 | 26,831 |
| 2000 | -7.7 | -9.1 | -2.7 | 24,163 | 35,418 | 26,116 |
| 2001 | 21.4 | -12.0 | 3.1 | 29,325 | 31,160 | 26,926 |
| 2002 | 10.8 | -22.1 | -20.0 | 32,506 | 24,259 | 21,535 |
| 2003 | 73.1 | 28.5 | 45.6 | 56,268 | 31,174 | 31,360 |
| 2004 | 43.7 | 10.8 | 19.9 | 80,843 | 34,530 | 37,587 |
| 2005 | 17.9 | 4.8 | 7.4 | 95,353 | 36,180 | 40,376 |
| 2006 | 29.4 | 15.6 | 15.6 | 123,363 | 41,832 | 46,687 |
| 2007 | -1.8 | 5.4 | 1.2 | 121,166 | 44,083 | 47,227 |
| 2008 | -50.8 | -37.0 | -36.0 | 59,582 | 27,764 | 30,217 |
| 2009 | 72.3 | 26.5 | 36.1 | 102,665 | 35,120 | 41,130 |
| 2010 | 45.4 | 14.9 | 27.7 | 149,238 | 40,358 | 52,529 |
| 2011 | 6.3 | 2.0 | -2.8 | 158,701 | 41,155 | 51,067 |
| 2012 | 33.3 | 15.8 | 18.0 | 211,588 | 47,666 | 60,274 |
| YTD | 32.8 | 15.3 | 17.1 | 280,982 | 54,966 | 70,561 |
| Since Incep | 17.7 | 8.7 | 10.0 | 280,982 | 54,966 | 70,561 |
| Data as of 5/31/2013. | ||||||
Model Shadow Stock Portfolio Rules
Purchase and Sales Rules
Stock purchases must meet these criteria:
- No bulletin board or pink sheet stocks will be purchased.
- Price-to-book-value ratio must be less than 0.80. (Figure will change gradually with changes in overall market values.)
- Market capitalization must be between $30 million and $240 million. (Figure will change gradually with changes in overall market values.)
- The firm’s last quarter and last 12 months’ earnings from continuing operations must be positive.
- No financial stocks or limited partnerships will be purchased.
- No stocks on foreign exchanges or ADRs will be purchased because of different accounting and/or withholding tax on dividends.
- The share price must be greater than $4.
- In order to reduce trading by avoiding stocks that are forever marginal, any stock that was sold within two years will not be rebought.
- Note second item under Stock Order Guidance concerning spreads when buying shares.
- Price-to-sales ratio must be less than 1.2. (Figure may change gradually with changes in overall market values.)
- Eliminate any company that failed to file a 10-Q (quarterly) report in the last six months.
Stocks are sold if any of the following occur:
- If last 12 months’ earnings from continuing operations are negative, the stock is put on probation; if a subsequent quarter has negative earnings prior to 12-month earnings from continuing operations becoming positive, the stock is sold.
- The stock’s price-to-book-value ratio goes above three times the initial criterion.
- Market capitalization goes above three times the initial maximum criterion.
Stock Order Guidance
- These rules are for general guidance. Your own experience, market conditions and the size of the position will impact your own decisions. The results in the model portfolio were obtained while sometimes paying more.
- Market orders are not used. Instead, if the quoted bid-ask spread is less than 2% (ask price minus bid price, divided by ask price), place a limit order at the ask price for a buy and at the bid price for a sell. If the bid-ask spread is more than 2%, try to place a limit order between the bid and ask prices to keep transaction costs low. If necessary, build a position gradually. With low commissions, it is often better to place partial orders than to try to establish a large position all at once. Be patient.
- The average daily dollar volume should be at least four times the amount needed for your position. This will ensure liquidity to get in and out of the position, even if you need to grow the position gradually and sell gradually. This will result in a varying number of qualifying stocks for each investor.
- For NASDAQ stocks, it appears to be better to use day orders. If the order is not filled, it is placed again with a slight adjustment. For NYSE and Amex stocks, good-till-canceled (GTC) orders are used to keep a place in line in the specialists’ books. If the market isn’t close to the desired price, the price is adjusted in a few days with a new GTC order.
- If price changes cause a stock to become ineligible (due to changes in price-to-book-value ratio or market capitalization) when only part of the order has been filled, stocks already purchased are kept but the balance of the order is canceled.
Management Rules
- Equal dollar amounts are invested in each stock initially.
- Decisions are made only at the end of each quarter. In order to react to the majority of earnings reports as soon as possible, quarterly reviews are made in February, May, August, and November.
- Best judgment is used for tenders or mergers, but all criteria must be obeyed.
- At the end of a quarter, if receipts from stocks sold exceed requirements for new purchases, the excess receipts—up to 5% of the portfolio’s value—are kept in cash until the next quarter. If the excess receipts are greater than 5% of the total portfolio value, the amount above 5% is distributed to smaller holdings that still qualify as buys. Efficient quantities are purchased: If over 10% of the portfolio is in cash, the price-to-book-value ratio can be moved up, but never over 0.90.
- At the end of a quarter, if receipts from stock sales are insufficient to buy all newly qualifying stocks, purchases are made in order of lowest bid/ask spreads.
- Note that if you are managing your own portfolio, it should consist of at least 10 stocks. If you are developing the portfolio gradually, you can do it stock by stock, but don’t put more than 10% of your funds in each additional stock. More than 20 stocks is not needed until the portfolio exceeds $1 million.
Discussion
FREE REPORT

Craig Campbell from CA posted over 13 years ago:
Priya Balakrishnan from TX posted over 13 years ago:
Raymond Gundersen from CA posted over 13 years ago:
Charles Rotblut from IL posted over 13 years ago:
Craig Butler from OR posted over 13 years ago:
Anjan Ghose from CA posted over 13 years ago:
Billy Greer from MS posted over 13 years ago:
James McGehee from NC posted over 13 years ago:
Blair Picard from MO posted over 13 years ago:
Andy Crane from FL posted over 13 years ago:
Chadwick Gibbons from NY posted over 13 years ago:
James Fitko from LA posted over 13 years ago:
Blair Picard from MO posted over 13 years ago:
James Mcgehee from NC posted over 13 years ago:
Floyd Gaines from CA posted over 13 years ago:
E Birnbaum from NM posted over 13 years ago:
Dave Steffes from MN posted over 13 years ago:
Lihong Quan from NY posted over 13 years ago:
Andy Crane from FL posted over 13 years ago:
Steven Stark from ID posted over 13 years ago:
Jim Peabody from VT posted over 13 years ago:
Alan Bloom from PA posted over 13 years ago:
TWC from Canada posted over 13 years ago:
Charles Rotblut from IL posted over 13 years ago:
Charles Rotblut from IL posted over 13 years ago:
Gchin from NC posted over 13 years ago:
Charles Rotblut from IL posted over 13 years ago:
Richard Orwoll from NC posted over 13 years ago:
Thomas Mason from IL posted over 13 years ago:
Kennan from WA posted over 13 years ago:
Jean Henrich from IL posted over 13 years ago:
Vladimir Lomen from OR posted over 12 years ago:
You need to log in as a registered AAII user before commenting.
Log InCreate an account