


Wayne Thorp leads a class in AAII's new Essential Investing Video Course. Go to https://www.aaii.com/ves for more information and to subscribe.


Technical analysis is the study of historical price and volume data to identify patterns that may indicate future price movement. I consider myself a staunch “fundamentalist” when it comes to buying and selling stocks, meaning I pore over financial statement data and examine trends in various financial ratios and multiples. However, I almost always also look at the stock chart of any stock I am considering. I am going to use all the tools at my disposal, and charting and pattern analysis may help me identify a more advantageous entry or exit point.
Certain chart patterns indicate that the current overall trend is still in place, while others signal that the major underlying trend is coming to an end and about to reverse itself. This installment of Technically Speaking highlights three chart patterns that may signal that the price trend is about to reverse.
Head and Shoulders
The head and shoulders pattern is arguably the best known and probably the most reliable of the reversal patterns. A reversal pattern is one that, when formed, signals that the security is likely to move against the previous trend.
There are two types of head and shoulder patterns—a top and a bottom. Both have a similar construction with four main parts—two shoulders, a head and a neckline. The patterns are confirmed when the neckline is broken following the formation of the second shoulder.
Head and shoulders patterns are sets of peaks and troughs. The neckline is a level of support (top) or resistance (bottom). The head and shoulders pattern illustrates a weakening trend where there is deterioration in the peaks and the troughs.
A head and shoulders top is characterized by three prominent market peaks. The middle peak, or the head, is higher than the two surrounding peaks (the shoulders). The left shoulder—the first peak—forms when the security reaches a new high and retraces to a new low. The head forms when the security reaches a higher high and then again retraces, this time back near the low formed in the left shoulder. The right shoulder forms by a high that is lower than the high formed by the head and is followed by a retracement back to the low of the left shoulder. A trendline (the neckline) is drawn at the level of the two lows that formed the shoulders. The pattern is complete once the price falls below the neckline and signals an important market reversal to the downside.
The head and shoulders bottom pattern, also known as an inverse head and shoulders, is the exact opposite of the head and shoulders pattern just discussed and signals a reversal to the upside. Here, the left shoulder forms when the price falls to a new low and then rebounds to a high. The head forms when the price moves to a low below that of the low of the left shoulder, followed by a rally to the previous high. The right shoulder forms when another sell-off sends prices to a low that is higher than the previous low, at which point there is another rally that sends prices to a level of the previous high. Drawing a trendline through the highs of the two shoulders creates the neckline. The pattern is complete when the price breaks above this neckline.
Volume comes into play with head and shoulders patterns mainly at the breakout point where the price crosses the neckline. In order to have confidence in the pattern confirmation, it is important that the breakout occurs on high volume. However, you may also use volume as a secondary indicator as the pattern is forming to get a feel for the pattern’s strength. Generally speaking, there should be declining volume through the formation of a head and shoulders pattern. There should be heavy volume as the left shoulder hits its new peak for a top or a new low for a bottom. As the head forms, there should be lighter volume compared to the volume during the formation of the left shoulder. The peak of a right shoulder for a top, or the trough for a bottom pattern, should be made with even lighter volume than either the head or the left shoulder. When the price breaks through the neckline, volume should increase significantly: The chances of the price moving back to the neckline are greater if the neckline break isn’t accompanied by higher volume.
How the neckline forms with a head and shoulders pattern is also an important consideration. The neckline serves as support or resistance as the pattern forms and is the entry point when the pattern confirms itself. Don’t expect the neckline to be perfectly horizontal; in most cases it will be slanted up or down. Generally speaking, a “technically strong” head and shoulders top pattern should have a flat or slightly upward-slanting neckline. For the head and shoulders bottom, the neckline should be flat or slightly downward-slanting.
In following certain chart patterns, you are sometimes able to calculate price objectives or targets by measuring the shapes of the various price patterns. Since we have a good idea of the direction prices are headed in once a chart pattern is confirmed, knowing how far prices may move following the confirmation allows traders to place protective stops and evaluate the overall worth of a potential trade.
For the head and shoulders pattern, we measure the distance in price between the peak or trough of the head and the neckline drawn between the two shoulders. The price objective for a head and shoulder top is calculated by subtracting this price distance from the price at which the pattern breaks the neckline to the downside. Alternatively, the price objective for an inverse head and shoulders is determined by adding the price distance between the trough of the head and the peak of the shoulder to the price at which the neckline is broken to the upside. Of course, realize there are no absolutes when it comes to technical analysis, so you should view these price objectives as guidelines.
Figure 1 shows an example of a head and shoulders pattern formed by Goldman Sachs Group Inc. (GS) during March and April of 2012. GS shares bottomed out in mid-December 2011, closing at $87.70 on December 19, and started a prolonged upward move that culminated in an intermediate high closing price of $121.13 on March 1, 2012. The price retreated to close at $113.67 on March 6, marking the end of the left shoulder.
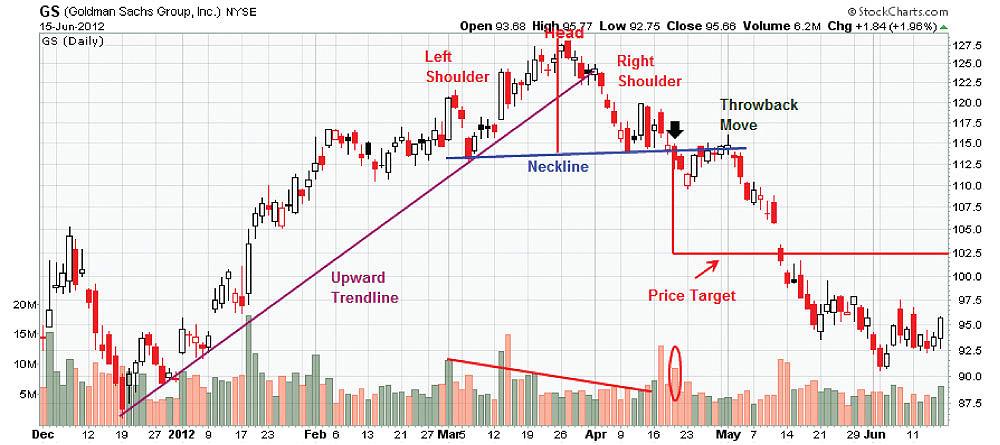
At this point, the price resumed its uptrend to begin forming the head. The top of the head was reached on March 26, when the price closed at $126.44. During this time, with a couple of exceptions, volume was generally lower than it had been during the formation of the left shoulder.
The top of the right shoulder was formed when the price closed at $114.45 on April 10. At this point, the price again reversed course, breaking through the neckline around April 19. On this date, there was a spike in volume, albeit not as high as the trading volume two days prior.
In this example, we also see a “throwback” move by GS shares. After reaching a reaction low of $111.75 on April 23, shares retested the neckline by closing at $114.15 on May 1. After this, however, the price confirmed the reversal by entering into a downtrend that lasted into June.
Measuring the distance between the neckline and the top of the head in this example, we arrive at a value of roughly $12 ($126.44 – $114.45). When the neckline was broken at $114.45, the initial price target for this head and shoulders top pattern was roughly $102.45. On May 11, Goldman shares gapped down to close at $102.13. From there, the price continued to fall until closing at $91 on June 4, 2012.
Double and Triple Bottoms/Tops
Another set of reversal patterns are double or triple tops and bottoms. Double tops and bottoms (also called M’s and W’s, respectively, because of their shape) show two prominent peaks or troughs. The triple top or bottom is a variation of the head and shoulders. The only difference is that the three peaks or troughs in this pattern occur at about the same level.
A double top pattern occurs at the peaks of an upward trend and serves as a signal that the preceding upward trend is weakening. The first stage of the pattern is the creation of a new high, after which a sell-off sends prices to a level of support. The next stage of the pattern sees prices move back toward the level of the previous high, at which point it runs into resistance similar to the previous run-up and again sells off to the prior support level. However, this time support does not hold and the pattern is completed only after the price falls below the support level. This signals that a new downtrend has begun. Keep in mind that, while the peaks of the double top do not have to be at exactly the same level, they need to be reasonably close to one another. Furthermore, you should look for an increase in volume when the security falls below the support level.
In contrast, the double bottom pattern forms at the new lows of a downtrend and indicates that a new upward trend is starting. The pattern begins when prices find support, preventing the downward move from continuing. At this point, prices rally to a new high before running into resistance that, temporarily, ends the price rebound. After hitting near-term resistance, there is a sell-off back to the previous low. Once again, however, support holds and the second bottom is formed. Prices bounce off support and head back upward. The double bottom pattern is confirmed when the price moves above previous resistance and starts a new uptrend.
Triple tops or bottoms and the head and shoulders reversal pattern are interpreted similarly and mean essentially the same thing. They also form in a similar fashion to double tops and double bottoms, except the support or resistance levels are tested three times before the reversal takes place instead of two times.
The triple top pattern forms when a security is trending upward and tests a similar resistance level three times without breaking through. Following each failed attempt at breaking through resistance, the price falls to a similar area of support. After the third retreat to the support level, the triple top pattern is confirmed when the security falls through the support and a new downward trend begins.
The triple bottom is a bullish reversal pattern that signals the end of a downward trend. In this case, however, the security attempts to fall through a level of support three times, but each time it rebounds to a level of resistance. After the third failed attempt at making a lower low, the pattern is confirmed when the price moves back above the resistance level and begins trading in a new upward trend.
Just as with the double bottom and top patterns, volume plays a role. In the triple top formation, each test of resistance at the peaks should see declining volume. However, when the price breaks the support level to confirm the pattern, we should see an increase in volume.
In the triple bottom pattern, volume should decline at each support level trough, which is an indication of declining selling pressure. Volume should be high when the price breaks above the resistance level, thereby completing the pattern.
Just as with the head and shoulders patterns, we are able to estimate the size of the resulting move once the signal has been formed for the double and triple bottoms and tops. No matter whether you are looking at a double or triple bottom/top pattern, the initial price objective can be measured by calculating the price distance between the support and resistance levels of the patterns. This price range is then added to the price where the resistance breakthrough takes place for the “bottom” pattern to arrive at the initial price objective, or it is deducted from the price where the break below support occurs for a “top” pattern.
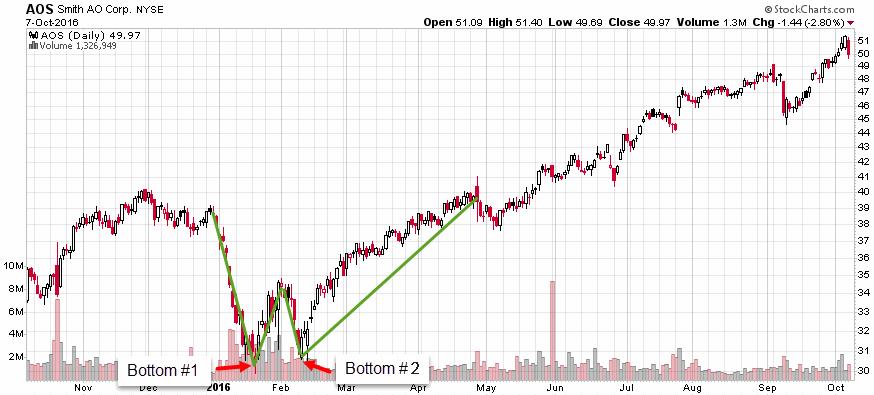
Figure 2 is an example of a double bottom pattern for AO Smith Corp. (AOS) that formed at the beginning of 2016. After falling over 20% from $38.82 to $30.75, AOS shares rebounded to $34.55 within several trading days. From there, the price again retreated, to just above $31. This time, however, when the price reached the point of previous resistance, it kept climbing. The price range between the resistance point and the two support levels of the double bottom is just under $4 ($34.55 – $30.75). Therefore, the initial price target once the price broke through the resistance level was around $38.35 ($34.555 + $3.80). However, the price eventually closed near $40 in mid-April.
Rounding Bottom or Saucer
The final reversal pattern discussed here is the rounding bottom or saucer pattern. For those of you familiar with the cup-with-handle pattern, the rounding pattern is similar, except that it does not have a handle and it is a reversal pattern instead of being a continuation pattern as with the cup-with-handle formation.
Unlike the other patterns covered here, which are effective on intraday, daily, or weekly time frames, the rounding bottom is best suited for weekly charts. This pattern represents a long consolidation period as sentiment shifts from bearish to bullish.
Since the rounding bottom pattern is a reversal pattern, we must first have a prior trend to reverse. Therefore, the low of the rounding bottom pattern ideally will mark a new low or a reaction low. However, there may be times when the low of the rounding bottom takes places months earlier and the security trades flat before finally forming the pattern. Since a rounding bottom pattern may take so long to develop, its low may not be the lowest low of the last few months.
The first portion of the rounding bottom is the price decline that ultimately leads to the low of the pattern. Ideally, we would like to see a rounded bottom for the low of the pattern. It can resemble a “V” bottom, but it still should not be too sharp and should develop over a few weeks, if not longer.
After forming the low, the subsequent rebound forms the right half of the pattern and should take roughly the same amount of time it took for the decline to form the left side of the pattern. If the advance is too sharp and occurs too rapidly, the validity of the rounding bottom pattern may be in question.
The bullish confirmation of the rounding bottom pattern occurs when the pattern breaks above the reaction high that marked the beginning of the decline that started the formation of the pattern.
Lastly, with an ideal rounding bottom pattern, the volume levels will track the shape of the pattern—high at the beginning or the decline, low at the end of the decline and formation of the bottom and rising during the advance. Preferably, there is also an increase in trading volume at the breakout to confirm the pattern.
Figure 3 is an example of a rounding bottom that formed over a seven-month consolidation period for Microsoft Corp. (MSFT). The break of support around $25.25 in early November 2012 confirmed that the downtrend was in progress. The stock declined from $28.71 to a low of $23.76 on December 4, 2012. The stock again flirted with that low by closing at $23.85 on January 10, 2013. In April there were large price advances with the highest volume in five months. The stock broke the September 2012 resistance on the highest volume in over a year.
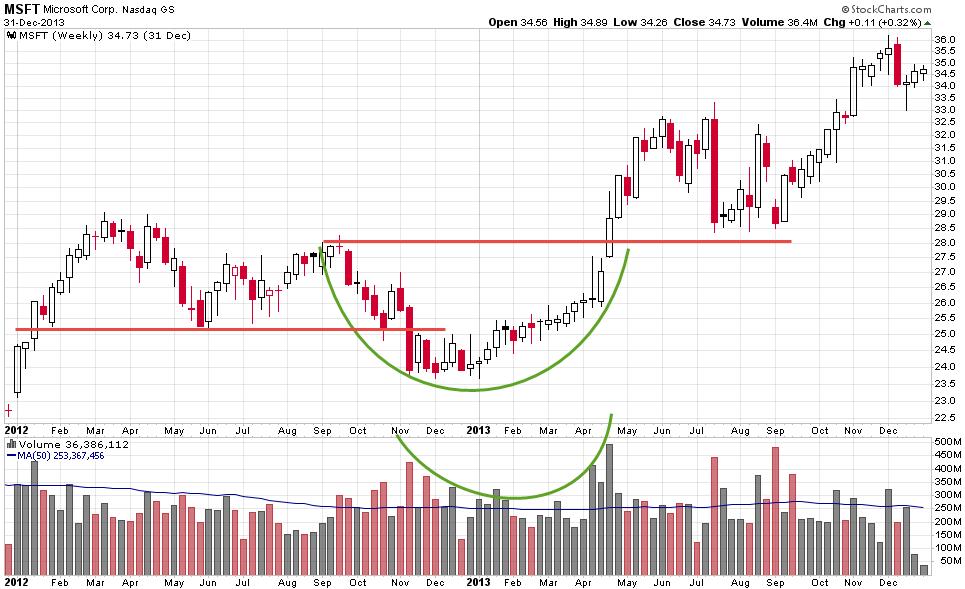
After breaking resistance, there was a bit of testing of support but the price never fell below it. The stock eventually rose to a high of $34.76 on December 26, 2013.
Conclusion
Reversal patterns are useful to traders and longer-term investors alike since they signal when the underlying trend in a security is coming to an end. They allow you to place protective stops or possibly delay trades until a more favorable trend develops. Depending on the pattern, they may also allow you to identify potential price targets once the pattern has been confirmed. However, it is important to remember that no signal or pattern is infallible.
Discussion
FREE REPORT

Mike Stacy from FL posted over 10 years ago:
Henry Mount from TX posted over 9 years ago:
Wayne Thorp from IL posted over 9 years ago:
Evelyn S Postoluck from CA posted over 9 years ago:
You need to log in as a registered AAII user before commenting.
Log InCreate an account