




TipRanks journalist Harriet Lefton describes the financial data tracker’s new mobile app.
TipRanks’ new app, currently only for the iOS platform, consists of three separate features that users can gain access to a la carte: The Portfolio Tracker, My Performance and Investment Ideas. Users can download the app for free and both The Portfolio Tracker and My Performance features are included in the free download. Access to the full range of Investment Ideas features is only available through purchase; however, its Trending Stocks tool is free. The TipRanks application offers a database of 4,200 stocks.
When you first open the app, you are not initially prompted to create an account, but you should in order to save your portfolios. Some elements of the application that are not yet available include: syncing your brokerage account and synchronizing portfolios.
Creating an account requires only an email and a password as well as email verification.
The Portfolio Tracker
The Portfolio Tracker allows you to pool all of your stocks so you can monitor and track all of your crucial portfolio statistics in one simple place. Users have access to real-time quotes, portfolio analysis and monitoring tools, as well as the overall bullish and bearish sentiments on each stock from analysts and bloggers. For example, based on 169 financial blogger opinions we can see that the blogger sentiment on Apple Inc. (AAPL) is 82% bullish as of this writing, while analysts have a relatively optimistic Apple outlook.
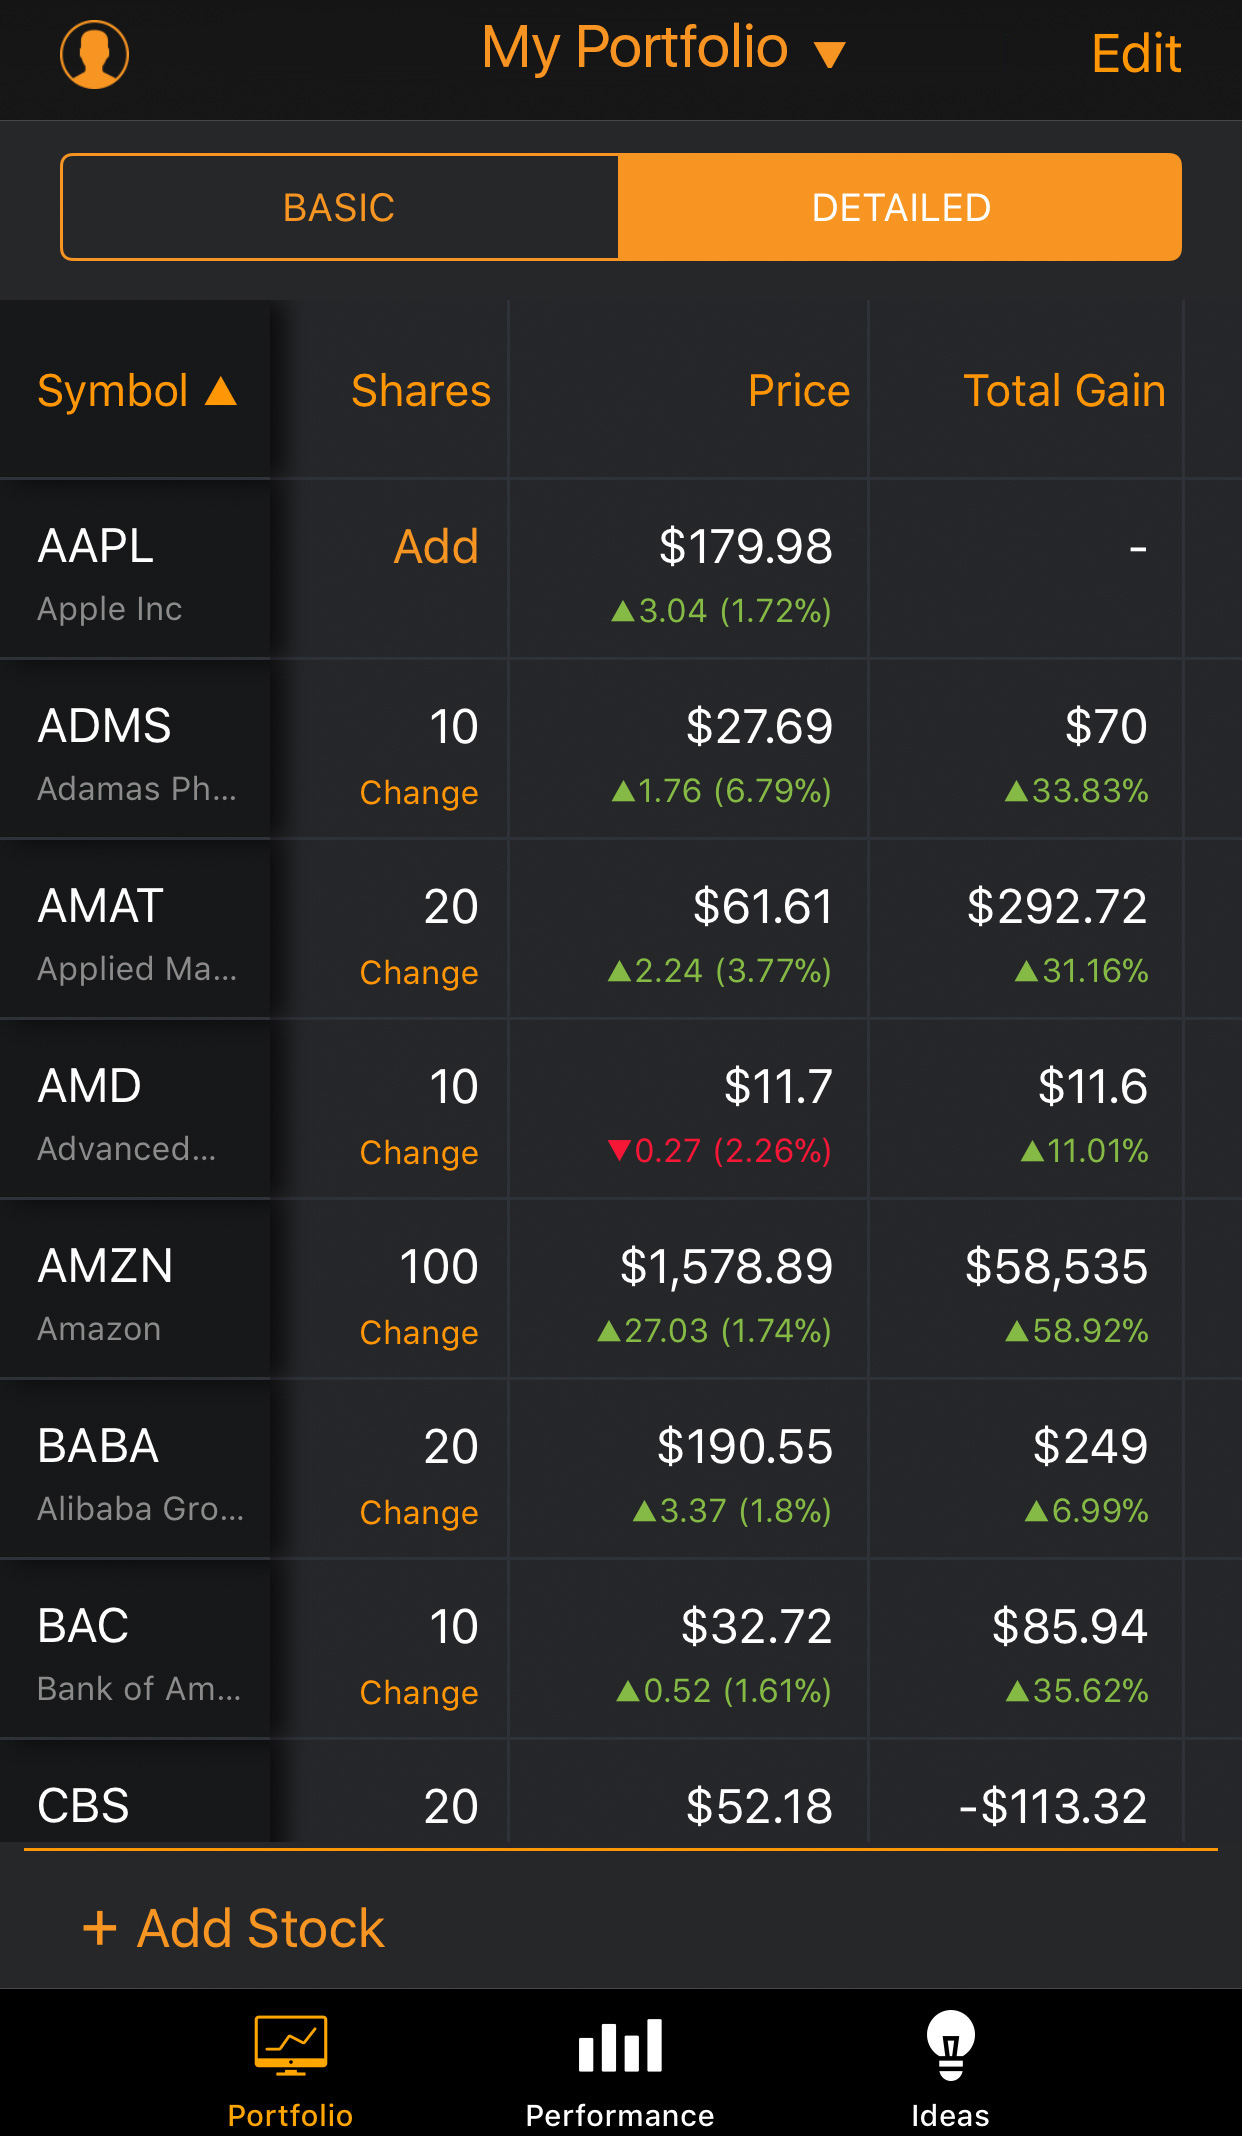
Users can create a TipRanks portfolio by adding stocks, and if they choose, adding the number of shares and purchase price for each holding. This is the data on which investing performance will be measured. Additionally, users can add stocks to a watchlist, which forgoes adding the number of shares purchased and limits the data given to the user.
Clicking on an individual stock allows users to view information such as statistics, price graph, analyst consensus, financial blogger consensus and relevant news.
The detailed view includes information such as current price with changes in price, total daily gain, percentage of the portfolio that the stock represents, analyst consensus, analyst consensus price target, blogger sentiment, daily low to high, 52-week range, market capitalization, volume and average volume.
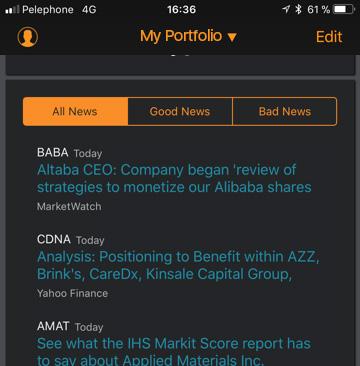
The Portfolio Tracker also provides a tool for individual investors to monitor news affecting each portfolio stock, enabling the combination of this with other types of data sources to bring an edge to your specific strategy. The news is divided into bullish and bearish categories, and all the articles are hyperlinked to the original news source. The result: You can easily pull up all the most relevant news in one simple swipe.
My Performance
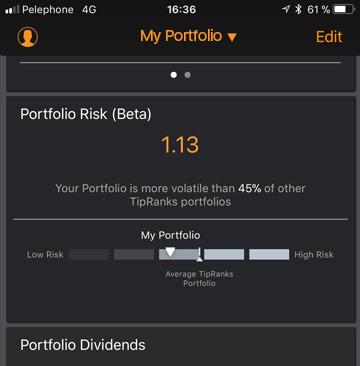
Track your portfolio risk (beta)—Is your portfolio more or less volatile than other TipRanks portfolios? Your beta risk profile here could indicate whether you should consider further diversifying your portfolio holdings. Portfolio beta is calculated as a weighted-average beta of the stocks in the portfolio (if you don’t enter the number of shares it’s just the average, not the weighted average).
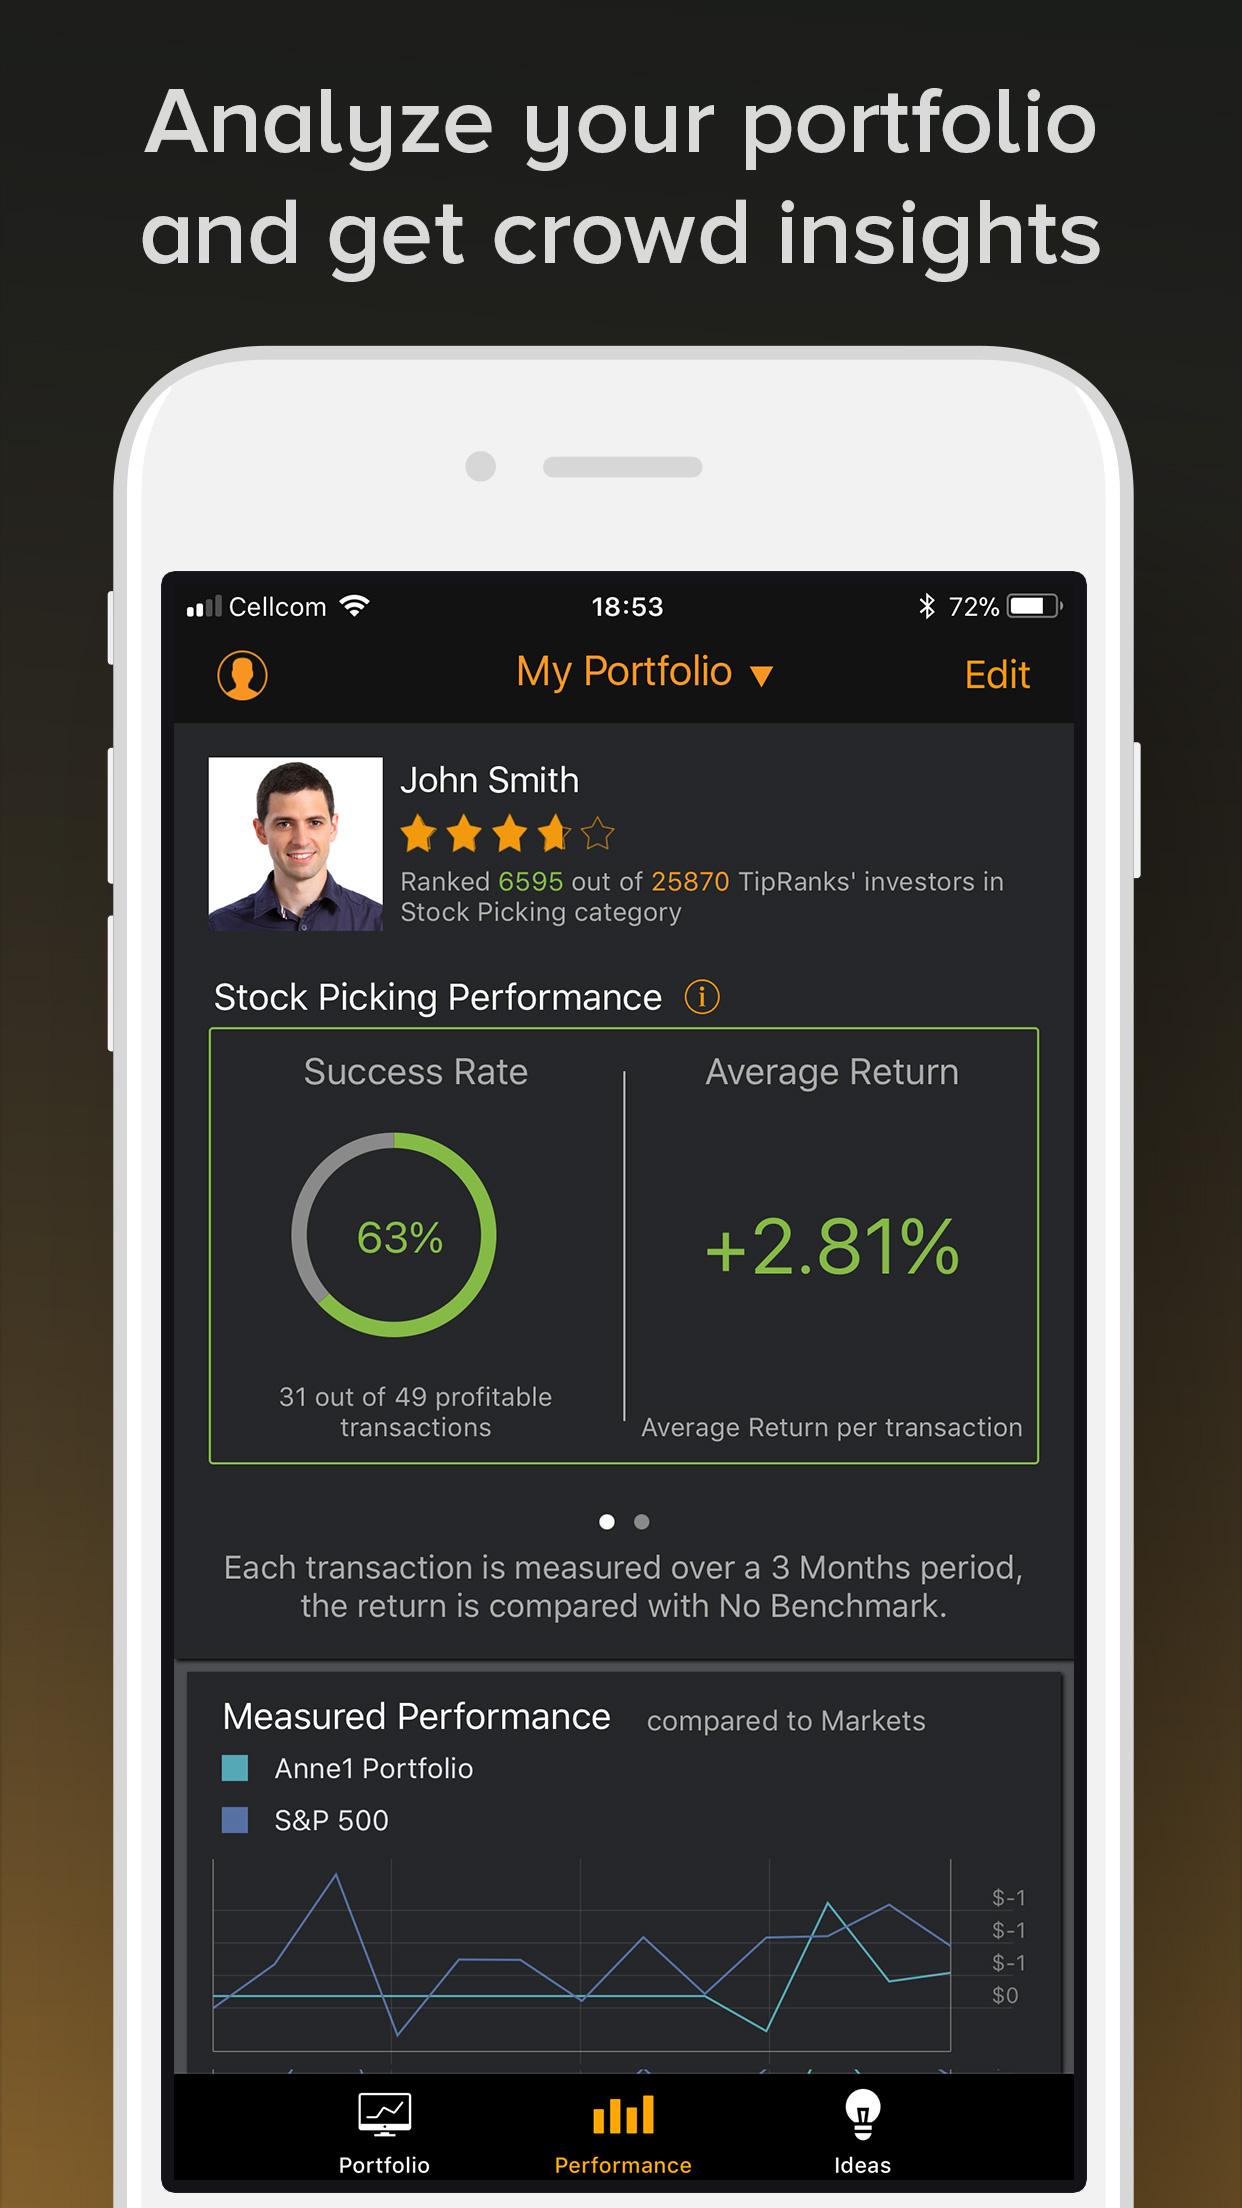
The My Performance tool lets users compare their investing performance to hundreds of thousands of other investors. Users can draw fresh insights from the data regarding portfolio performance, allocation and volatility. By comparing these data points to the market, or even to the best-performing TipRanks investors, users can decide if they’d like to adjust their investment strategy.
Users will find the following:
Star rating and rank—Based on data from over 200,000 portfolios on the TipRanks Smart Portfolio platform, users can see how you rank. The rating and rank are based on the success rate and average return per transaction—i.e., stock added. Each transaction is measured over a three-month period.
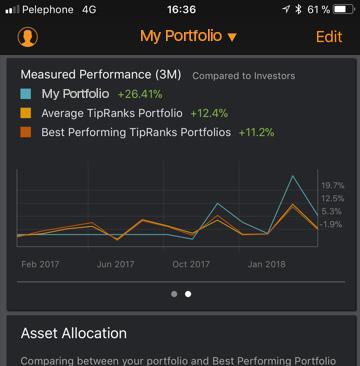
Compare and contrast your portfolio—Users can compare their portfolio’s three-month measured performance to three different benchmarks: the S&P 500 index; the average TipRanks portfolio; and the best-performing TipRanks portfolio. This data is extracted from the top 20% of all the portfolios managed on the TipRanks Smart Portfolio platform. Crucially, in order to ensure these are active portfolios, data is only taken from portfolios that have been modified in the last three months. Users can also see how their sector asset allocation shapes up compared to an average and best-performing portfolio.
Other features on this page include “portfolio dividends” (calculating your total yield and dividend amount) and “best trade” (calculating the gain from your most profitable trade so far).
Investment Ideas
Which hot stocks is the market getting excited about right now? The Investment Ideas page provides exclusive investment ideas based on TipRanks’ unique market insights into financial expert activity.
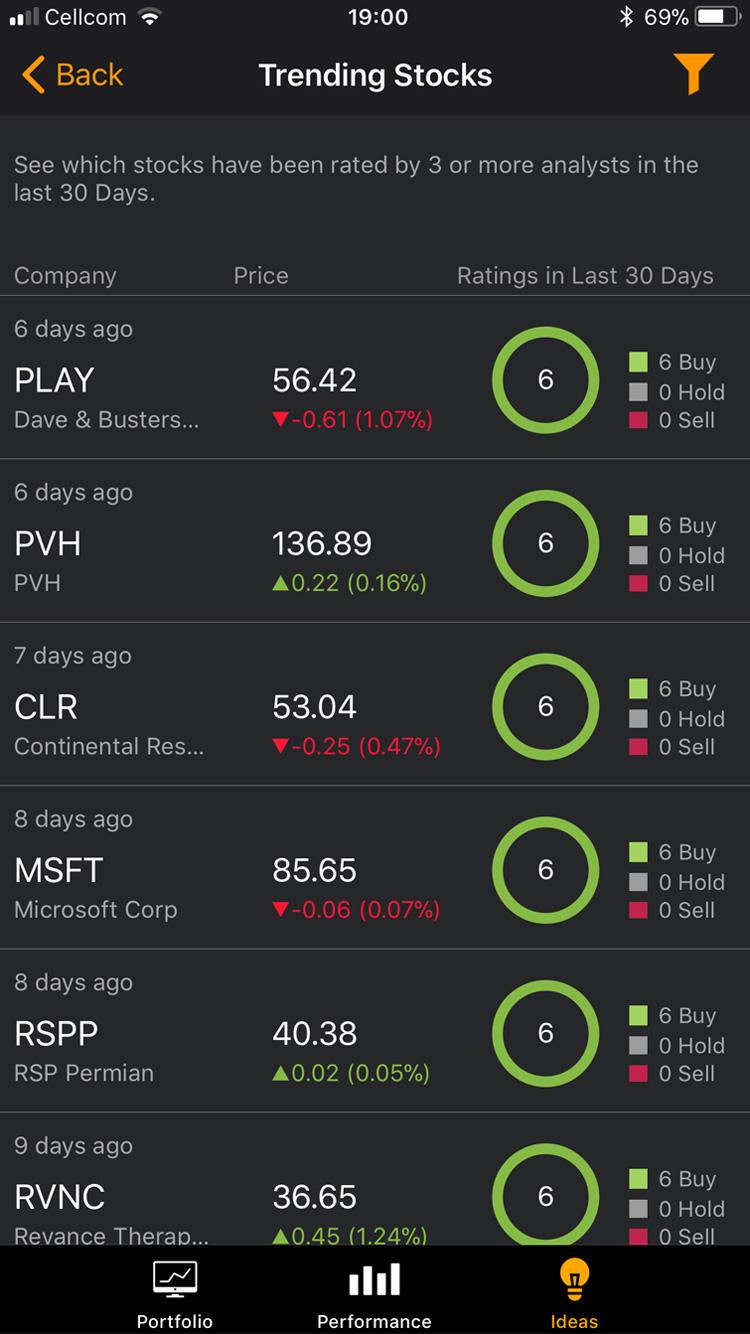
The Trending Stocks tool reveals stocks that have been rated by three or more analysts in the last 30 days. For example, at the time of writing, the Trending Stocks tool shows that Amazon.com (AMZN) has a very bullish outlook from analysts, with nine buy ratings versus just one hold rating in the last 30 days.
If you tap a stock’s ticker, the app displays further insights on that stock, namely key stats, price charts, average analyst price target, blogger consensus and the latest news concerning that stock.
Using Amazon.com as an example, we can see that the stock has a bullish blogger consensus compared to the sector average, and an average analyst price target that suggests over 9% upside potential from the current share price. Potential upside is calculated as the percentage difference between the stock’s average analyst price target (based on ratings over the last three months) and the current share price. These key stats can help investors make crucial investing decisions.
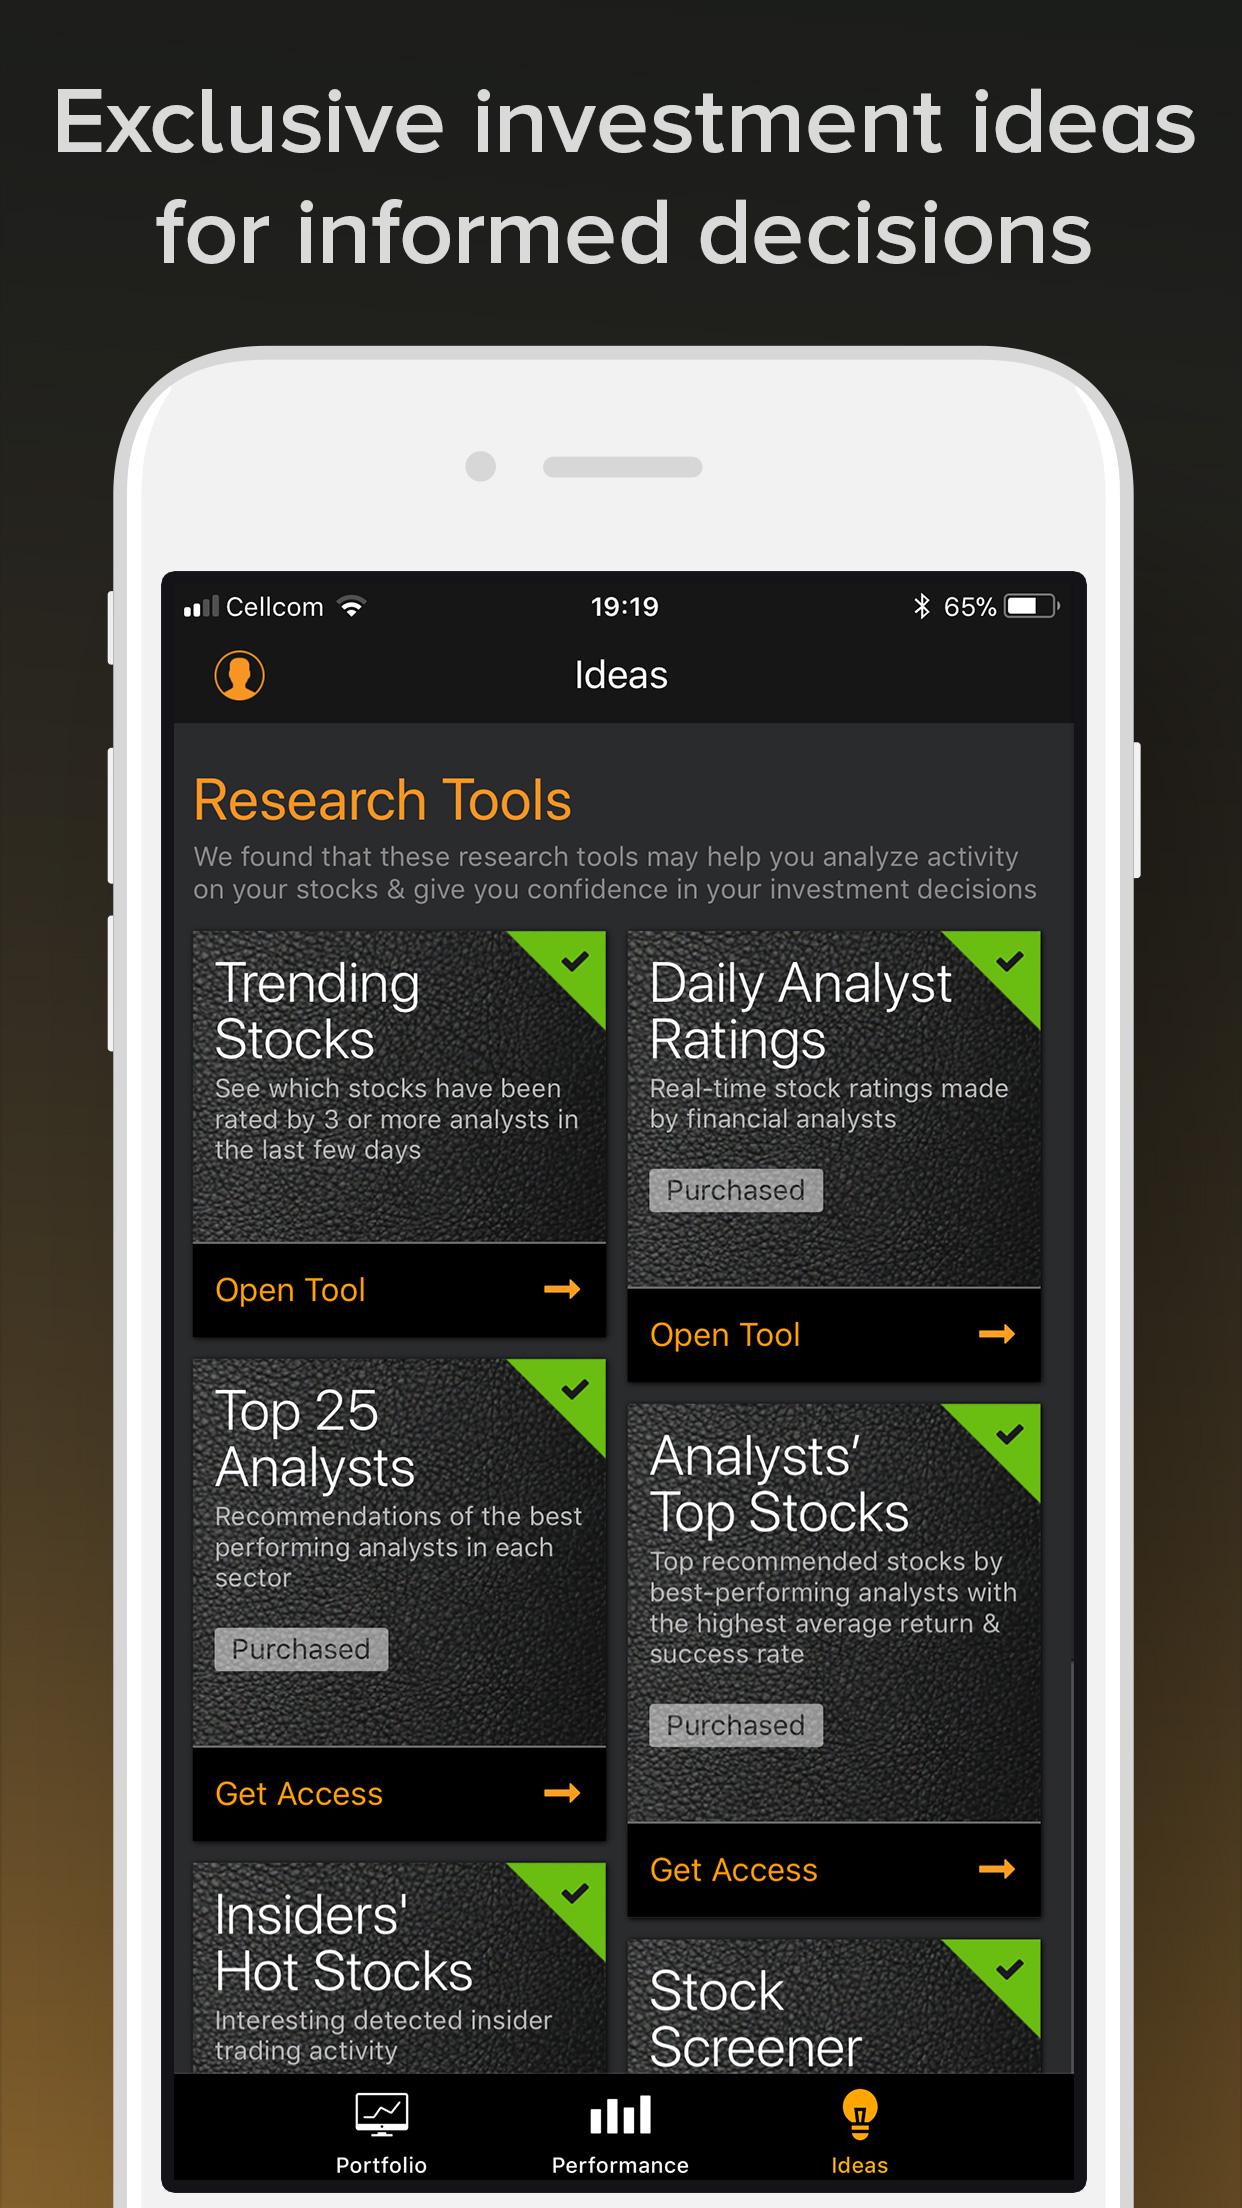
Other premium research tools available in Investment Ideas include: Daily Analyst Ratings; Top 25 Analysts; Analysts’ Top Stocks; Stock Screener; and Insiders’ Hot Stocks. Each of these tools cost $4.99 per month except for the Insiders’ Hot Stocks tool, which costs $7.99 per month. The Insiders’ Hot Stocks tool provides valuable insights into insider trades, enabling investors to track the what a top stock’s corporate insiders—i.e., the company owners and executives—are buying.
Conclusion
The TipRanks Smart Portfolio platform allows you to keep track of and research your investments. The app contains several free features that contribute to an individual investor’s overall knowledge base and help you to manage your assets.
Discussion
FREE REPORT

No comments have been added yet. Add your thoughts to the discussion!
You need to log in as a registered AAII user before commenting.
Log InCreate an account