


The CEO of TipRanks introduces a new portfolio tool that allows investors to see how the pros rate their holdings and how their performance compares to the average of the site’s users.
Web-based TipRanks is a comprehensive, data-driven investment tool that measures the accuracy of published financial advice. The company tracks and ranks the performance of more than 4,000 financial analysts, 5,000 financial bloggers, and 35,000 corporate insiders.
TipRanks recently released a tool called Smart Portfolio that provides a new way for individual investors to track the growth of their investments, analyze real-time news investments and compare to their peers.
Smart Portfolio integrates an existing online brokerage portfolio with TipRanks’ tools, allowing an investor to manage returns in real time using an automated investment adviser while maintaining individual control.
Computerized Investing subscribers get a 20% discount on TipRanks. You must be logged in to see the discount codes on the CI Member Discount page.
Single Dashboard
Individual investors get started by uploading their holdings from a wide range of brokerages, including E*Trade, Chase and Fidelity. With basic TipRanks membership, which is free, or with the premium version ($29.95 per month), you can import one portfolio. The ultimate version ($49.95 per month) allows as many as five different portfolios to be imported. Holdings can include U.S. stocks, mutual funds and exchange-traded funds (ETFs). Once imported, the holdings are analyzed and Smart Portfolio’s Overview page presents a dashboard screen that displays a wealth of information on the portfolio. Included on the overview page are daily gainers and losers within the portfolio; a market overview (a chart of the S&P 500 index, NASDAQ, gold and the Dow Jones industrial average); portfolio return compared to its sector; the S&P or its stand-alone performance; along with bullish news, bearish news and upcoming events.
Investors can immediately see what professional registered analysts say about their holdings in real time.
Deeper Insights
The My Holdings tab provides a display of as many as 30 parameters for each holding in the portfolio.
Using data compiled by TipRanks for more than seven years, each holding is displayed in a table with a range of information, including analyst consensus ratings, current price target, number of shares held, purchase price, gain since the stock was added to the portfolio, as well as sentiment measures.
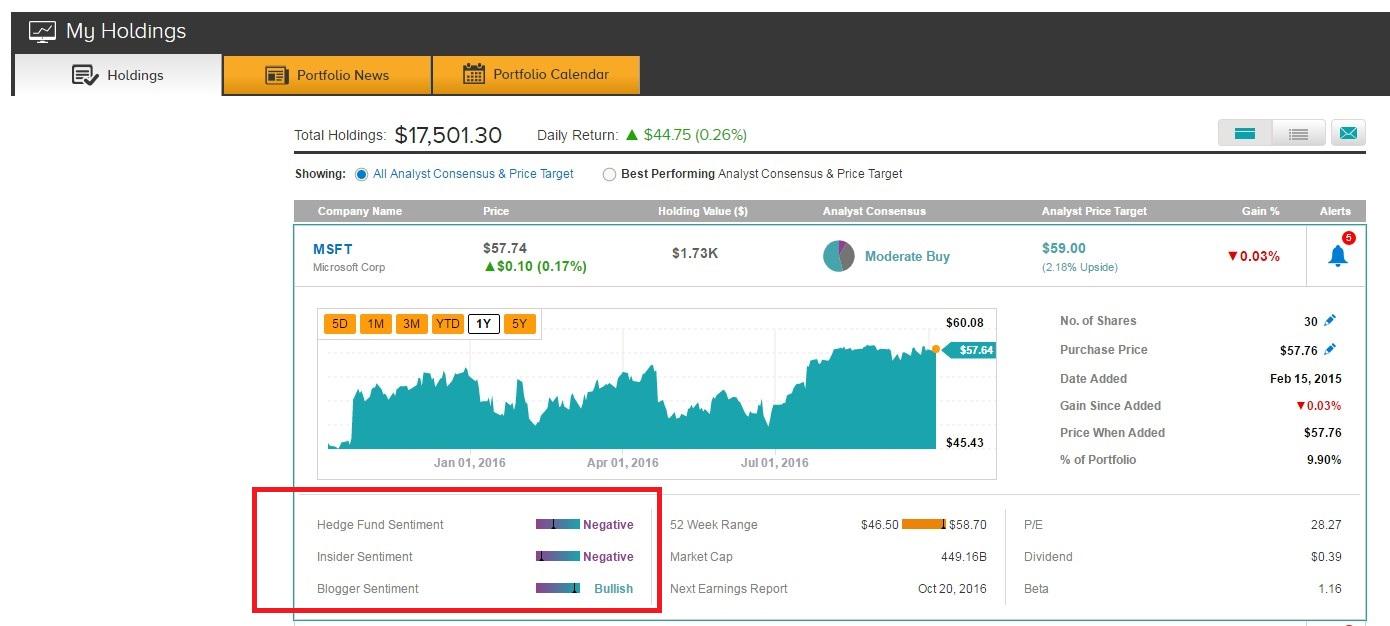
These sentiment barometers show in simple visuals current levels of sentiment—positive, negative, bullish—of company insiders, hedge funds and bloggers as analyzed by TipRanks’ Natural Language Processing algorithm, the heart of the platform. By processing what is written in analyst reports, SEC filings and other published data, the impartial algorithm sifts through massive volumes of information to produce TipRanks various metrics.
Users can choose the depth of the data displayed.
How Am I Doing?
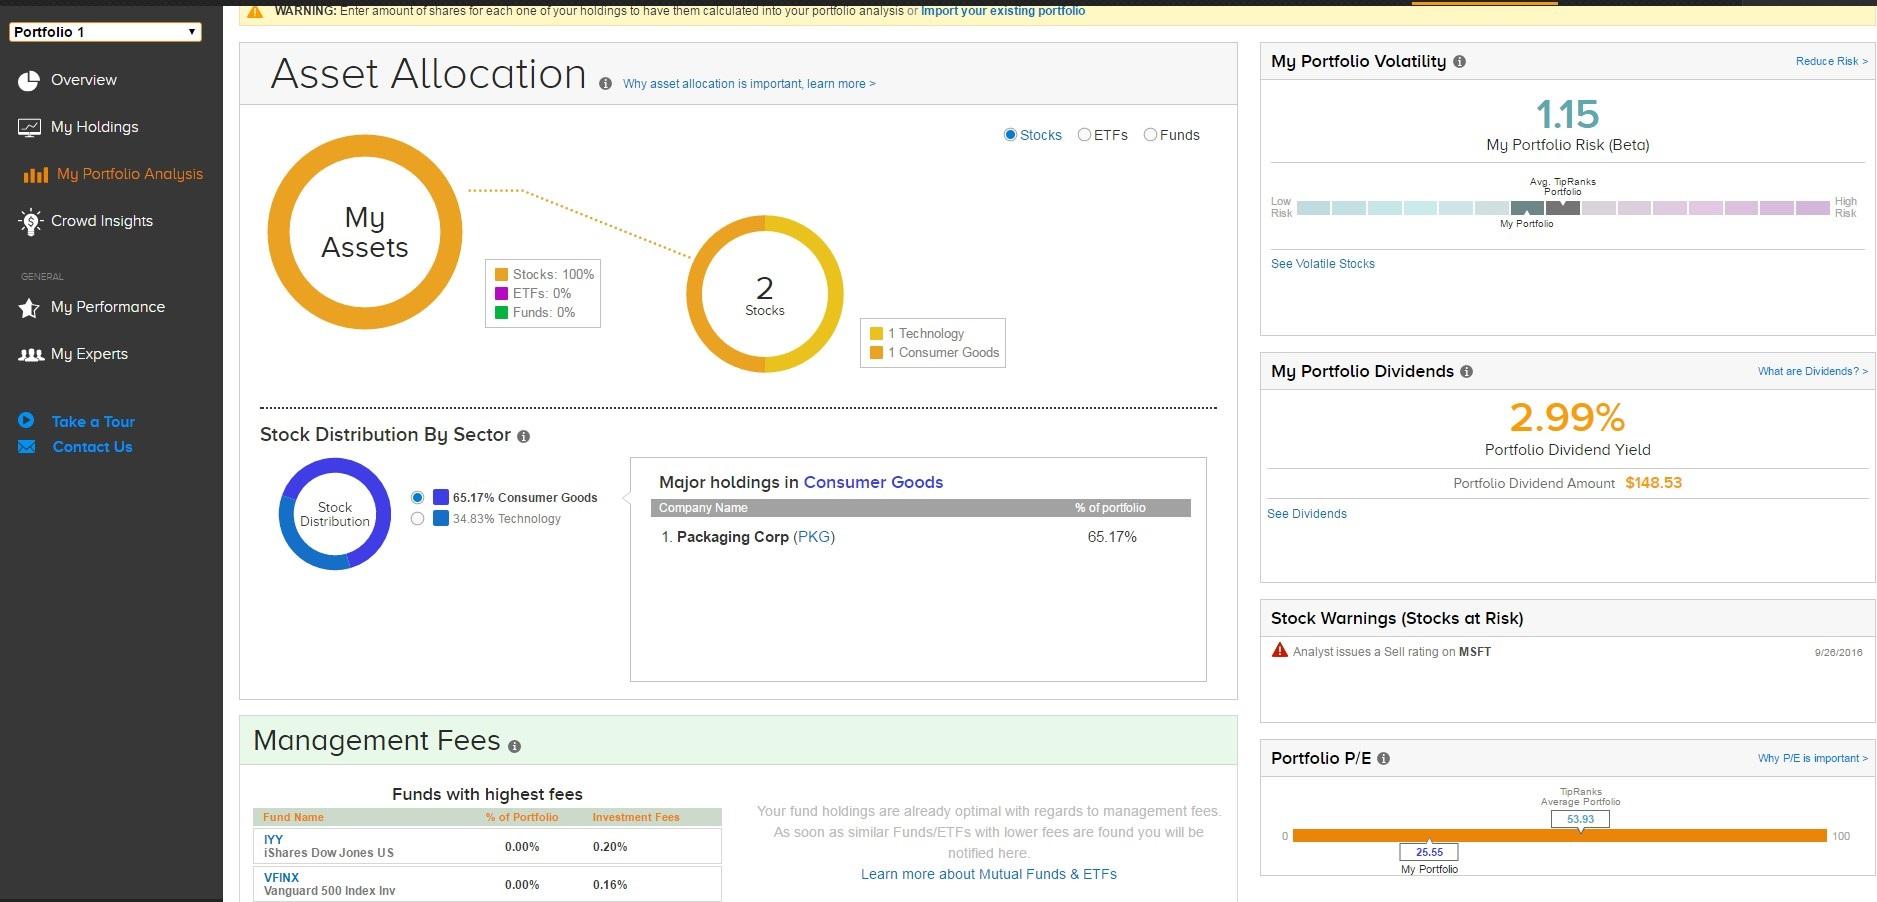
My Portfolio Analysis page allows users to analyze their portfolio based on asset allocation, sector exposure, volatility, dividends, management fees and more. This information is displayed visually, which allows users to better digest the information.
The average mutual fund expense ratio in 2014 was 1.25% according to Morningstar, which may not seem like much, but fees can significantly reduce returns over time. According to U.S. News, those fees alone will trim a retiree’s nest egg from about $945,000 to $757,000, a difference of nearly $190,000 (assuming a $10,000 investment compounded at 7% annually for 30 years).
TipRanks’ engine suggests comparable funds that may help you maximize your expected return by reducing overall fees. Users can see how much each of their fund’s holdings are costing them each year and how much might be saved in fees by switching to another fund. These suggestions are only made if there is a correlation of more than 99% between the fund already held and the alternative lower-fee fund. A correlation of 1.0, or 100%, means that two securities move in lockstep. A correlation of -1.0, or -100%, means two securities move in exactly the opposite direction.
On average, based on our backtests and reported customer experience, Smart Portfolio users can possibly save 1% a year on these fees, which can be significant depending on the size of your fund holdings.
The My Portfolio Analysis page provides an easy-to-analyze infographic displaying the current beta of your holdings compared to an average of other TipRanks portfolios. Beta is a measure of the volatility, or systematic risk, of a security or a portfolio in comparison to the market as a whole. A beta of 1.0 means the security has the same risk level (as measured by volatility) as the market.
Crowd Wisdom
At the heart of TipRanks is the wisdom of the crowd. The engine analyzes the forecasts, insights, news and opinions from tens of thousands of sources (including bloggers on Seeking Alpha, Motley Fool and Yahoo Finance). The Crowd Insights page is a visual display of data that shows how an individual investor compares with all other TipRanks users across a broad range of parameters, including asset class allocation, stock sector allocations and dividends.
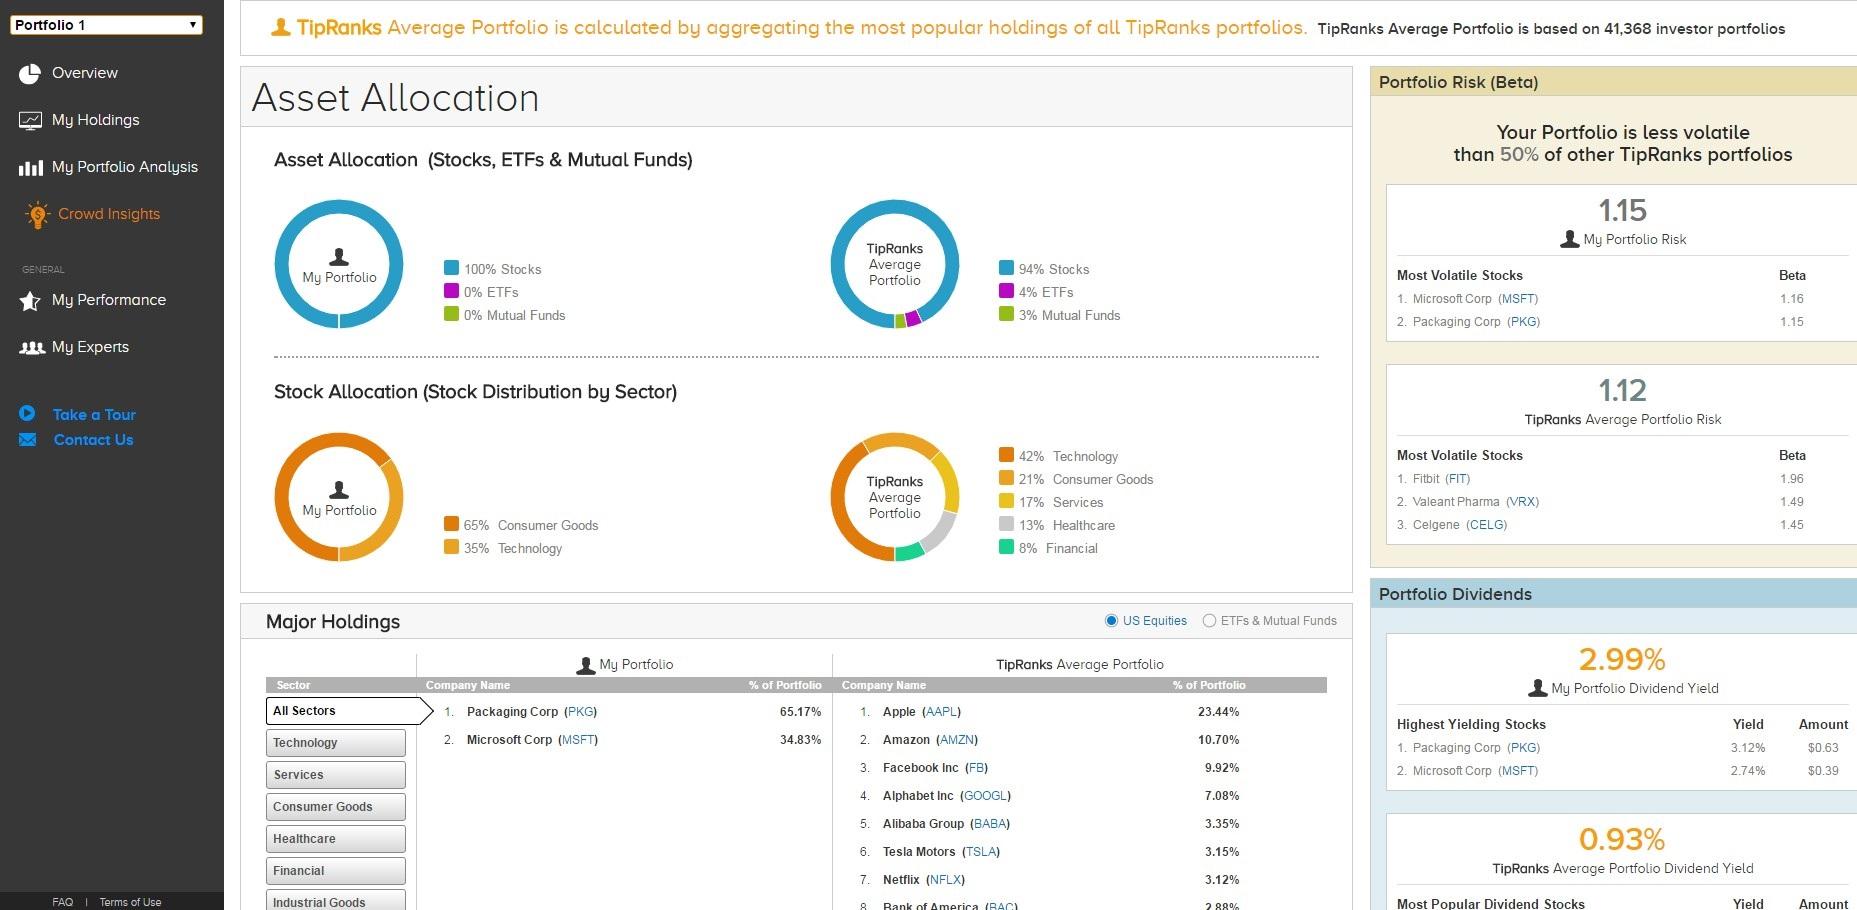
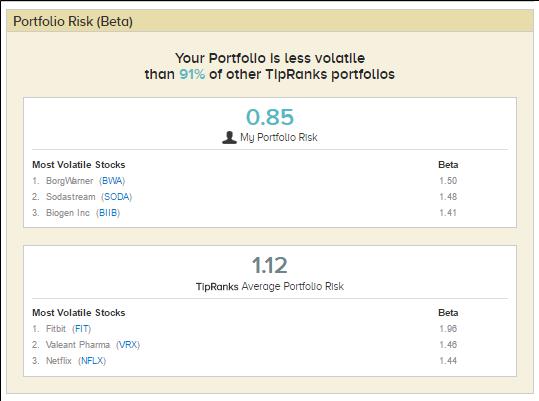
The Portfolio Risk section of the Crowd Insights page shows how your holdings compare with other TipRanks users and provides a specific level of average portfolio volatility risk. It also shows a user their top three most volatile holdings as well as other TipRanks’ users most volatile holdings.
The Major Holdings table shows how much a particular stock or fund represents in the user’s portfolio as compared to other users, including within the stocks’ particular sector.
Complete Picture
Smart Portfolio is a new way for investors to track their performance. Investors can compare their asset allocation, risk, dividends and more to other individual investors as well as track their holdings (with data from Xignite). The Smart Portfolio tool integrates with TipRanks’ accountability algorithm that holds bloggers and analysts accountable for the recommendations they make.
The basic version of TipRanks membership is free, and includes the ability to import one portfolio for use with the Smart Portfolio tool. The premium version is $29.95/month ($359.40 per year) and also allows importing one portfolio. Extra Smart Portfolio capabilities available with the premium version include:
-
Open more than one portfolio and get each of the portfolios analyzed, or aggregate them all into one portfolio and have all holdings analyzed.
-
See what only the top-performing analysts say about your stocks (free users see what any analyst says). A top-performing analyst is rated five stars, meaning he/she consistently generated positive return over the last six years.
- User can get their mutual funds/ETF component analyzed and optimized: Smart Portfolio suggests other funds with lower management fees, but very high correlation on the performance.
To import up to five portfolios from your brokerage, the ultimate version is $49.95 ($599.40 per year). For a comparison of the features of each version, see the TipRanks Plan Overview page.
For more on the TipRanks website, see CI’s Best of the Web. TipRanks was rated Editor’s Choice in the December 2015 update of websites that publish ratings and recommendations on stocks.
Discussion
FREE REPORT

Frank Jimenez from CA posted over 9 years ago:
Jay Kaplan from GA posted over 9 years ago:
Robert Krishfield from CA posted over 9 years ago:
Jackie McClellan from IL posted over 9 years ago:
Uri Gruenbaum from NY posted over 9 years ago:
You need to log in as a registered AAII user before commenting.
Log InCreate an account