




Modern portfolio theory (MPT) has long been—and remains—the de facto standard for portfolio management since its inception in 1952. However, with the advent of numerous signal processing theory advancements in the last six decades, it’s time to examine how these developments can improve investment performance just as they have helped radio, cell phones, and digital TV achieve their superb performance today. This article reviews these new methods, develops a “relative risk” measure that is inherently industry-accepted, and shows how asset class rotation can radically reduce risk while improving returns for a set of ordinary asset class funds.
Motivation for Asset Class Rotation
While MPT was an important step forward for mitigating risk associated with market volatility, numerous subsequent developments can provide significant opportunity to extend MPT and further improve portfolio performance. The most important of these was the identification, confirmation and demonstration of momentum in market data:
- Momentum in market data was formally identified by Narasimhan Jegadeesh and Sherida Titman in their 1993 seminal academic paper “Returns to Buying Winners and Selling Losers: Implications for Stock Market Efficiency.”
- Momentum in market data was formally confirmed by Nobel Laureate Eugene Fama and Kenneth French in their 2008 academic paper “Dissecting Anomalies.”
- Momentum in market data was successfully demonstrated by multiple portfolio managers documented by The Economist in their 2011 article “Momentum in financial markets: Why Newton was wrong.”
Momentum is loosely defined as the tendency of an object in motion to continue in motion. Although many momentum traders include daily trading volume as part of momentum’s definition, trend followers are agnostic about volume and treat “trend” and “momentum” as virtual synonyms, as this article does.
MPT was developed long before computers were available for analyzing daily market data. Without daily market data analysis, there could be no daily trend analysis; this limited MPT to statistical analysis methods and basic buy-and-hold diversification models. The confirmation of momentum in market data by Nobel Laureate Eugene Fama, renowned developer of the efficient market hypothesis (EMH), is a powerful testimonial coming from an outspoken “diversify and rebalance” stalwart. Today, we are also fortunate to have the necessary computing resources to perform daily trend analysis on every individual component of the market. Better information leads to better decisions.
However, saying that “trend information exists in noisy market data” isn’t much different from saying that “music exists in noisy radio waves.” In each case, the most important task is to separate the desired signal from the noise. Thanks to radio, digital TV, Ethernet and Wi-Fi we’re now able to apply the cross-disciplinary mathematics from the field of electronic signal processing to noisy market data to improve the extraction of its embedded trend signals. The three most important of these follow:
- The Shannon-Hartley theorem specifies the maximum rate at which information can be transmitted in the presence of noise—thus tying the probability of making the right decision to the trend’s signal-to-noise ratio.
- Matched Filter theory produces the optimal linear filter for maximizing the signal-to-noise ratio in the presence of additive stochastic noise—thus identifying both the trend filter’s optimal shape and duration. Know which trend is your friend.
- Differential Signal Processing eliminates noise common to a pair of signals by subtracting one from the other—such as subtracting the daily market noise in common to multiple mutual funds. It’s not a solo contest, it’s a horse race.
Finally, the distinct character difference observed between bull and bear markets beckons for a “problem segmentation” solution that includes a bull market strategy, a bear market strategy, and a market direction indicator to determine when to switch from one to the other. Bear market strategies are conceptually similar to bull market strategies, but focus on different asset classes. All well-known market sentiment indicators, such as the Death Cross, use a single source of data (typically the S&P 500 index) as its basis for determining market direction, and do their best to balance the need to (1) reduce whipsaw losses caused by knee-jerk reactions to market dips by not reacting too quickly, and (2) minimize the losses from long-duration bear markets by not reacting too slowly. However, the simplicity of these systems inherently leave them susceptible to medium-term whipsaw losses, such as those created by the market drops of August 2015 and January 2016 when sharp rebounds occurred nearly two months after each drop. Unfortunately, adjusting the indicator’s timing to improve a particular event only moves the problem to events of other durations. To get better results requires additional information. The StormGuard-Armor indicator was thus designed to incorporate three views of the market to better ascertain its safety. In addition to the market price trend, market momentum and value sentiment are extracted from the market volume and new highs/lows data respectively in order to include the behavioral actions of momentum and value investors. Metaphorically, while watching one knee of an elephant to know if it’s going to take a step has definite value, watching three knees provides superior information by allowing earlier detection and eliminating false positives. Twelve measures from these three indicators are combined using the methods of fuzzy logic to produce a single final StormGuard-Armor value.
Taken together, these well-established signal processing developments provide strong motivation for attempting to broaden MPT’s art by including new information now accessible through time domain data analysis—i.e., trends/momentum.
Standard Risk and Return Measures?
In order to credibly judge the performance of an investment portfolio, its risk and return must be measured and compared with other references measured in the same way. While there is broad agreement that CAGR (compound annual growth rate) is the best measurement of return, there are numerous popular measures of risk involving some form of drawdowns or variability. Looking to regulators for resolution offers little satisfaction. Amazingly absent from the Employee Retirement Income Security Act of 1974 (ERISA), the Securities and Exchange Commission (SEC) Investment Advisers Act of 1940, the Financial Industry Regulatory Authority (FINRA) Rules, and the Uniform Prudent Investor Act (UPIA) is any practical definition of risk or its measure. There isn’t even a mention, much less a description, of the risk categories financial professionals most commonly discuss and employ: conservative, moderate and aggressive. Thus, the matter of risk’s definition and classifications have to be resolved by other means.
The SEC, UPIA, and ERISA rules and regulations all use the same general description of risk found in Webster’s Dictionary: “the chance that an investment will lose value.” Fortunately, academic authors have been forced to resolve the matter in order to draw conclusions about portfolio design. The advent of MPT in 1952 spurred the adoption of standard deviation as the measure of risk. In 1966 William Sharpe adapted its use for what has become known as the Sharpe ratio. Many have been critical of using the standard deviation as a measure of risk because upside deviation is generally thought of as the opposite of risk. Daniel Kahneman and Amos Tversky’s 1979 paper “Prospect Theory: An Analysis of Decision Under Risk,” considered the seminal paper in behavioral economics, showed the sharp contrast in perception between losses and gains of the same size. The Sortino ratio was later developed as an improvement over the Sharpe ratio by focusing only on downside deviation.
This article likewise measures risk as downside deviation—computed as the root mean square of negative quarterly returns, sampled daily over the portfolio’s data span.

Where:
- Total Days = the number of market days in the evaluation period
- 3mo = one quarter of a year, typically 63 market days
- p(i) = the equity curve value on day i
Risk-Category Reference Portfolios
Although regulatory documents are silent regarding risk category definitions (such as conservative, moderate, and aggressive), financial institutions have stepped forward and defined their own sets of risk category portfolios. Representative examples include Fidelity’s Asset Manager Funds, Schwab’s Asset Allocation Models, Vanguard’s Portfolio Allocation Models, and AAII’s Asset Allocation Models. They are all classic MPT “diversify and rebalance” portfolio designs. Fortunately, they have all long stood the test of time with regulators, and together form a consensus set of industry-standard definitions that enable risk-ranked portfolios to be modeled, quantified, and used as reference standards in assessing the relative risk of any investment portfolio.
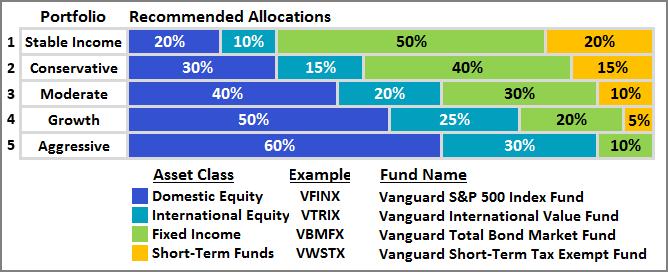
The asset allocation models for each of the five Consensus Portfolios of Figure 1 were derived from a survey of asset allocation models published by respected industry leaders.
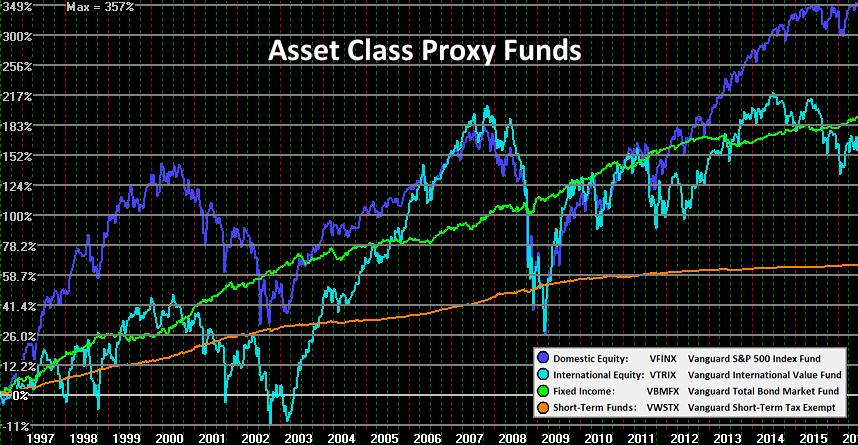
Vanguard mutual funds VFINX, VTRIX, VBMFX, and VWSTX, plotted in Figure 2, were selected as proxies to represent the four asset classes (domestic equity, international equity, fixed income, and short-term funds) because of their excellent asset class matches, long data history and broad industry respect. Equally suitable funds producing like results are available from other companies.
The 25-year risk/return performance for the five Consensus Portfolios is plotted in Figure 3, alongside their constituent asset class funds. The annualized return is measured as CAGR, and risk is measured as quarterly downside deviation. As should be expected, portfolios 1 through 5 line up nicely just under MPT’s efficient frontier (blue dashes) between the fixed-income fund (green dot) and the domestic equity fund (dark blue dot). The efficient frontier is a fundamental MPT concept that specifies the set of optimal stock/bond portfolios offering the highest expected return for a defined level of risk. Although MPT’s definition of risk is standard deviation vs. downside deviation, which would somewhat alter the plot, the concept still applies. What’s important is that these portfolios actually are the accepted industry and regulatory reference standards against which all others may be judged.
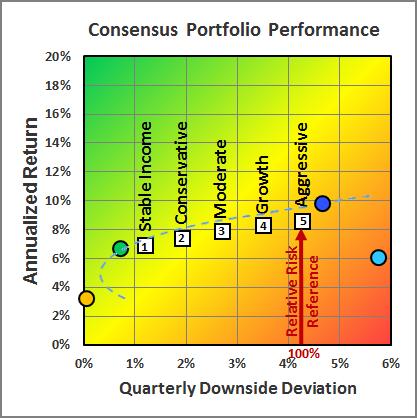
To help put the values of quarterly downside deviation (QDD) into better perspective for the charts that follow, it is replaced with the concept of relative risk, which is simply the ratio of the QDD of the test portfolio to the QDD of the standard Aggressive Portfolio. The red arrow in Figure 3 marks the standard Aggressive Portfolio as the definition of 100% relative risk. Thus, the standard Aggressive Portfolio is the relative risk reference standard, and by definition has a relative risk of 100%.
Relative Risk = (QDD of test portfolio)/(QDD of Std. Aggressive Portfolio)
New Tools Change Old Rules
One of MPT’s most well-known tenets is that risk must be traded for return. While this is certainly true within the constraints of MPT’s framework, new tools change old rules. Consider, for example, an icy set of steps: the relationship between descent speed and danger is radically changed by wearing spiked shoes or by applying sand to the steps. Similarly, the risk of death in cities was greatly reduced by sewers, water filtration, vaccinations and other new developments. Likewise, finding trends in noisy market data profoundly alters the relationship between risk and return.
Momentum is a property that produces trends in market data. Its very existence means that the market cannot possibly be a random walk as required by the efficient market hypothesis. Momentum means that something in the near past will continue into the near future. Seeing even a little bit of the road ahead changes everything. In fact, we are not limited to the average performance inherent to MPT’s broad diversification mandate. Momentum can be generated by seasonal market effects, changes in regulations, new technology deployment, or a series of products brought to market by a crack development team.
Although momentum is generally considered “market timing,” it should be noted that there are two very distinct types of market timing: (1) Wave, pattern and value investors examine evidence to decide “what the market should do.” (2) Momentum traders examine trends in market data to decide “what the market is already doing.” Betting against the herd is not a profitable strategy. It is better to be right than early.
Asset Class Rotation
Most financial professionals speak of asset class rotation in terms of tactically overweighting one or more asset classes in a portfolio while underweighting the others in response to a variety of market indicators they follow. However, a simple thought experiment easily calls such timid asset class rotation into question. If the asset class funds of Figure 1 were equally weighted in a portfolio, a performance similar to the Moderate Portfolio of Figure 3 would be expected. If applying a mild amount of over/underweighting is found to be beneficial, it’s likely that going all in with a single asset class would perform proportionally better. In fact, this is easily demonstrated to be true. A common reaction to the concept of rotating 100% of the portfolio’s assets from one fund to another over time is that it would result in higher risk. However, these are already well-diversified funds investing in many sectors and with virtually no remaining single-stock risk. Furthermore, if the asset class rotation strategy is successful, it should actually reduce overall risk through avoidance of poorly performing funds. The asset class rotation strategies that follow typically trade only two to four times per year, making them easy to manage and their trading costs comparatively unimportant.
Although the concept of asset class rotation is fairly simple, so is the concept of building a house. However, having the right tools and using the right procedures makes all the difference in the outcome. While the performance of simpler asset class rotation strategies is reviewed later in this article, the asset class rotation strategy of Figure 5 below is designed to incorporate all of the new signal processing developments described earlier and uses the four standard asset class funds of Figure 1: VFINX, VTRIX, VBMFX, and VWSTX. In addition, it includes one more fundamentally important development that needs an introduction: automated polymorphic momentum. Automated polymorphic momentum (APM) is simply a method of automatically morphing the shape and duration of the trend filter to maintain optimum performance as the character of the strategy’s participating funds change over time.
One of the most common errors made in the design of rotation algorithms is the assumption that bond funds, broad index funds, sector funds, country funds, stocks, and commodities can all be treated identically—assuming one size fits all when measuring momentum. Yet it’s obvious to all that the character of these equities is quite different. In fact, the optimum trend filter shape and duration does depend on the character of the candidate funds in the strategy. Furthermore, the optimum choice may change over time as funds with shorter histories start to contribute. For example, if the strategy initially had a variety of bond and balanced funds participating, but later in 2006 a few sector funds also start participating, it should be reasonably expected that the optimum trend filter would be different for earlier years than for later years. It’s like changing the players on a football team in the second half of the game by replacing stodgy running backs with hot pass receivers. The team will perform best with a change in style and rate of play.
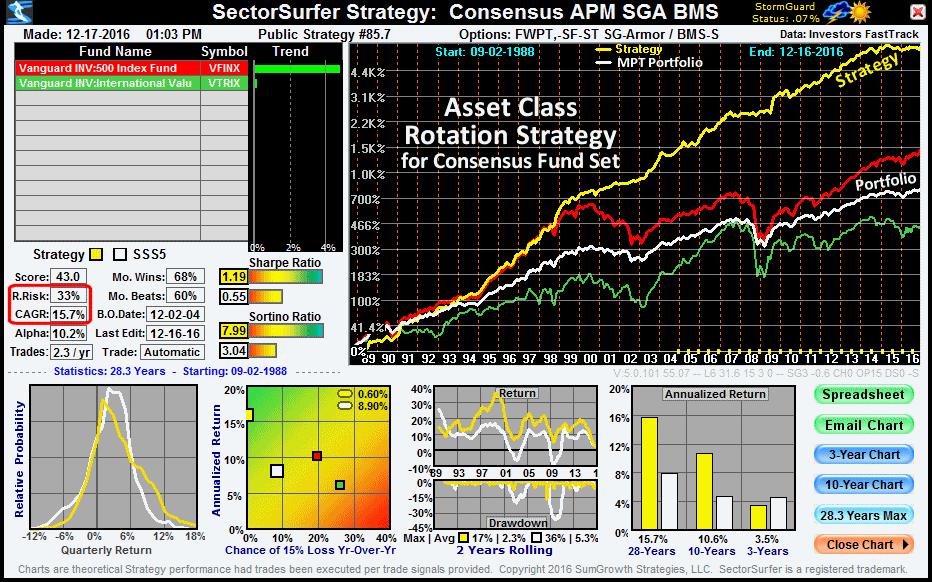
With APM, the investor is not only relieved of the tedium of manually tuning each strategy variant, but further benefits from (a) its adaptive character and (b) evidence that the strategy can walk forward in time through out-of-sample data. On SectorSurfer strategy charts, such as Figure 5, the yellow dots along the horizontal axis of the main chart are spaced at approximately half-year intervals and indicate the date of each Forward-Walk Progressive Tuning event. The first of them indicates the initial backtest tuning event. Backtesting is important for setting initial parameter values and provides a “best case” scenario of what may be possible. However, the more rigorous test is walking forward in time through new data. Without the vision of hindsight, the algorithm can no longer adjust its parameters to include the important pops and exclude the devastating drops. While walking forward, a strategy with chaotic pops and drops will inherently perform poorly, but if the trend signals are relatively free of punishing random noise, successfully trading from one trend leader to the next will be obvious by the quality of the strategy’s equity curve.
The asset class rotation strategy of Figures 4 and 5 utilizes APM to select between stock funds VFINX, VTRIX during bull markets, StormGuard-Armor to decide whether it is a bull or bear market, and an APM strategy to select between fixed income funds VBMF and VWSTX during bear markets. Its performance is illustrated in Figure 4 at data marker A and is plotted in relation to the Consensus Portfolios 1 through 5 imported from Figure 3.
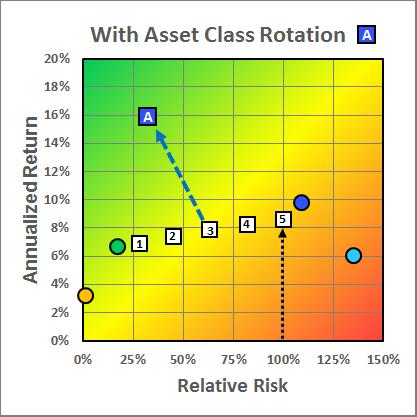
The asset class rotation strategy (A) has doubled the return and reduced the relative risk by half compared to Consensus Moderate Portfolio (3). Its excellent performance is a product of the previously referenced (a) improved signal-to-noise ratio methods of matched filter theory and differential signal processing; (b) automated polymorphic momentum strategy tuning, (c) StormGuard-Armor’s tipple-sense market direction indicator; and (d) an integrated bear market strategy.
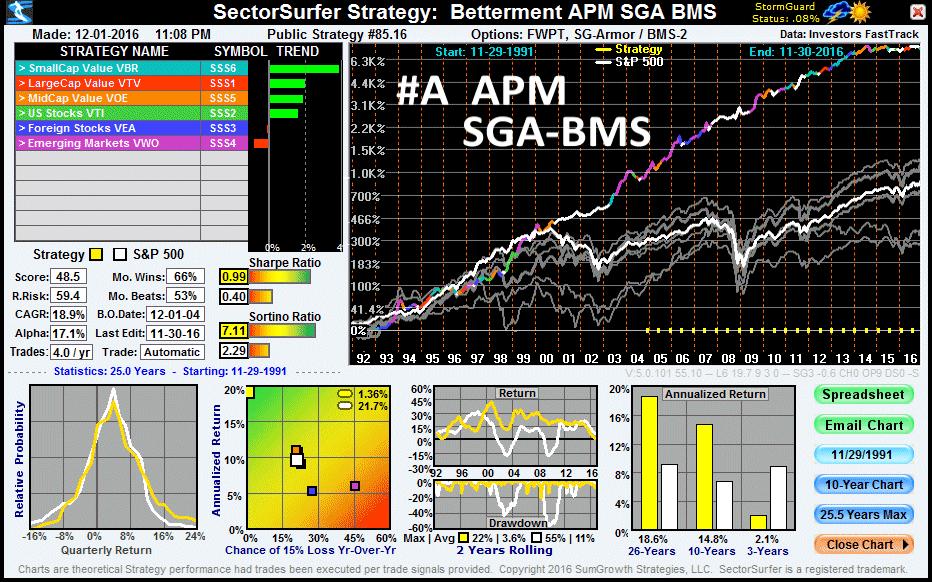
The asset class rotation strategy performance is plotted in yellow in Figure 5, the MPT Consensus Moderate Portfolio is plotted in white as a reference comparison, and funds VTRIX and VFINX are plotted in their respective colors.
Editor note: The animated GIF version of this chart can be viewed here.
As used herein, the term “strategy” refers to a method of selecting and owning a single fund from a set of candidate funds, whereas the term “portfolio” refers to owning every one of the listed funds in some proportion. The strategy’s animated equity curve alternates between a solid yellow color and a multi-colored curve that is green during periods when VTRIX is owned, red when VFINX is owned and white when StormGuard-Armor switches to its bear market strategy. The R.Risk (relative risk) and CAGR (compound annual growth rate) are posted in the center-left statistics portion of the chart and are plotted as data marker A in Figure 4. This simple asset class rotation strategy leaves its MPT Portfolio counterpart in the dust, producing twice the CAGR with half the relative risk.
Clearly, new tools can change old rules. Still, it’s not uncommon to hear an investor say “I like to keep it simple,” even though it’s quite obvious that technical complexity drove the radical improvements we’ve seen in cars, phones, printers and rockets. For the same reasons, complexity should be expected for high-performance investment algorithms. That said, complexity under the hood does not necessarily equate to complexity of use. Automobiles are quite complex under the hood, but very easy to drive. Although, a 12-month SMA (simple moving average) may make trend indicators easy to calculate, its performance value is no better than putting a Model-T engine in your car because it’s easy to fix. Conversely, APM is very complex, but it’s still easy to use because it’s automated. The performance of this asset class rotation strategy excels because of the complexity of its algorithm: Four important signal processing problems were addressed utilizing cross-disciplinary mathematics from the field of electronic signal processing to improve trend signal quality and thus the probability of making a better investment choice.
Robo-Advisers: Allocation vs Rotation
A few years ago a new class of financial advisers began emerging that today have generally become known as “robo-advisers.” They automate the process of creating and managing an investment portfolio suitable to your risk appetite and life situation. Today, almost every major brokerage offers some form of robo-advisory service that reduces the typical account fee of 2% of assets under management to about 0.25% of assets under management. While this article focuses on a portfolio designed for the author by Betterment’s automated software, both the process and portfolio construction were quite similar for numerous other robo-adviser systems sampled. Most notable about them was that all of their portfolios were designed around the basic MPT principles developed in 1952.
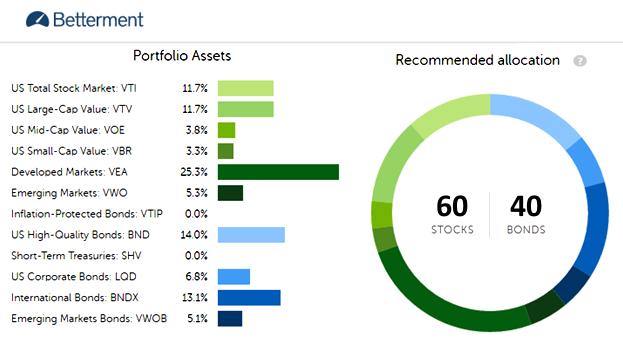
The Betterment 60/40 portfolio of Figure 6 was produced by providing moderate responses to a series of automated risk assessment questions. Their algorithm chose 10 allocation-weighted ETFs as shown. The 60/40 stock/bond split aligns with the Moderate Consensus Portfolio definition of Figure 1.
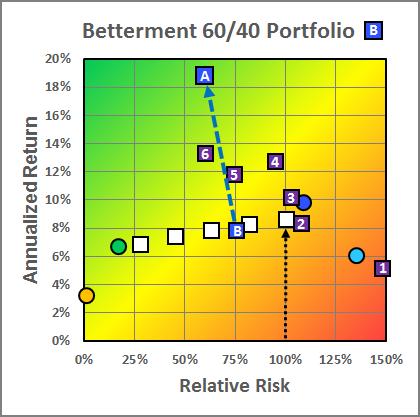
The Betterment 60/40 Portfolio performance is charted against the standard Consensus Portfolios 1 through 5 in Figure 7, and its proximity to the Consensus Moderate Portfolio (3) is not surprising. Likewise, robo-portfolios from Wealthfront, FutureAdvisor, Schwab and others similarly line up slightly under MPT’s efficient frontier (blue dashes) between the fixed-income fund (green dot) and the domestic equity fund (blue dot).
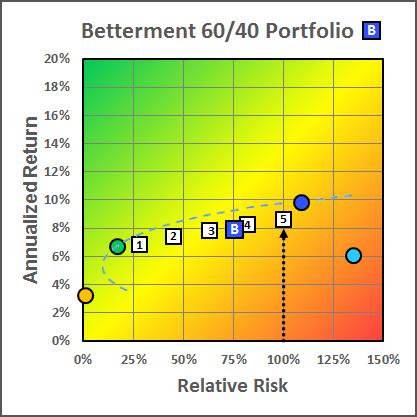
As should be expected, Fidelity’s Asset Manager and Vanguard’s LifeStrategy series of funds perform similarly. More interesting is that all major mutual fund companies have long offered a broad set of “target date” funds that automatically change the asset class allocation over time – just as the robo-advisers do – but without charging a fee of 0.25% of assets under management. Even with their automated advice and nice cell phone apps, robo-advisers sell ordinary MPT and are “a distinction without a difference.”
We know from the Consensus Portfolio examples that asset class rotation using automated polymorphic momentum, StormGuard-Armor, and an integrated bear market strategy, makes a profound difference. Because there are many other common ways to measure trends or indicate market direction, let’s build a variety of strategies with the Betterment funds using different asset class rotation algorithms and compare their performances. Figure 8 summarizes the CAGR, relative risk, and Sharpe ratio performance of the Betterment 60/40 portfolio along with seven alternative methods of executing an asset class rotation strategy with the same funds.
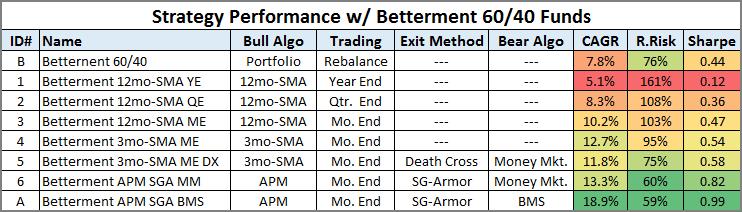
A description of each follows:
1. This method models investors who examine published fund rankings each year in January, and on February 1st buy the fund with the best 12-month SMA.
2. Evaluates the 12-month SMA at the end of each quarter and buys the leader.
3. Evaluates the 12-month SMA at the end of each month and buys the leader.
4. Evaluates the 3-month SMA as the end of each month and buys the leader.
5. Evaluates the 3-month SMA at the end of each month and buys the leader unless the Death Cross (50/200 SMA of S&P 500) says to move to a money market fund.
6. Uses automated polymorphic momentum to determine the trend leader at the end of each month unless StormGuard-Amor says to buy a money market fund.
A. Uses automated polymorphic momentum to determine the trend leader at the end of each month unless StormGuard-Amor says to use a bear market strategy.
The relative performance of the seven asset class rotation strategies is plotted in Figure 9 for comparison with the five standardized Consensus Portfolios in white.
These strategies demonstrate that choosing a momentum algorithm should not be done thoughtlessly. In fact, the series of events that led to SectorSurfer’s development began with the experience of investing $2,000 per year from 1984 through 1991 and switching to the top two Merrill Lynch funds in Money Magazine’s annual fund list (just like strategy 1). The S&P 500 doubled over that period while my IRA lost 5% in value. A wake-up call indeed!
From the plotted performance of asset class rotation strategies 1 to 4, it is clear that shorter evaluation periods and execution intervals are better. Although not plotted here, it should be mentioned that when evaluation periods and trading intervals get too short, performance again declines because the algorithm becomes susceptible to whipsaw losses when short-term market drops often snap back. Also notable in the plot is that strategies 5, 6 and A, which all employ a market direction indicator, have approximately 30% less relative risk then strategies 1 to 4, which don’t employ one. Finally, it is clear that the best-performing asset class rotation strategy, A, is the one that best addresses these three critical performance issues:
- The best trend filter shape and duration for bull markets depends on the character of the candidate set of funds. One size does not fit all. Automated polymorphic momentum not only solves this problem, but simplifies its use.
- Simple market direction indicators, such as the Death Cross, do improve performance during bear markets, but one that considers trend, volume, and value sentiment, such as StormGuard-Armor, performs much better.
- The character of a bear market is very different from a bull market. While sitting it out safe in a money market fund is good, an integrated bear market strategy that invests in equities that prosper in bear markets is better.
The sequentially displayed charts of Figure 10 are instructive in showing the changing character of the strategy as each improvement is made. The noteworthy changes to observe include:
- The improving character of the equity curve.
- The progression of the yellow strategy marker on “square rainbow” chart.
- The improving character of the rolling return and drawdown charts.
Why Asset Class Rotation Matters
The Economic Policy Institute’s March 2016 article “The State of American Retirement” paints a very poor picture of American retirement savings. While the average retirement account savings of families 45 to 55 years of age is $102,000, the median retirement account savings is only $7,200. This large discrepancy is explained by nearly half of families not participating in any retirement savings plan whatsoever. According to Fidelity Investments, to be financially ready to retire by age 67, you should have approximately 10 times your final salary in savings. Arguably, the greatest investment risk facing most Americans is the possibility of running out of money early, or continuing to work forever to meet ends. While it’s difficult for most people to sufficiently increase savings in the time remaining, alternative investment methods, such as asset class rotation, could significantly change the picture.
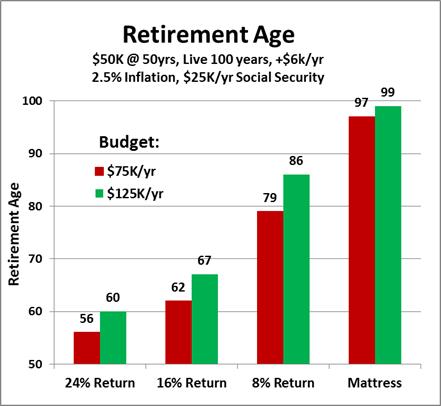

Consider the case of someone 50 years of age with $50,000 currently saved, contributing an additional $6,000 per year, expecting $25,000 per year from Social Security, possibly living to 100 years old, and planning for 2.5% inflation. Figure 11 shows that projected retirement age is tightly tied to investment returns.
Putting your retirement savings under the mattress will guarantee that you’ll work until you drop. Even 8% per year means working until at least 80 years of age. However, earning 16% or more radically changes the prospects for retiring early and well.
Conclusion
MPT was a giant leap forward for risk management when it was introduced in 1952, long before computers were available for analyzing daily market data. In all other markets, the product designs of 1952 have been relegated to the museum. However, in spite of the many advancements in signal processing theory and computerized data processing, MPT remains the predominant investment practice for pension funds, target date funds, and even the new robo-adviser automated portfolio management systems. The reason large companies have stayed with MPT probably include: (a) it’s relatively easy to explain; (b) it is inherently accepted by regulators and the courts as prudent; (c) they believe they must sell it to most of their customers because they know it is statistically impossible for everybody to get better-than-average returns; and (d) with no quantitative definition or standardized measurement of risk, it is very difficult for an adviser to defend new investment methods during a fiduciary risk audit. Fortunately, individuals are not limited by the same burdensome limitations and today can quite easily design and execute their own asset class rotation strategies.
Most retirement plans, such as a 401(k), 403(b), 457, PERS and the Federal Thrift Savings Plan, offer funds that are very similar to the asset class funds used in the above examples. Thus, asset class rotation strategies made with them will perform similarly to the examples in this article. However, broadly diversified asset class funds are just appetizers: sector, country and commodity funds provide even greater performance opportunities. Asset class rotation is an important step toward sector rotation, which will be the topic of a subsequent article.
Discussion
FREE REPORT

G.M.B. from TX posted over 9 years ago:
Scott Juds from WA posted over 9 years ago:
David Levine from NC posted over 9 years ago:
John Saldutti from PA posted over 9 years ago:
Edwin Villafane from GA posted over 9 years ago:
Raymond Rondeau from RI posted over 9 years ago:
Scott Juds from WA posted over 9 years ago:
Scott Juds from WA posted over 9 years ago:
Charles Holden from WA posted over 9 years ago:
Glenn Patterson from CA posted over 9 years ago:
You need to log in as a registered AAII user before commenting.
Log InCreate an account