


This article examines a group of high-flying growth stocks that soared in the early 1970s, only to come crashing to earth in the vicious 1973–74 bear market. These stocks are often held up as examples of speculation based on unwarranted optimism about the ability of growth stocks to continue to generate rapid and sustained earnings growth. And it was not just the public, but large institutions as well that poured tens of billions of dollars into these stocks. After the 1973–74 bear market slashed the value of most of the “Nifty Fifty,” many investors vowed never again to pay over 30 times earnings for a stock.
But is the conventional wisdom justified that the bull market of the early 1970s markedly overvalued these stocks? Or is it possible that investors were right to predict that the growth of these firms would eventually justify their lofty prices? To put it in more general terms: What premium should an investor pay for large, well-established growth stocks?
The Nifty Fifty
The Nifty Fifty were a group of premier growth stocks, such as Xerox, IBM, Polaroid and Coca-Cola, that became institutional darlings in the early 1970s. All of these stocks had proven growth records, continual increases in dividends (virtually none had cut its dividend since World War II), and high market capitalization. This last characteristic enabled institutions to load up on these stocks without significantly influencing the price of their shares.
The Nifty Fifty were often called one-decision stocks: buy and never sell.
Because their prospects were so bright, many analysts claimed that the only direction they could go was up. Since they had made so many rich, few if any investors could fault a money manager for buying them.
At the time, many investors did not seem to find 50, 80 or even 100 times earnings at all an unreasonable price to pay for the world’s preeminent growth companies. Forbes magazine retrospectively commented on the phenomenon as follows:
“What held the Nifty Fifty up? The same thing that held up tulip-bulb prices in long-ago Holland—popular delusions and the madness of crowds. The delusion was that these companies were so good it didn’t matter what you paid for them; their inexorable growth would bail you out.
“Obviously the problem was not with the companies but with the temporary insanity of institutional money managers—proving again that stupidity well-packaged can sound like wisdom. It was so easy to forget that probably no sizable company could possibly be worth over 50 times normal earnings.”
Nifty Fifty Returns
Let’s trace the performance of the Nifty Fifty stocks as identified by Morgan Guaranty Trust, one of the largest managers of equity trust assets. These stocks are listed in Table 1, along with their 1972 price-earnings (P/E) ratios. The product lines range from drugs, computers and electronics, photography, food and tobacco to retailing, among others. Notably absent are the cyclical industries: auto, steel, transportation, capital goods and oil.
Many of the original Nifty Fifty stocks are still giants today. In 1998, 15 occupied the list of top 40 U.S. stocks in market capitalization, and six (General Electric, Coca-Cola, Merck, Philip Morris, Procter & Gamble and IBM) are among the top 10. (Corporate changes in the Nifty Fifty since the early 1970s are described in the box at the end of the article.)
The Nifty Fifty did sell at hefty multiples. The average price-earnings ratio of these stocks was 41.9 in 1972, more than double that of the S&P 500 index’s 18.9, while their 1.1% dividend yield was less than half that of other large stocks. Over one-fifth of these firms sported price-earnings ratios in excess of 50, and Polaroid was selling at over 90 times earnings.
Table 1 ranks these stocks according to their annual compound returns from December 1972 through August 31, 1998. December 1972 was chosen because an equally weighted portfolio of each of these stocks peaked in that month, which was considered the height of the Nifty Fifty mania.

Consumer brand-name stocks, such as Philip Morris, Gillette, Coca-Cola and PepsiCo, were clearly the star performers after the 1972 peak. The drug stocks also performed extremely well. Merck, Bristol-Myers, Schering, Pfizer, Upjohn and Johnson & Johnson all beat the S&P 500. But the biggest winner was Philip Morris, which had an outstanding 18.8% return since December 1972.
Of course, there were also some big losers. Technology issues as a whole did badly, and four stocks, Emery Air Freight, Burroughs, MGIC Investment Corp. and Polaroid, had negative returns.
The Data
Did the Nifty Fifty stocks become overvalued during the buying spree of 1972? Yes—but by a very small margin. A portfolio with equal amounts invested in all of the Nifty Fifty stocks that was started at the market peak in December 1972 and rebalanced monthly would have realized a 12.5% annual return through August 1998. The same portfolio would have returned 12.2% if it were never rebalanced over time.
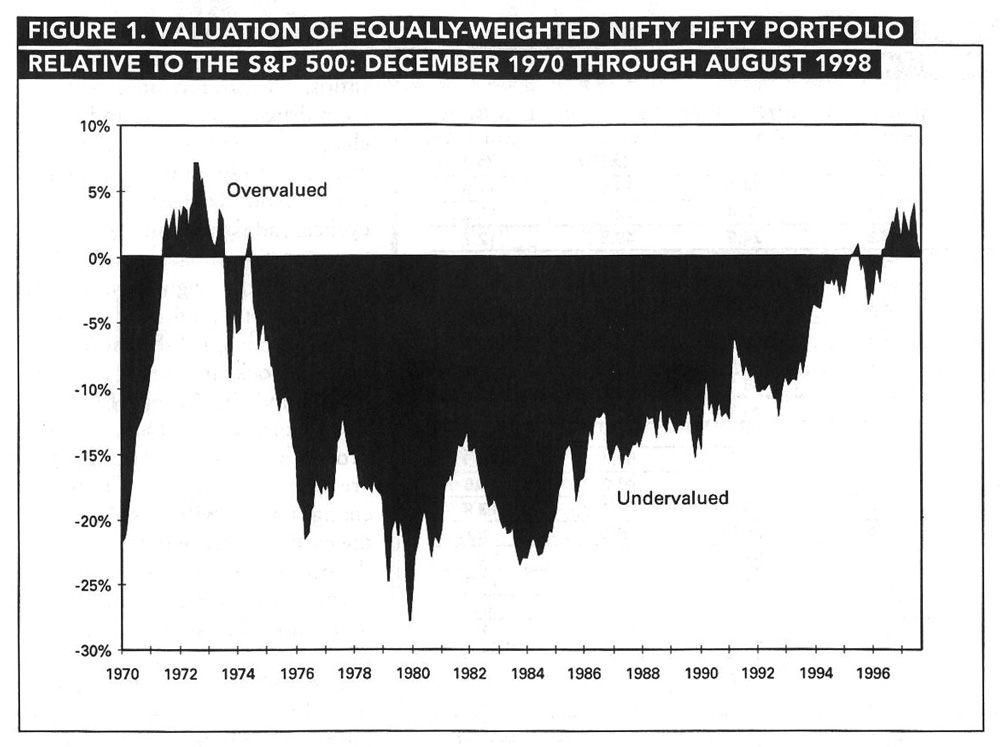
Figure 1 shows the degree of overvaluation or undervaluation relative to the S&P 500 of an equally weighted portfolio of the Nifty Fifty from December 1970 through August 1998. A fairly valued portfolio would show the same return as the S&P 500 over this time period, while an overvalued portfolio would underperform the index and an undervalued portfolio would outperform the index. In December 1972, at the peak of the Nifty Fifty mania, these stocks were overvalued by only about 3.2% on the basis of their return over the next 26 years, although they reached a maximum overvaluation of 7.2% in August of 1973 as the market began to decline. However, after 1976 they became deeply undervalued, and a portfolio composed of these stocks purchased during this time would have substantially outperformed the index.
Since the average dividend yield on the Nifty Fifty was more than 1½% below the yield on the S&P 500, most of their returns come from lower-taxed capital gains. The aftertax yield on a portfolio of Nifty Fifty stocks, purchased at their market peak, would have surpassed the aftertax yield on the S&P 500 for an investor in or above the 28% tax bracket.
The Right P/E for Growth
If you could have presented long-term investors with a crystal ball in 1972 that revealed the 26 subsequent years of dividends, earnings and 1998 prices of the Nifty Fifty stocks, what price would investors have paid for these stocks in December 1972? The answer is a price high or low enough so that, given their subsequent dividends and August 1998 price, their total returns over the past 26 years would match the overall market. Table 1 reports these prices relative to their 1972 earnings. Since these prices are warranted by their future returns, these price-earnings ratios are called the warranted price-earnings ratios. [Returns are also related to market risk but adjusting for this does not materially change the statistics in Table 1. For more on this, see “The Nifty-Fifty Revisited: Do Growth Stocks Ultimately Justify Their Price?” by Jeremy Siegel in the Journal of Portfolio Management, Summer 1995.]
What is so surprising is that many of these stocks were worth far more than even the lofty heights that investors bid them. Investors should have paid 68.5 times the 1972 earnings for Philip Morris instead of the 24 they did pay, undervaluing the stock by almost 3-to-1. Coca-Cola was worth over 82 times its earnings, and Merck should have sported a multiple of more than 76. Interestingly, the group that was the most undervalued, and subsequently most successful, catered to brand-name consumer foods, including McDonald’s, PepsiCo, Coca-Cola and even Philip Morris.
In contrast to brand-name consumer stocks, the technology stocks—that is, those in the original Nifty Fifty—failed badly. IBM, which commanded a price-earnings ratio of 35 in the early 1970s, was actually worth only 17.1 times earnings despite its recent stellar comeback. And while investors paid 45.8 times earnings for Xerox, it was worth only 19.4 times earnings on the basis of its future growth. Polaroid sported the highest price-earnings ratio, selling for a fantastic 94.8 times earnings, almost eight times higher than was justified by its future returns. Who would have thought in the 1970s that a soft-drink manufacturer would so thoroughly trounce technology giants such as IBM, Digital Equipment, Texas Instruments, Xerox and Burroughs?
Despite its mix of winners and losers, an equally weighted portfolio of Nifty Fifty stocks was worth 40.6 times its 1972 earnings, marginally less than the 41.9 ratio that investors paid for them.
EPS Growth & Valuations
Table 1 reports the rate of growth of per-share earnings of each of the Nifty Fifty firms over the subsequent 26 years through 1996 [a more recent update was not available, but these long-term growth rates do not change substantially over one- or two-year periods]. The average annual rate of growth was 11%, three percentage points higher than the earnings growth of the S&P 500. This contrasts sharply with the conclusion of some researchers who maintained that growth stocks had no better subsequent earnings growth than the average stock.
The relation between price-earnings ratios and the earnings growth of the Nifty Fifty shows that investors were not totally irrational to pay the premium they did for these stocks. In December 1972, the average price-earnings ratio of the S&P 500 was 18.9, which corresponds to an earnings yield (earnings divided by price, the inverse of a price-earnings ratio) of 5.3%. The Nifty Fifty, with a price-earnings ratio of 41.9, had an earnings yield of 2.4%, about three percentage points lower than the S&P 500. But the deficit in the earnings yield was almost exactly made up by the higher growth rate of future earnings, so their total return matched that of the S&P 500. The Nifty Fifty investors, therefore, properly traded off a higher price-earnings ratio (and a lower current yield) with higher subsequent earnings growth.
A rule of thumb for stock valuation is to calculate the sum of the growth rate of a stock’s earnings plus its dividend yield and divide by its price-earnings ratio. The higher the ratio, the better; famed money manager Peter Lynch recommends that investors go for stocks with a ratio of 2.0 or higher and avoid those with a ratio of 1.0 or less.
Yet this procedure would have eliminated all of the best Nifty Fifty stocks. The top stocks had 26-year earnings growth rates between 10% to 15% per year, yet their warranted price-earnings ratios often exceeded 50. Stocks with persistent earnings growth are often worth far more than the multiple that Wall Street considers “reasonable.”
But there is also a value-oriented theme hidden in the dazzle of these growth stocks. If you examine the actual price-earnings ratios of the Nifty Fifty stocks, the 25 stocks with the highest ratios (averaging 54) yielded only about half the subsequent return as the 25 stocks with the lowest price-earnings ratios (averaging 30). So, although these growth stocks as a group were worth more than 40 times earnings, they should not be considered buys “at any price.” Those stocks that sustain growth rates above the long-term average are worth their weight in gold, but few live up to their lofty expectations.
Conclusion
Examining the wreckage of the Nifty Fifty in the 1974 bear market, you can find two possible explanations for what happened. The first is that a mania did sweep these stocks, sending them to levels that were totally unjustified on the basis of prospective earnings. The second explanation is that, on the whole, the Nifty Fifty were in fact properly valued at the peak, but a loss of confidence by investors sent them to dramatically undervalued levels.
In 1975, there was no way of knowing which explanation was correct. But 25 years later we can determine whether the Nifty Fifty stocks were overvalued in 1972. Examination of their subsequent returns shows that the second explanation, roundly rejected by Wall Street for years, is much closer to the truth. A portfolio of Nifty Fifty stocks purchased at the peak would have nearly matched the S&P 500 over the next 26 years. Wall Street’s misunderstanding led to a dramatic undervaluation of many of the large growth stocks throughout the 1980s and early 1990s. Stocks with steady growth records are worth 30, 40 and sometimes more times earnings.
What can investors learn from this revisitation of the Nifty Fifty?
• You must pay for growth. Growth stocks often sport very high price-earnings multiples, but stocks that are able to consistently maintain earnings growth year-after-year are often worth far more than the multiple that Wall Street considers “reasonable.” Good growth stocks, like good wines, are often worth the price you have to pay.
• Don’t “pay any price.” Among these growth stocks, those with the lower price-earnings ratios tended to outperform those with higher price-earnings ratios. When examining growth stocks, don’t be scared off by high absolute price-earnings ratios, but try to cull out those growth stocks with lower price-earnings ratios.
• Most importantly, be diversified among various growth stocks and groups. Despite their dazzling performance, buying just a few of these growth stocks was quite dangerous. Among the many gems were bad apples. Even whole industries, like technology, that had enriched so many investors in the 1960s, vastly underperformed the market in the next 26 years. Diversification is a key to cutting risks and maintaining returns. No one stock or single industry is guaranteed to succeed.
This article is updated from Siegel’s book “Stocks for the Long Run” (second edition, McGraw-Hill, 1998).
Discussion
FREE REPORT

No comments have been added yet. Add your thoughts to the discussion!
You need to log in as a registered AAII user before commenting.
Log InCreate an account