


Related

Value Investing
Everyone wants to beat the market.
Unfortunately, unlike in the mythical Lake Wobegon, “where all the women are strong, all the men are good looking, and all the children are above average,” in the real world, the outperformance of one investor must come at the expense of another.
Indeed, as my firm noted in a special report published in the Bank Credit Analyst (April 24, 2014), net of fees, the average active investor will always underperform the market. (A)
Despite this grim reality, it is still possible to beat the market on a sustained basis. Of course, having a good nose for picking stocks helps. Yet, as I argue here, even investors whose last names do not start with “B” and end with “uffett” can exploit certain empirical regularities to tip the balance of luck in their favor.
The various characteristics of stocks that generate higher returns than what the capital asset pricing model (CAPM) would predict are known as “stock market anomalies.” [Editor’s note: The CAPM model calculates a stock’s rate of return based on its price volatility, as measured by beta, and the return premium stocks earn over a “risk-free” asset like Treasury bonds.] Two of the most famous anomalies are size and value. Since 1926, U.S. small caps have outperformed large caps by an average of 2.7% per year. Likewise, if one were to rank stocks by their price-to-book-value ratio, those with low ratios (i.e., value stocks) have outperformed those with high ratios (i.e., growth stocks) by an average of 4.8% per year. Indeed, as shown in Figure 1, value stocks have outperformed growth stocks by a cumulative 3,200% since 1926!
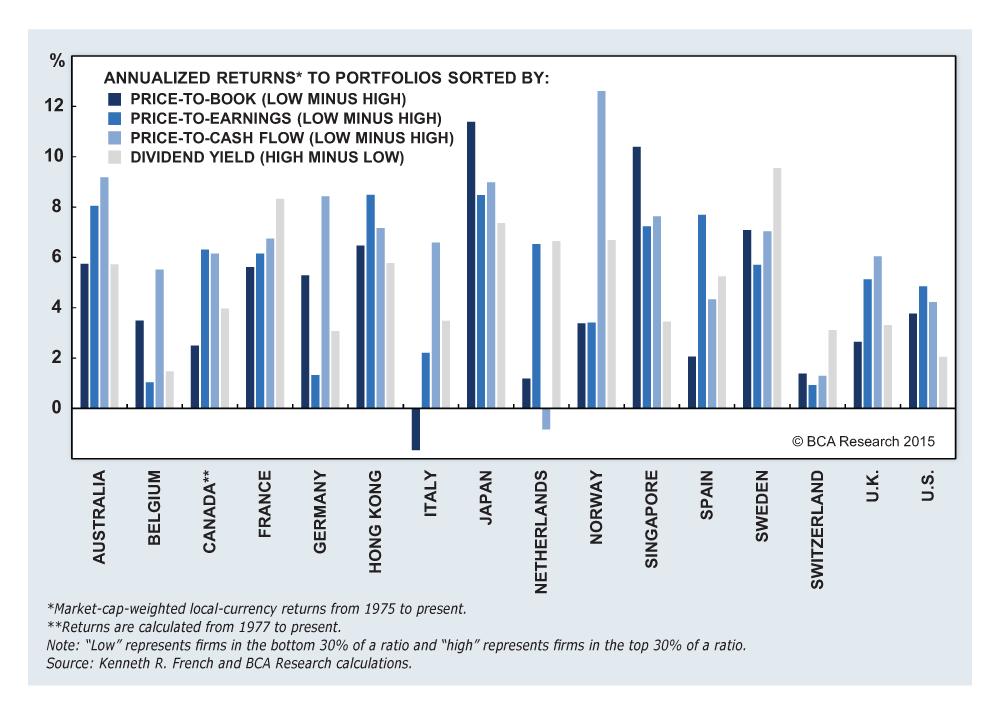
Other valuation metrics such as price-earnings ratios and price-to-cash-flow ratios, as well as dividend yields, have also been useful in predicting relative equity returns. Figure 2 shows that this is true both for the U.S. and globally.
An ongoing debate is whether the historical outperformance of small caps and value stocks reflects compensation for risk. Although this is the view that University of Chicago professor Eugene Fama and his supporters have taken, the evidence is far from conclusive. Since 1980, value stocks have outperformed growth stocks by an average of 1.3% per month during months when the market was down, but underperformed growth stocks by 0.4% during months when the market was up. Thus, value stocks have offered a partial hedge against market risk, suggesting that in equilibrium they should command lower expected returns than growth stocks. The fact that the opposite is true is a major problem for the efficient market hypothesis, which holds that prices reflect all known information.
Admittedly, value stocks did underperform growth stocks during the financial crisis. However, this was entirely due to the fact that most financial companies were classified as value stocks going into the crisis, since their price-to-book ratios were below the S&P 500 index average. In retrospect, it is clear that the value of bank assets was grossly inflated, which calls into question whether they should have been characterized as “value” stocks in the first place.
Interestingly, a 2008 study found that ranking stocks on the basis of various measures of financial vulnerability—leverage, credit spread, return on equity, earnings quality (i.e., low accruals), etc.—does show a negative relationship between risk and return. (B) In other words, those companies that appear to be most distressed go on to have lower average returns than those that appear healthy. This is completely at odds with the standard CAPM framework, which posits that systemically riskier companies should command higher expected returns. It also suggests that value stocks are generally not, as is often presumed, distressed companies.
If the value premium is not a proxy for financial distress risk, what drives it? The most plausible explanation is market mispricing. To illustrate this point, consider a situation in which the prices of some stocks are too high and others too low relative to the present value of their expected cash flows. What would one expect to see? All things being equal, the stocks that are overpriced would have higher market capitalizations and price-to-book ratios than those that are underpriced. And, of course, by definition, the overpriced stocks would end up underperforming the overall market. Thus, you can easily explain both the size and value premium if you concede the possibility that markets may not be perfectly efficient. (C)
Of course, some stocks that trade at high price-earnings ratios may still be attractive if the company is able to rapidly increase earnings. The problem is that reliably forecasting long-term earnings growth is a mug’s game. A 2003 study found that, beyond one year out in particular, there is little correlation between the earnings growth forecasts published in databases such as Thomson Reuters’ I/B/E/S (Institutional Brokers’ Estimate System) and the earnings growth that companies subsequently deliver. (D) This is mainly because profitability tends to mean revert over time. In a classic paper, Fama and Kenneth French found that corporate profitability reverts to the mean at a rate of close to 40% per year and that mean reversion is faster when profitability is further from the norm in either direction. (E)
Consistent with the thesis that investors overpay for growth is the fact that asset growth, sales growth, and capital investment are all negatively correlated with future returns. (F) To some extent, this may be because corporate executives like to engage in “empire building.” In most cases, however, it turns out that features such as rapid sales growth are not bad per se; rather, investors simply overpay for them to the detriment of future returns.
How does one reconcile the fact that investors seem to overpay for bad companies (i.e., those that are truly distressed) while also overpaying for good companies (i.e., those that have been able to grow earnings rapidly)? The answer is that there is a common behavioral bias at work: overconfidence. Investors tend to overstate the likelihood that a company teetering on the verge of bankruptcy will be able to turn itself around, while also overstating the probability that a high-flying company will be able to continue soaring. What they really should be doing is focusing on companies that are already profitable and trade at a decent multiple of net asset value and earnings.
One of the unavoidable truths that bottom-up stock pickers must grapple with is that there will always be people who understand the company that they are investing in better than they do. This is especially the case for investors who prefer to hedge their risks by holding a diversified basket of stocks. However, relying on the opinions of others—such as sell-side analysts—is a treacherous business. What does the evidence say?
As far as analysts are concerned, the evidence, not surprisingly, shows that for the most part buy/sell recommendations are poorly correlated with future returns. There are, however, five exceptions to this rule:
Statisticians like to say that if you torture the data long enough, it will confess to anything. This old adage is especially relevant to the study of stock market anomalies. First, there is the risk that any anomaly that is unearthed will simply end up being the product of data mining. Second, even if an anomaly turns out to be genuine, there is a risk that it will be arbitraged away once the investment community becomes aware of it.
Clearly, there is some merit to these concerns. For example, older readers may recall the so-called “blue Monday effect”—the tendency of stocks to do poorly at the start of the week. Outside of micro-cap stocks, this effect has been largely absent from the data since the early 1980s. The January effect also seems to have migrated into December, as investors have attempted to capitalize on it (giving rise to the “Santa Claus” effect).
That said, one should keep these concerns in some perspective. Many of the findings discussed above have been replicated for other markets and time periods that were not covered in the original research. Moreover, the deep-seated institutional and behavioral underpinnings of many stock market anomalies make it difficult for them to be fully arbitraged away.
Excerpted and edited with permission from “Introducing ETS: A Top-Down Approach to Bottom-Up Stock Picking,” a special report published by BCA Research (bcaresearch.com).
A. BCA Research,The Bank Credit Analyst Special Report, “What Am I Good For? Debating the Merits of Active Versus Passive Management,” April 24, 2014.
B. John Y. Campbell, Jens Hilscher, and Jan Szilagy, “In Search of Distress Risk,” The Journal of Finance 63:6, (December 2008): pp. 2899-2939.
C. The size premium is even bigger if one controls for the fact that small caps tend to score poorly on “quality” variables such as profitability and stability in earnings. Please see Cliff Asness et al.,”Size Matters, If You Control Your Junk,” Fama-Miller Working Paper, (January 2015).
D. Louis K. C. Chan, Jason Karceski, and Josef Lakonishok, “The Level and Persistence of Growth Rates,” The Journal of Finance 58:2, (April 2003): pp. 643-84.
E. Eugene F. Fama and Kenneth R. French, “Forecasting Profitability and Earnings,” The Journal of Business 73:2, (April 2000): pp. 161-175.
F. Yuhang Xing, “Interpreting the Value Effect Through the Q-theory: An Empirical Investigation,” Review Of Financial Studies 21:4, (2008): pp. 1767-1795.
G. Ireneus Stanislawek, “Are Stock Recommendations Useful?,” 1741 Asset Management Ltd Research Note Series, (IV 2012).
H. David Veenman and Patrick Verwijmeren, “Earnings Expectations and the Dispersion Anomaly,” (January 2015).
I. Da Zhi and Ernst Schaumburg, “Target Prices, Relative Valuations and the Premium for Liquidity Provision,” AFA 2007 Chicago Meetings Paper, (February 2006).
Value Investing

Portfolio Strategies

Investing Gurus

David Levine from NC posted over 9 years ago:
Dave Gilmer from WA posted over 9 years ago:
Dave Gilmer from WA posted over 9 years ago:
You need to log in as a registered AAII user before commenting.
Log InCreate an account