


In these volatile markets, we wanted to make sure our valued members get access to the best information possible to help you navigate the uncertainty. This is why you may have noticed the recent enhancements to our Stock Ideas Update email.
Each week, we are sending you education and stock ideas that are relevant to today’s market. Markets like these expose bargains, so we want to highlight a few ideas that can help you replenish your portfolio through sound strategies with good long-term performance.
If you find this information valuable and want an edge throughout this market volatility, you can access robust stock screens and evaluations through A+ Investor, a suite of rigorous investment tools that includes diversification analysis, stock evaluators and more than 50 stock screens updated every day.
This week we cover our Stock All-Stars. These are stocks that pass multiple screens and can be found by using AAII.com’s powerful My Screens feature.
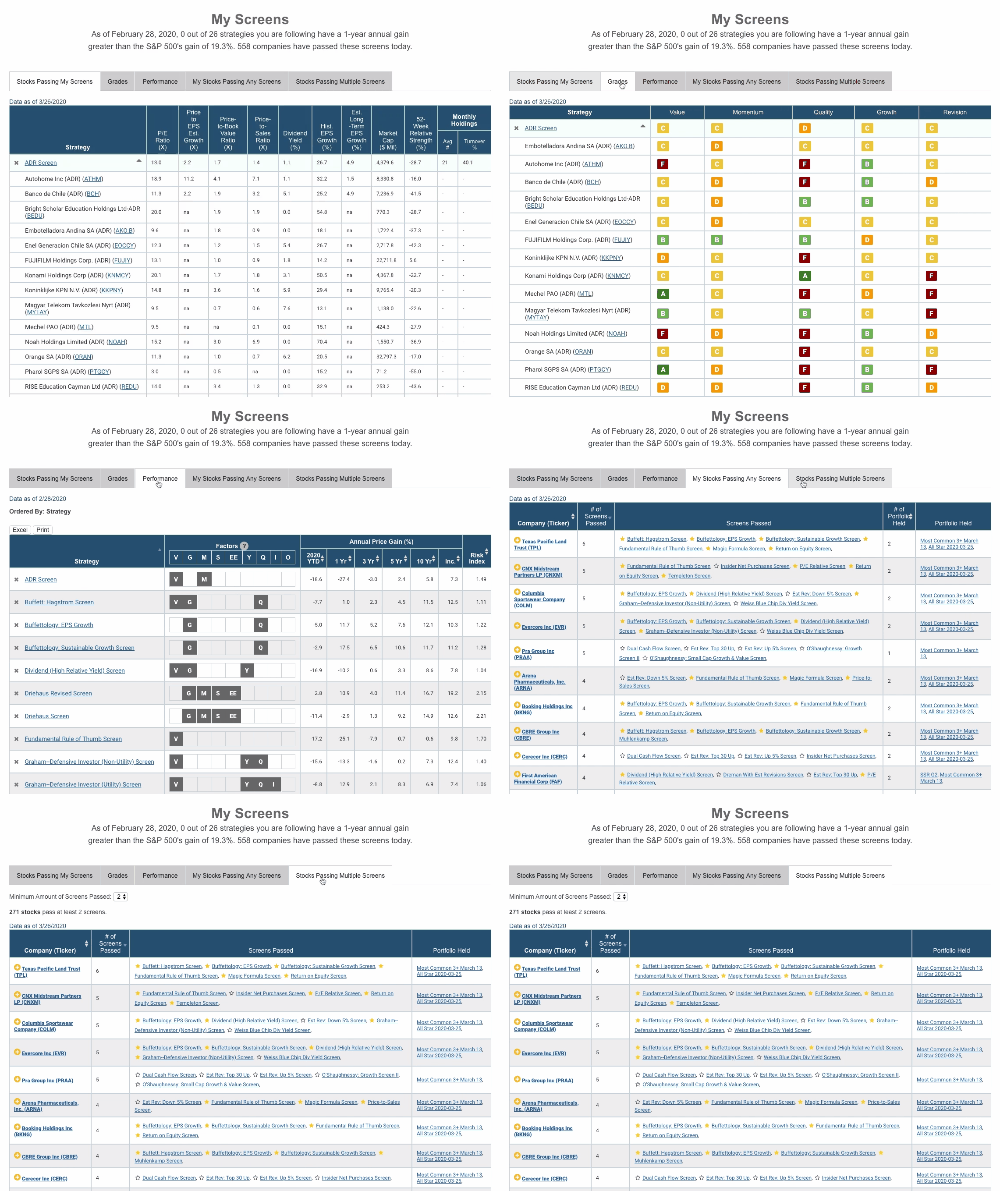
Please read on to learn more about our All-Stars and see the stocks that currently pass four or more of the stock screening strategies AAII tracks.
16 All-Star Stocks Passing the Most Screens
Over the years, AAII has studied the works of many successful investors. Our goal has been to learn from the winning strategies and techniques of investment legends, modern day investment professionals with a proven record of long-term success and even prominent academic research on investing. The desire has been to use this knowledge to create screening strategies that investors can use to identify interesting investment candidates.
Screening is the application of quantitative criteria to a broad universe of stocks in order to narrow the list down to a few companies. It allows you to focus your attention on a smaller but more promising group of stocks to conduct further research.
There are around 40 stock screening strategies on AAII.com derived from the works of successful gurus, along with 20 screens based upon academic research or investment factors that help you identify investment ideas. The screens range from deep value approaches following the philosophy of investment gurus such as Warren Buffett to earnings and price momentum strategies championed by William O’Neil.
Stocks That Pass the Most Screens
In looking at the stocks that pass the screens, an interesting question arises: Is a stock that passes multiple complete screening approaches more attractive than another stock that just passes one screening approach? Possibly, if the screening approaches that a stock passes are based upon solid financial principles and are diverse enough to capture unique yet desirable qualities.
There are 1,084 stocks that currently pass at least one of the 60 screening strategies presented on AAII.com, but there are only 16 stocks passing four or more screens, and they are the stocks that are presented below.
The stocks are ranked by how close their price relates to their 52-week high price. With the dramatic market ups and downs over the last few weeks, some companies had bigger declines and these stocks would be toward the bottom of the table. For example, Fidelity National Financial Inc.’s (FNF) closing price of $31.77 is 64% off of its 52-week high price of $49.28. Fidelity National is a provider of title insurance and transaction services to the real estate and mortgage industries. Despite low interest rates, which will help mortgage refinancing activity, title insurance providers have experienced near-term demand destruction for title insurance due to the economic slowdown caused by the coronavirus pandemic.
For the most part, the stocks currently passing multiple screens are meeting the criteria for value or growth approaches that identify companies with low prices relative to company financial measures such as assets or earnings, or companies exhibiting strong, consistent and prolonged growth. For example, the Buffett Hagstrom screen combines price relative to free cash flow, historical earnings growth, industry-beating margins and return on equity. All of these elements are well known and well used by value investors. The approach identifies “excellent” businesses based on the prospects for the industry and the ability of management to capitalize on opportunities for the ultimate benefit of shareholders. When combined, the characteristics help to indicate if a candidate merits further analysis.
The table lists two price-earnings ratio calculations: one based upon trailing earnings per share, and one that is determined using forward earnings expected for the current year. The price-earnings ratio is a basic valuation measure, but it can be more difficult to use during economic turning points. If you see a forward price-earnings ratio that is lower than the trailing ratio, it indicates that analysts are expecting future earnings to be higher.
The market capitalization (number of shares outstanding times the share price) is a common way to measure the size of a firm. With a market cap of $95.2 billion, Lowe’s Companies Inc. (LOW) is the largest company to pass four or more screens. Lowe’s may benefit from a shift in consumer spending from travel and live events to the home. As a result of the coronavirus pandemic, the company could see near-term benefits as households invest more in their homes, whether improving the backyard, finishing a basement or remodeling a bathroom. Analysts have increased current earnings estimates by 2.4% over the last month. That explains why the forward price-earnings ratio of 19.3 is below the trailing price-earnings ratio of 21.6.
While you cannot automatically consider a group of consensus stocks to be a diversified portfolio, they may present a good starting point for constructing your personal portfolio. Optimally, the group of screening approaches a stock passes is diverse enough to capture unique, yet desirable qualities.
Today’s Stock All-Stars
All-Star Stocks: Stocks Passing the Most Screens (Ranked by Price as a % of 52-Week High)
| Company | Ticker |
Last Price (6/15) |
52-Wk High- Low |
No. of Screens Passed |
Screens Passed |
Trailing P/E Ratio (X) |
Forward P/E Ratio (X) |
Market Cap ($ Mil) |
|---|---|---|---|---|---|---|---|---|
| Logitech International SA | LOGI | 59.76 | (61.15– 31.37) | 4 | Buffett Hagstrom Screen, Buffettology EPS Growth, Return on Equity Screen, Value on the Move--PEG With Hist Growth Screen | 22.5 | 28.1 | 10,115 |
| PennyMac Financial Services | PFSI | 41.42 | (42.86– 13.14) | 7 | Dreman With Est Revisions Screen, Kirkpatrick Bargain Screen, Kirkpatrick Growth Screen, Lakonishok Screen, O’Shaughnessy Growth Screen II, Oberweis Octagon Screen, P/E Relative Screen | 5.2 | 4.1 | 3,005 |
| Lowe’s Companies Inc. | LOW | 127.73 | (133.39– 60.00) | 4 | Lakonishok Screen, O’Shaughnessy Growth Market Leaders Screen, P/E Relative Screen, Value on the Move--PEG With Est Growth Screen | 21.6 | 19.3 | 95,168 |
| Thor Industries, Inc. | THO | 113.74 | (118.89– 32.30) | 5 | Est Rev Top 30 Up, Est Rev Up 5% Screen, Kirkpatrick Bargain Screen, Lakonishok Screen, O’Shaughnessy Growth Screen II | 32.1 | 34.2 | 5,898 |
| EPAM Systems Inc. | EPAM | 234.55 | (248.27– 151.97) | 5 | Buffettology EPS Growth, Inve$tWare Quality Growth Screen, O’Neil’s CAN SLIM No Float Screen, O’Neil’s CAN SLIM Revised 3rd Edition Screen, Return on Equity Screen | 47.5 | 42.6 | 13,075 |
| BioSpecifics Technologies Corp. | BSTC | 62.58 | (66.51– 42.00) | 4 | Price-to-Sales Screen, Return on Equity Screen, Value on the Move--PEG With Hist Growth Screen, Wanger (Revised) Screen | 18.8 | 30.5 | 449 |
| Sportsman’s Warehouse Holdings | SPWH | 12.66 | (13.84– 3.50) | 4 | Est Rev Top 30 Up, Est Rev Up 5% Screen, O’Shaughnessy Growth Screen II, O’Shaughnessy Small Cap Growth & Value Screen | 22.6 | 15.9 | 489 |
| MarineMax Inc. | HZO | 20.72 | (23.15– 7.25) | 4 | Est Rev Top 30 Up, Est Rev Up 5% Screen, O’Shaughnessy Small Cap Growth & Value Screen, P/E Relative Screen | 11.6 | 17.8 | 437 |
| D. R. Horton Inc. | DHI | 55.88 | (62.54– 25.51) | 5 | Dreman With Est Revisions Screen, Neff Screen, O’Shaughnessy Growth Market Leaders Screen, Templeton Screen, Value on the Move--PEG With Hist Growth Screen | 11.0 | 11.9 | 19,631 |
| Align Technology, Inc. | ALGN | 258.80 | (302.03– 127.88) | 4 | Buffett Hagstrom Screen, Fundamental Rule of Thumb Screen, Muhlenkamp Screen, Return on Equity Screen | 10.9 | 83.5 | 19,801 |
| Mastech Digital Inc. | MHH | 24.33 | (28.85-4.66) | 4 | Buffettology EPS Growth, Buffettology Sustainable Growth Screen, O’Shaughnessy Growth Screen II, O’Shaughnessy Small Cap Growth & Value Screen | 22.8 | 26.6 | 295 |
| Big Lots, Inc. | BIG | 34.77 | (42.33– 10.13) | 6 | Driehaus Revised Screen, Est Rev Top 30 Up, Est Rev Up 5% Screen, Lakonishok Screen, O’Shaughnessy Small Cap Growth & Value Screen, P/E Relative Screen | 4.9 | 8.0 | 1,316 |
| Medifast Inc. | MED | 113.10 | (142.49– 49.03) | 4 | Buffett Hagstrom Screen, Buffettology EPS Growth, Buffettology Sustainable Growth Screen, Return on Equity Screen | 18.0 | 16.2 | 1,270 |
| Reliance Steel & Aluminum Co. | RS | 93.81 | (122.17– 70.57) | 4 | Dividend (High Relative Yield) Screen, Dreman With Est Revisions Screen, Graham--Defensive Investor (Non-Utility) Screen, P/E Relative Screen | 11.1 | 15.9 | 5,928 |
| Evercore Inc. | EVR | 59.77 | (91.59– 33.25) | 6 | Buffettology EPS Growth, Buffettology Sustainable Growth Screen, Dividend (High Relative Yield) Screen, Dreman With Est Revisions Screen, Graham--Defensive Investor (Non-Utility) Screen, P/E Relative Screen | 9.8 | 21.5 | 2,736 |
| Fidelity National Financial Inc. | FNF | 31.77 | (49.28– 19.00) | 4 | Dividend (High Relative Yield) Screen, Dreman With Est Revisions Screen, Est Rev Up 5% Screen, P/E Relative Screen | 11.1 | 11.9 | 9,535 |
| Source: AAII’s Stock Investor Pro, Refinitiv and I/B/E/S. Data as of 6/15/2020. | ||||||||
Discussion
FREE REPORT

No comments have been added yet. Add your thoughts to the discussion!
You need to log in as a registered AAII user before commenting.
Log InCreate an account