


This week, we cover the Kirkpatrick Bargain stock-picking strategy and give you a list of stocks that currently pass the AAII Kirkpatrick Bargain screen based on the approach. The Kirkpatrick Bargain approach is a purely mechanical process that depends on facts instead of predictions to help investors avoid their own biases that ultimately cost them money.
Bargain Hunting With Kirkpatrick
Over the past 20 years, AAII’s Kirkpatrick Bargain screen has an annualized return of 9.1%, which is 1.4 percentage points above the S&P 500’s return of 7.7% over the same period. As of June 30, 2023, the Kirkpatrick Bargain screen is up 23.4% year to date, compared to 16.7% for the S&P 500.
The S&P 500 index has seen a significant rebound so far this year, following the worst total return by the index since the 2008 financial crisis. As of July 25, 2023, the S&P 500 has risen 20.1% year to date and has increased 29.4% since the index’s low on October 12, 2022. With frothy valuations across some sectors and the official start of a new bull market, are there any bargain stocks out there?
Charles Kirkpatrick’s book, “Beat the Market: Invest by Knowing What Stocks to Buy and What Stocks to Sell” (FT Press, 2008), seems to have been written exactly with this scenario in mind. Kirkpatrick believes that the stock market is still the best investment vehicle available, but he also thinks it is impossible to predict the market or the economy.
Kirkpatrick is president of Kirkpatrick & Co. Inc., which specializes in technical research, and he publishes the Kirkpatrick Market Strategist stock advisory newsletter. Kirkpatrick is a former board member of the Chartered Market Technician (CMT) Association, former editor of the Journal of Technical Analysis and former board member of the Technical Analysis Educational Foundation, responsible for the development of courses in technical analysis at major business schools. He is also the only person to win the annual Charles H. Dow Award twice, for excellence in technical research.
Market Behavior and Investor Emotions
After investing for over 45 years, Kirkpatrick came to believe that markets trade on facts, the anticipation of new facts and emotion. As he puts it, the stock market is “the sum of all information known and anticipated, interpretation of that information, and emotional reactions to that information, right or wrong.” However, he points out that individual investors are competing against institutional investors, who are more knowledgeable and better equipped to capture and analyze that information. As a result, Kirkpatrick doesn’t believe it is possible to beat the professionals at their own game. Instead, he advocates for developing a mechanical process that depends on indisputable facts to minimize the effects of emotions.
Kirkpatrick believes that investors face several “biases” that have an adverse impact on their financial success: These include impatience, the fear of being wrong, the need for perfection and a lack of discipline.
Philosophy and Style
Kirkpatrick believes a mechanical approach to investing will help investors avoid their own biases that ultimately cost them money. He further believes that it is impossible to predict market movements. Instead, he follows the setup, trigger and action (STRACT) technique that helps him react to individual stock movements. His methodology is based on “relative” data elements—price-to-sales (P/S) ratio and price strength. His analysis has led him to the bargain investment model. By following his approach, Kirkpatrick feels that individual investors can outperform the market by investing in individual stocks with a minimal time commitment.
Prediction Versus Reaction
Kirkpatrick reiterates his opinion several times in “Beat the Market” that it is not possible to predict markets. Instead, he feels that a more successful alternative to predicting the markets is a strategy of “reaction.”
Reaction, for Kirkpatrick, means waiting for the market to indicate what it is going to do and then (re)acting accordingly. Kirkpatrick reacts when his data—either fundamental or technical—show a pattern that has proven successful in the past. When he sees such a pattern, his reaction follows three steps, which he terms STRACT:
- Setup
- TRigger
- ACTion
To illustrate the STRACT method, Kirkpatrick offers the following example: Say a study shows that when stocks advance to new 52-week highs, their chances of advancing an additional 10% are 70%. Any stock you are following that nears its 52-week high enters the setup stage. However, at this point, no action is taken as you wait for the trigger—in his example, the stock hitting a new 52-week high. Once the trigger is initiated, your action would be to buy the stock.
Meeting the Relatives
Kirkpatrick states that the first investment problems we face are deciding what to buy and how to do so without having to predict anything. The AAII Kirkpatrick Bargain model approach uses two principle methods for selecting stocks:
- Value
- Price strength
Kirkpatrick begins his analysis by collecting data from the immediate past. Value investing requires accurate fundamental data for each stock in his investing universe. His price strength analysis requires a history of prices for each stock; it measures how a stock price behaves against its immediate past—if a stock is high versus its immediate past, it is said to have price strength.
For his analysis, Kirkpatrick looks at “relative” data—data compared to other data. For example, when he is looking at value, he looks not only at the value of an individual company, but also at its value relative to the value of all other companies. He then attempts to maximize his profits by looking only at those companies with the best value.
Value
When looking at a stock’s value, Kirkpatrick uses the price-to-sales ratio, which is the ratio between a stock’s price and the last four quarters of reported sales for the company.
Kirkpatrick’s analysis involved first calculating the weekly price-to-sales ratios for every stock over the period from 1998 to 2006. He then sorted the companies by price-to-sales ratio and ranked them into percentiles, where the companies with the highest price-to-sales ratios were in the highest percentiles. Once the companies were placed in percentiles based on their valuation, he calculated the relative price performance for each percentile for the next three, six and 12 months.
What he discovered was that there was an inverse relationship between the relative price-to-sales ratio percentile and the relative performance three and six months forward. In other words, as the price-to-sales percentile increased, the future performance decreased. For periods of 12 months, the relationship between relative valuation and price performance dissipated. Kirkpatrick took his findings to suggest that investors should not focus on periods longer than one year.
Advancing Versus Declining Markets
Kirkpatrick also wanted to see how his various relative values performed in both advancing and declining markets. As we have learned over the last few months, the direction of the overall market can play an important role in the performance of individual stocks.
He used a very simple methodology to define advancing and declining markets. He begins by adding together the closing values of the S&P 500 for each of the last 12 months and creating an average by dividing the total by 12. At the end of the next month, the oldest monthly value is dropped from the total, the latest monthly close is added and, again, the average value is calculated. When the S&P 500 monthly close is above its 12-month moving average closing price, Kirkpatrick considers the market as advancing; when the monthly close is below the 12-month average closing price, the market is declining.
Returning to his price-to-sales relative analysis, the relationship between the valuation and the future price performance was only about one-third as strong during advancing markets as it was over all market conditions. However, the inverse relationship between valuation and price performance strengthened by about 25% during declining markets. This indicated to Kirkpatrick that relative valuation is a more important selection criterion during a declining market.
Price Strength
Kirkpatrick’s research indicates that relative price strength is the most reliable short-term stock selection technique. There are a number of ways to calculate relative price strength. Some calculations compare the percentage change in stock price over a defined period to the percentage change in a stock index, such as the S&P 500, over the same period. However, these measures do not necessarily protect you in a down market, as a stock can be falling and still have “strong” relative strength if it is not falling as rapidly as the index.
Kirkpatrick is concerned about capital loss, so his relative strength calculation involves dividing the current weekly closing price by the 26-week moving average of closing prices. He adds up the week-ending closing prices for each of the last 26 weeks and divides this total by 26. For each subsequent week, the oldest price is dropped and the latest weekly close is added to calculate the moving average. He then ranks all the stocks so that those with the highest relative strength are in the highest percentile rank.
To attempt to capture the essence of Kirkpatrick’s measure, AAII calculated the ratio of the current stock price to the average of the last six monthly closing prices. The numerator fluctuates with the weekly closing price, but the denominator only changes with the end of each month.
Once again, Kirkpatrick found that there is a very strong positive relationship between relative price strength and forward price performance. As Kirkpatrick writes in his book, “Relative strength seems to breed more relative strength.” However, over time, this relationship gradually deteriorates. Eventually, moving forward 12 months, the relationship between 26-week relative strength and subsequent price performance all but evaporates.
During both advancing and declining markets, Kirkpatrick found that relative price strength should be your primary selection criterion.
Bargain Model
The AAII Kirkpatrick Bargain model uses the best triggers found in his testing of relative value and relative price strength.
Price-to-Sales Ratio
Kirkpatrick’s testing of relative price-to-sales ratio percentile rankings indicated optimal performance in percentiles greater than the 17th percentile but not higher than the 42nd percentile. Relative valuations outside this range tended to underperform the market. Therefore, for the AAII Kirkpatrick Bargain screen, companies are required to have a price-to-sales percent rank that is greater than or equal to 17 and less than or equal to 42.
Relative Price Strength
The AAII Kirkpatrick Bargain approach selects stocks with relative price strength in the 90th percentile or higher.
Price and Market Cap
Lastly, AAII’s Kirkpatrick Bargain strategy seeks companies with market capitalizations of at least $1 billion and share prices of at least $10.
Conclusion
Kirkpatrick takes an extremely mechanical approach to selecting stocks. To him, stocks are merely symbols. He does not concern himself with what the company does. He merely allows his data analysis to dictate when to buy and sell stocks. By basing his selection process on relative variables that have tested very well over an extended period of time, Kirkpatrick believes he has found a strategy to identify bargain stocks that will perform well in both bull and bear markets and will alert you to sell in time to avoid large capital losses.
Stocks Passing the Kirkpatrick Bargain Model Screen (Ranked by Relative Price Strength)
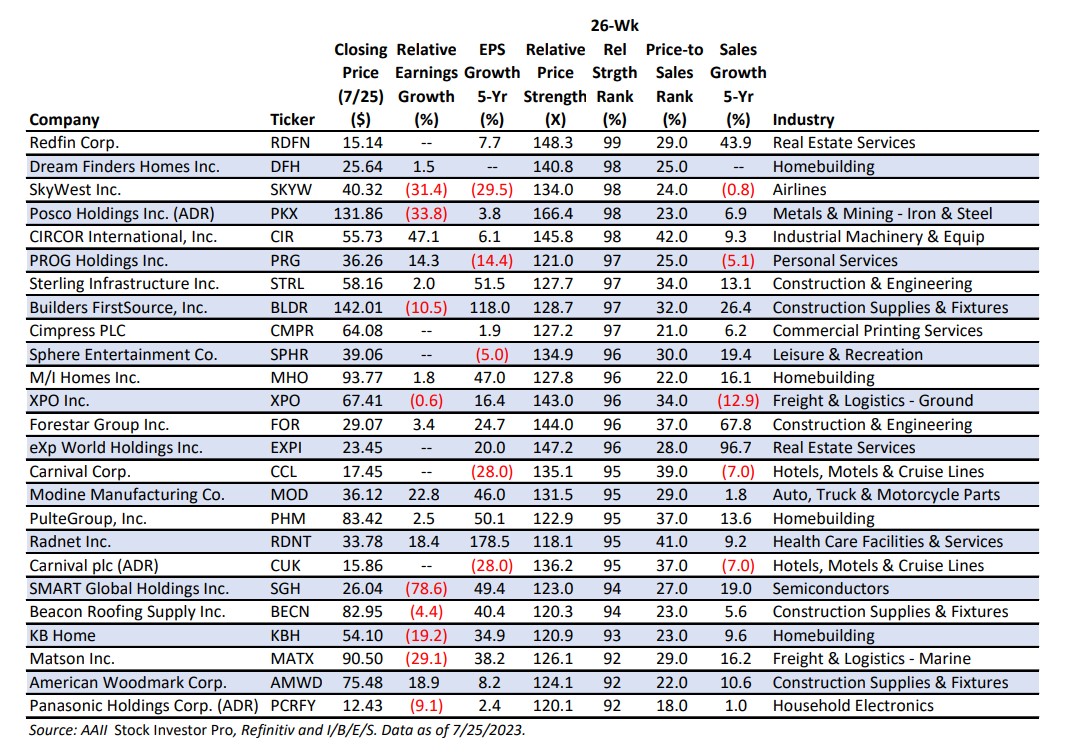
Keep in mind that no matter how well a stock screening methodology has performed (or how badly it has underperformed) over the long term, stock screening is only the first step in the stock selection process. You will want to do your homework to see why these companies are at their current levels. Only then will you gain insight into those that will continue to languish and those that may eventually flourish.
The stocks meeting the criteria of the approach do not represent a “recommended” or “buy” list. It is important to perform due diligence to verify the financial strength of the passing companies and to identify those stocks that match your investing tolerances and constraints before committing your investment dollars. Keep in mind that the quantitative screens AAII has developed are based upon our interpretations of published works tied to the market gurus.
Discussion
FREE REPORT

Greg F from AR posted over 3 years ago:
Don P from USA posted over 3 years ago:
JONDAVID P from WV posted over 3 years ago:
Stephen C from NJ posted over 3 years ago:
You need to log in as a registered AAII user before commenting.
Log InCreate an account