


John Bajkowski
is the president of AAII.
Investors have identified certain factors or characteristics that help explain stock performance while also being tied to returns greater than the market. Given time, these factors have achieved their above-average returns because of the risks associated with owning securities that exhibit these characteristics. The Model Shadow Stock Portfolio was developed using the findings presented by Eugene Fama and Kenneth French in their 1992 paper, “The Cross-Section of Expected Stock Returns,” published in the Journal of Finance. The paper focused on the beta, size and value factors. The number of factors used by investors have increased over time to typically include beta, size, value, momentum, quality, profitability, volatility and yield.
Larry Swedroe, head of financial and economic research at Buckingham Strategic Wealth, argues that in addition to providing incremental explanatory power to portfolio returns and having delivered a return premium, a factor must have five qualities.
As noted in Swedroe’s April 2017 AAII Journal article, “Factors Allow Investors to Think Differently About Diversification,” investors should be prepared to experience some periods of underperformance when using factors to tilt portfolios. The longer your time horizon, the lower the odds of underperformance, but the risk of underperformance can be reduced by combining factors.
The Model Shadow Stock Portfolio applies value, profitability, sector and liquidity filters to a micro-cap stock universe. This is done so there is greater potential to find mispriced gems among these less analyzed and tracked companies. There is strong evidence that small stocks have provided greater returns for the individual investor who has a long-term horizon and is willing to put up with greater volatility.
There are many ways to measure company size—revenue, assets, employee count, market capitalization, enterprise value, etc. Most studies of relative performance by size, however, focus on market cap. Market cap is simply calculated by multiplying the number of shares a company has issued by the share price. It represents the market’s consensus of a company’s value. The largest companies have a market cap of over $2 trillion, while smaller companies have a market cap of $1 billion or less.
The most common use of market cap is to simply arrange the companies from smallest to largest and segment them into bands of equal size—typically bands holding 10% (deciles) of the companies. These decile breakpoints are determined by examining domestic companies listed on the New York Stock Exchange (NYSE) and then applying the size and value breakpoints for stocks listed on all domestic exchanges.
The table below lists the historical performance of the decile groups along with some of their characteristics, updated with data through year-end 2023.
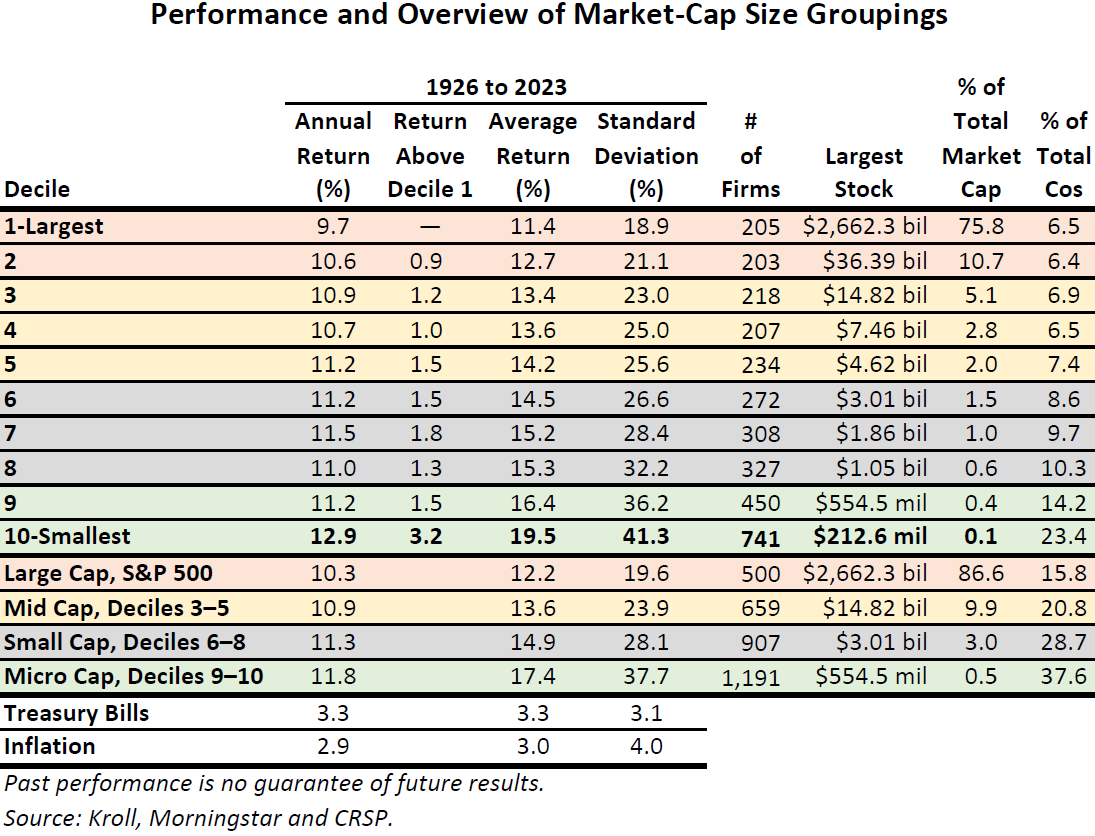
It might be helpful to review some of the data elements in the table. The annual return is the compound annual return (geometric return) that was realized over this time period. It assumes that you are reinvesting any gains or income. The “Return Above Decile 1” column relates the compound return for a given decile group against the largest decile group (first group). Generally, the smaller the decile group, the greater the compound annual return.
The average return is the average (mean) of the individual annual returns. It is higher than the compound annual return because simply averaging the annual returns does not correctly take into account the impact of losing money in a given year. For example, if you are down 50% one year and then up 50% the next year, the simple average is 0.0%. But you are still down 25% from your original starting point. The compound annual return over that two-year period is –13.4%. To get to your starting point after a 50% decline one year, you would need a 100% increase the next year. The average return is in the table to help with calculations involving the standard deviation.
The standard deviation shows the level of dispersion in relationship to the mean or simple average return. The larger the standard deviation, the greater the highs and lows. We see that as the decile bands go from the largest size group to the smallest, the standard deviation or volatility increases.
The number of companies in each decile varies by group because the market-cap decile bands are decided among the companies listed on the NYSE. Those market-cap breakpoints are then used to determine where to place companies listed on the American Stock Exchange (AMEX) and the Nasdaq Stock Exchange. A number of larger Nasdaq-listed companies make it into higher decile groupings, but the numbers show that as you add in the other exchanges you are in turn adding more small companies.
The “Largest Stock” column notes the market cap of largest company within a given segment. With the significant market decline last year, we saw the market cap of the largest stock decline for most of the groups. For example, the market cap for the largest company in ninth decile was $554.5 million at the end of 2023, up from $373.9 million at the end of 2022.
The percent of total market cap data sums up the market cap of all the stocks in a given decile and relates that market cap to the sum of the market caps of all the companies at the end of year. In contrast, the percent of total companies data shows the number of companies in a given decile group and relates that to the total number of companies. You can see the concentration of money invested in the largest company even though that represents only a small segment of the public companies in the U.S.
As shown in the table above, between 1926 and the end of 2023, the smallest companies (10th decile) have, on average, generated an annual return of 12.9% over that period. By comparison, the companies in the S&P 500 index—the 500 largest companies traded on U.S. exchanges based on market cap—generated an average annual return of 10.3% over the same period. So, if you invested $100 in these 10th-decile stocks at the beginning of 1926, your investment would have grown to $14,377,143 at the end of 2023, compared to only $1,146,108 if you had invested the same $100 in the S&P 500 over that period.
The investment community today uses the term small cap to describe companies with market cap up to $3 billion. The Russell 2000 index—considered by many to be a comprehensive index of small-cap stocks—has a dollar-weighted market cap of $4.266 billion, although its median, or midpoint, market cap is $879 million. However, as of the end of April, the index’s largest constituent had a market cap of $49.684 billion, definitely not what most would consider a small-cap stock. The Russell 2000 has a few micro-cap companies that experienced massive price gains over the last year. Super Micro Computer Inc. (SCMI) is the largest company in the Russell 2000 and is up over 946% from end of 2022 through April 30, 2024. Next is MicroStrategy Inc.  (MSTR), which is up 652% over the same period.
The S&P SmallCap 600 index, another popular small-cap index, had an average market cap of $2.023 billion as of the end of April, and a median market cap of $1.745 billion. The range of market caps for its constituents was $289 million to $7.644 billion.
However, the original research on small-cap stocks was done on the smallest 20% of stocks ranked by market cap on the NYSE. Subsequent research continued to use NYSE stocks to determine market-cap ranges but did not require that stocks be traded on the NYSE. That lowest 20% (ninth and 10th deciles) is still the market-cap range used by academic researchers today when examining the “small-cap effect.” At current market valuations, this would include stocks with market caps of up to only $554.5 million, too small for many mutual funds to invest in.
As a result of this divergence between the academic and real-world definitions of the term small cap, stocks in the smallest range today are termed micro caps.
As the table shows, though, the impact of investing in the small-cap segment versus the micro-cap segment isn’t merely a matter of semantics. Between 1926 and the end of 2023, investing in small-cap stocks—those in the sixth, seventh and eighth deciles—generated an average annual return of 11.3%. Investing in only stocks in the 10th decile—the smallest 10% of stocks—generated an average annual return of 12.9%. That difference resulted in over $10.84 million more wealth over the period on a $100 investment.

As we often note, the relative performance of small-cap stocks to large-cap stocks runs in streaks. Small-company stocks have outperformed large-company stocks over the long term, but they certainly do not best large-cap stocks every year, and they tend to exhibit flashes of outperformance followed by periods of underperformance. The other cost you pay for the potential of higher returns is greater volatility. Just as the observed historical returns of stock decile groupings went up as the companies got smaller, so did their standard deviation. To succeed with smaller companies, you must be willing to put up with greater declines and longer streaks of underperformance.
Concerns over persistent inflation coupled with high interest rates hurt investor sentiment in April. The Model Shadow Stock Portfolio was down 2.6% during April, compared to a 4.1% loss for the S&P 500, a 6.0% loss for the S&P MidCap 400 index and a 5.6% loss for the S&P SmallCap 600. Market breadth was weak during the month. The number of declining issues outpaced the number of advancing issues by factor of 3.3 to 1.0 within the S&P 500 and 5.0 to 1.0 within the S&P SmallCap 600.
In the large-cap segment, value stocks were down 4.3% for the month while growth stocks were down 3.9%. Over the last year, large-cap value stocks are up 18.1%, compared to a return of 26.7% for large-cap growth stocks.
During April, mid-cap value stocks lost 6.1% and mid-cap growth stocks were down 6.0%. Mid-cap value stocks are up 11.3% over the last year, while mid-cap growth stocks are up 22.1%.
Small-cap value stocks lost 6.5% during April and small-cap growth stocks lost 4.7%. Small-cap value stocks are up 7.0% over the last year, while small-cap growth stocks are up 18.1%.
The utilities sector was the only sector up during the month within the S&P 500, while real estate was the weakest sector, down 8.6% during April. In the mid-cap segment, utilities were up 2.4% during the month, while consumer discretionary stocks gave up 9.6%. Utilities squeaked out a 0.2% gain in the S&P SmallCap 600, while consumer discretionary stocks lost 7.8% during April. These price movements reflect a flight to the safety and general economic stability of utilities.
The Model Shadow Stock Portfolio lost 2.6% for the month and is up 7.7% over the last year. The Vanguard Small Cap Index fund (NAESX) lost 6.5% during April and is up 15.7% over the last year.
Since its inception in 1993, the AAII Model Shadow Stock Portfolio has a compound annual average return of 13.5%, versus the Vanguard 500 Index fund’s (VFINX) gain of 10.1% per year on average over the same period. Over the same period, the Vanguard Small Cap Index fund posted an average annual gain of 9.7%.
While the market was weak during April, it bounced back in early May, contributing to a reduction in the number of stocks passing the initial Shadow Stock screen this month. Only 15 stocks met the initial selection criteria for the Model Shadow Stock Portfolio as of May 10, 2024, down from 21 passing stocks last month. AAII members can see and research which companies are currently passing the initial selection criteria in the Shadow Stock Ideas table on AAII.com. The list of new Shadow Stock Ideas is updated daily—Tuesday through Saturday.
Of the 15 qualifying companies as of May 10, five are currently held in the Model Shadow Stock tracking portfolio: Fonar Corp. (FONR), Hooker Furnishings Corp. (HOFT), Key Tronic Corp. (KTCC), Saga Communications Inc. (SGA) and StealthGas Inc. (GASS).
Qualifying companies are those held in the Model Shadow Stock Portfolio that currently meet the initial addition rules. They are designated as “currently qualifies” in the notes column of the Model Shadow Stock Portfolio table on AAII.com. However, if you go online, the notes may not match the list discussed here since the notes on the website table are dynamically updated daily.
Amplify Energy Corp. (AMPY) reported negative quarterly earnings, moving it off the list of qualifying companies. Rocky Brands Inc.’s (RCKY) price-to-book ratio increased from 0.88 to 1.14 over the last month, which removed it from the list of qualifying companies.
The Model Shadow Stock Portfolio looks for stocks with a market cap (share price times shares outstanding) less than $300 million. Shadow stocks with a market cap three times the initial market cap maximum—$900 million ($300 million × 3)—at the time of a quarterly review are removed from the model portfolio, assuming there is a suitable replacement. As of May 10, Global Ship Lease Inc. (GSL) had the highest market cap of $838.1 million and Ducommun Inc. (DCO) had the second-highest market cap of $837.1 million. Both are still below the $900 million size threshold for removing a stock.
As of May 10, there were three stocks clustered with elevated price-to-book ratios. Ennis Inc. (EBF) had a ratio of 1.53; Covenant Logistics Group Inc. (CVLG) had a ratio of 1.51 and Mistras Group Inc. (MG) had a ratio of 1.50. These ratios are above the 0.90 maximum value used for initially qualifying a stock for inclusion in the portfolio. However, stocks are not removed from the portfolio until their price-to-book ratio rises to three times the initial maximum value, 2.70 (0.90 × 3).
Click here to see the current addition and deletion rules for the portfolio.
The next quarterly review of the AAII Model Shadow Stock Portfolio will take place around the beginning of June 2024, after most of the holdings have announced their quarterly earnings. Any changes to the portfolio will be announced at the time they are made in a special Model Shadow Stock Portfolio Update email (sign up at www.aaii.com/email).
Ampco-Pittsburgh Corporation (AP)
(05/14/2024)
Ampco-Pittsburgh reported first-quarter 2024 earnings per share of $0.14. Total revenue increased 5.2% from the prior-year quarter to $110.2 million. This increase is attributable to sales growth in the air and liquid processing segment. However, income from operations was reported as $0.1 million compared to $2.0 million the prior-year quarter. A major driver of the change was higher repair expense and the impact of plant downtime caused by fire damage at a foreign cast roll facility.
(05/08/2024)
Amplify Energy announced first-quarter 2024 total revenue of $76.3 million, down 4.5% from one year ago. The company reported a net loss for the quarter of $9.4 million. This translates into a loss of $0.24 per share, down 122% from one year ago, missing the LSEG I/B/E/S consensus estimate of $0.185 per share by 207.6%.
Big 5 Sporting Goods Corporation (BGFV)
(04/30/2024)
Big 5 Sporting Goods reported a first-quarter 2024 loss of $0.38 per share on a GAAP basis. Total revenue decreased 14.0% from the prior-year quarter to $193.43 million. The company reported an operating loss of $10.9 million, versus a loss of $29,000 in the first quarter of 2023. The company reported a net loss of $8.3 million, down from net income of $193,000 in the prior-year quarter.
For second-quarter 2024, Big 5 Sporting Goods expects same-store sales to decrease in the high-single-digit range compared to the prior-year quarter. This guidance reflects an expectation that macroeconomic headwinds will continue to impact discretionary consumer spending. A net loss per basic share is expected in the range of $0.40 to $0.55, which compares to a net loss per basic share of $0.01 in the comparable quarter last year.
(05/02/2024)
Clarus reported first-quarter 2024 total revenue of $69.3 million, which decreased 1.4% from the prior-year quarter. Net income including the impact of discontinued operations was $21.9 million, or $0.57 per diluted share. This compares to net income of $1.6 million, or $0.04 per diluted share, reported in the first quarter of 2023. The loss from continuing operations of $6.5 million, or a loss of $0.17 per diluted share, compared to a loss from continuing operations of $2.0 million, or a loss of $0.05 per diluted share, in the prior-year quarter.
Clarus continues to expect full-year 2024 sales in the range of $270 million and $280 million. In addition, capital expenditures (capex) are expected to range between $4 million to $5 million and free cash flow is expected to range between $18 million and $20 million.
Core Molding Technologies, Inc. (CMT)
(05/07/2024)
Core Molding Technologies reported first-quarter 2024 non-GAAP earnings per share of $0.43, beating the LSEG I/B/E/S consensus estimate of $0.26 per share by 65.4%. Total revenue decreased 21.5% from the prior-year quarter to $78.15 million. Net income was $3.8 million, compared to $5.9 million during the prior-year quarter.
Despite challenges such as product mix shifts and operational deleveraging, the company managed to maintain its gross margins at 17.0% in the first quarter by implementing cost reduction strategies in response to predicted sales decreases. Additionally, it generated over $3 million in free cash flow, marking an improvement from the prior-year quarter.
Looking forward, Core Molding Technologies is forecasting a 10% to 15% decline in sales for full-year 2024 compared to 2023, with more significant reductions expected in the first half of the year than in the second half. However, management believes the company is operationally well-prepared to adjust to changing demand levels and remains financially robust. As of March 31, 2024, Core Molding Technologies had significant available liquidity to pursue growth opportunities.
Covenant Logistics Group, Inc. (CVLG)
(04/26/2024)
Covenant Logistics Group reported first-quarter 2024 GAAP earnings per share of $0.84, beating the LSEG I/B/E/S consensus estimate of $0.78 per share. Total revenue increased 4.5% from the prior-year quarter to $278.8 million. Net income for the quarter totaled $3.9 million, down 76.1% from $16.6 million reported in the first quarter of 2023.
According to chairman and CEO David R. Parker, the team navigated the market environment effectively by seizing available opportunities, directing equipment investments toward more profitable ventures and managing costs.
(05/08/2024)
Ducommun reported first-quarter 2024 non-GAAP earnings per share of $0.70, beating the LSEG I/B/E/S consensus estimate of $0.57 per share by 22.8%. Total revenue increased 5.3% from the prior-year quarter to $190.8 million. Net income was $6.8 million, 3.6% of the quarter’s revenue.
According to CEO Stephen G. Oswald, Ducommun’s first-quarter growth in its top line was primarily driven by robust performance in the commercial aerospace sector, involving major clients like Boeing and Airbus. Oswald expressed optimism about the progress of Ducommun’s Vision 2027 Plan, now in its second year. Following a successful 2023 with record revenues, the company sustained momentum. The company not only achieved record revenue but also its highest ever gross margin.
(04/16/2024)
Ducommun rejected an unsolicited takeover bid from private investment firm Albion River LLC, which proposed buying the company at $60 per share, a 17% premium over its last closing price on March 28. The board unanimously decided against pursuing discussions with Albion River, believing that its ongoing vision offers better long-term value to shareholders. This strategy anticipates that Ducommun will achieve net revenues of $950 million to $1 billion by 2027, an increase of 33% to 40% from 2022. The board feels that Albion River’s offer significantly undervalues the company and could detract from its strategic goals.
(04/22/2024)
Ennis reported fourth-quarter 2023 GAAP earnings per share of $0.39, compared to $0.47 per diluted share in the prior-year quarter. Total revenue decreased 5.1% from the prior-year quarter to $2.97 million. Gross profits totaled $27.7 million, or 28.4%, compared to $28.3 million, or 27.6%, in the prior-year quarter. Net earnings were $10.1 million.
(04/25/2024)
Escalade reported first-quarter 2024 GAAP earnings per share of $0.13, up year over year from a loss of $0.13 per share in the prior-year quarter. Total revenue was $57.3 million, up 0.7% year over year. Operating income increased dramatically to $3.0 million for the quarter versus the $149,000 in the prior-year quarter. Net income totaled $1.8 million versus a net loss of $952,000 one year ago.
CEO Walter Glazer Jr. stated, “Looking to the remainder of 2024, we intend to continue deploying available cash flow to debt repayment, which should result in additional interest expense savings, while continuing to invest in our brands and new product development within our strong recreational products portfolio.”
(05/07/2024)
Key Tronic reported total revenue of $140.5 million for the fiscal third quarter of 2024 ending March 30, compared to $164.6 million in the same period of fiscal-year 2023. Revenue was constrained by $5 million due to severe winter weather events that took Key Tronic’s facilities in Mississippi and Arkansas offline for two weeks. In addition, the company experienced softening demand for a number of different programs produced in Mexico. Margins and profitability were significantly impacted by severance costs of $3.7 million, or $0.27 per diluted share, as Key Tronic reduced its workforce by over 450 employees in Mexico. The severance costs were incurred late in the quarter, which limited the previously planned payroll expense reductions. The company reported a net loss of $2.2 million or $0.21 per share, compared to net income of $2.0 million or $0.18 per share for the same period of fiscal-year 2023.
Looking forward, Key Tronic expects revenue in the range of $135 million to $145 million and earnings in the range $0.03 to $0.10 per diluted share for its fiscal fourth quarter ending June 30.
(04/25/2024)
Key Tronic reported preliminary results for third-quarter 2024. It anticipates revenue of $140 million, in line with expectations, but expects a net loss of approximately $0.18 to $0.23 per share, falling below expectations. The lower-than-expected earnings primarily stem from severance costs of about $3.7 million, or $0.27 per diluted share, as the company downsized its workforce by more than 450 employees in Mexico. These severance costs were incurred late in the third quarter, limiting previously planned payroll expense reductions. The reduction in the workforce reflects softening demand for various programs with high labor content and is forecasted to save over $10 million annually.
For the fourth quarter of 2024, the company anticipates revenue in the range of $135 million to $145 million and earnings in the range of $0.00 to $0.10 per diluted share.
Kimball Electronics, Inc. (KE)
(05/07/2024)
Kimball Electronics recorded total revenues of $425.0 million for its fiscal third quarter of 2024 ended March 31, down 12.3% from one year ago. The company reported a net loss of $6.1 million, a decrease of 137% from the prior-year quarter. This translates into a loss of $0.24 per share, which marks a 136% decrease from one year ago. The loss includes the impairment of the automation, test & measurement business and restructuring expense. Excluding these items, adjusted net income totaled $8.4 million. Adjusted operating income was $17.0 million, or 4.0% of net sales. Earnings of $0.34 per diluted share missed the LSEG I/B/E/S consensus estimate of $0.402 per share by 15.4%.
Looking forward, the company reaffirmed its forecast for adjusted operating income as a percentage of net sales between 4.2% and 4.6% for fiscal-year 2024 ending June 30. Reflecting current economic conditions, the company now anticipates a decline in net sales of 4% to 6%, a revision from its earlier projection of a 2% to 4% decrease. Additionally, capital expenditures (capex) for fiscal-year 2024 are now projected to be between $55 million and $60 million, down from the previously forecast range of $70 million to $80 million.
Lakeland Industries, Inc. (LAKE)
(05/01/2024)
Lakeland Industries announced a strategic partnership with LineDrive. Based in Chicago, Illinois, LineDrive is a top outsourced sales and marketing firm specializing in industrial maintenance, repair and operations. This collaboration represents a significant milestone for the industrial sector, focusing on enhancing the distribution and availability of Lakeland Industries’ advanced industrial, chemical and property, plant and equipment (PPE) products across the U.S. and Canada through LineDrive’s extensive network.
(05/01/2024)
Mistras Group reported first-quarter 2024 financial results. The company recorded its highest first-quarter revenue since 2018, with total revenues of $184.4 million, up 9.8% from the prior-year period. Net income was $1.0 million, a significant improvement from a net loss of $5.0 million in the prior-year quarter. Non-GAAP net income was $16.2 million, an increase of 55.1% from $10.4 million in the prior-year quarter. GAAP diluted earnings per share were $0.03, recovering from a loss of $0.17 per share in the prior-year quarter. Non-GAAP diluted earnings per share were $0.07, reflecting an improvement from a non-GAAP loss of $0.12 per share in the same quarter of 2023. This beat the LSEG I/B/E/S consensus estimate of $0.037 per share by 89.2%.
Mistras Group reiterated its financial outlook for full-year 2024. Revenue is projected to be between $725 million and $750 million. Adjusted earnings before interest, taxes, depreciation and amortization (EBITDA) is expected in the range of $84 million to $89 million. Free cash flow is anticipated to be between $34 million and $38 million.
(05/01/2024)
NACCO Industries reported first-quarter 2024 total revenues of $15.5 million, down from $20.7 million in the same period last year. Net income was $4.57 million, a decrease of 19.7% from the prior-year quarter, resulting in GAAP diluted earnings per share of $0.61, also down 19.7% over the prior-year quarter. Non-GAAP EBITDA was $11.25 million, an increase of 4.4% from the first quarter of 2023. The company’s performance reflects significant operating profit gains, primarily due to improved earnings in the minerals management and North American mining segments.
Pangaea Logistics Solutions Ltd. (PANL)
(05/09/2024)
Pangaea Logistics Solutions announced first-quarter 2024 total revenues of $104.7 million, down 7.9% from one year ago. Net income was $11.7 million, an increase of 236% year over year. Earnings were $0.25 per share, up 212% from one year ago, beating the LSEG I/B/E/S consensus estimate of $0.135 per share by 85.2%.
Park-Ohio Holdings Corp. (PKOH)
(04/29/2024)
Park Ohio Holdings reported first-quarter 2024 total revenues of $417.6 million, down slightly from $423.5 million in the same quarter of 2023. Net income from continuing operations was $10.6 million, reflecting an increase of 41.3% from $7.5 million year over year. GAAP diluted earnings per share from continuing operations rose 36% to $0.83, up from $0.61 per share one year ago. Non-GAAP net income from continuing operations was slightly higher at $0.85 per diluted share, up 18% from $0.72 per diluted share in the prior-year quarter. Non-GAAP earnings beat the LSEG I/B/E/S consensus estimate of $0.79 per share by 7.6%. The company noted strong performance, particularly in its supply technologies segment, which drove a record operating profit and benefited from ongoing profit-improvement actions, including product pricing.
(04/30/2024)
Rocky Brands reported first-quarter 2024 total revenues of $112.9 million, up 2.2% from the prior-year quarter. Net income was $2.6 million, a significant improvement from a net loss of $0.4 million in the prior-year quarter. Non-GAAP net income was $3.1 million, compared to a net loss of $0.8 million in the prior-year quarter. GAAP diluted earnings per share were $0.34, compared to a loss of $0.05 per share in the prior-year quarter. Non-GAAP diluted earnings per share were $0.41, a considerable increase from a loss of $0.12 per share in the prior-year quarter. Non-GAAP earnings beat the LSEG I/B/E/S consensus estimate of $0.020 per share by 1,950%.
(04/29/2024)
Rocky Brands entered into a definitive debt refinancing agreement, with Bank of America acting as the agent. The new agreement revises and replaces its existing revolving credit facility. The updated asset-based lending facility consists of a $175 million revolving credit facility and a $50 million term facility. The refinancing proceeds were utilized to pay off the company’s prior senior secured term loan, which was managed by TCW Asset Management Co., as of April 26, 2024. Rocky Brands stated that these combined transactions would extend its debt maturities from March 2026 to April 2029.
Vishay Precision Group, Inc. (VPG)
(05/07/2024)
Vishay Precision Group reported total revenues of $80.8 million for first-quarter 2024, down 9.1% from one year ago. Net income was $5.7 million, a decrease of 19% from the previous year. Earnings of $0.42 per share were down 19% year over year but beat the LSEG I/B/E/S consensus estimate of $0.354 per share by 18.6%.
 Get updates about the portfolio that has outperformed the market by 211.9%
since inception!
Get updates about the portfolio that has outperformed the market by 211.9%
since inception!