


Related

Portfolio Strategies
Tilting a portfolio to a small number of factors, including value and size, can increase returns while at the same time reducing risk.
by Larry Swedroe | April 2017

When I joined Buckingham Strategic Wealth more than 20 years ago, it was an exciting time in the world of finance and investment management.
The 1992 Journal of Finance publication of Eugene Fama and Kenneth French’s seminal paper, “The Cross-Section of Expected Stock Returns,” had changed the way we thought about the diversification of portfolios. Prior to then, investors had lived in a single-factor world, with market beta as the sole equity factor. Market beta measures the sensitivity of the equity risk of a stock, mutual fund or portfolio relative to the risk of the overall market.
With the introduction of the Fama-French three-factor model, finance moved into a multi-factor world, one populated by what Fama and French called “risk factors.” A factor is a characteristic or set of characteristics common across a broad set of securities that both explains performance and provides a premium (or above-market return). Factors deliver above-market returns because investors demand an ex-ante premium for accepting the higher risks associated with such securities. And with that change, we went from focusing solely on diversifying the risk of market beta (which could be accomplished by owning just two funds, a total U.S. market fund and a total international fund, and then adding the right amount of safe bonds) to a new focus on asset classes: large cap and small cap, value and growth. While this new world was more complicated, it also provided greater opportunity to add value through portfolio design.
However, financial innovation didn’t end there, and investing has become even more complex. Today, the literature contains more than 600 factors, a number so great that Professor John Cochrane famously said in his 2011 presidential address to the American Finance Association that academics and practitioners had created a factor “zoo.” The good news is that within this expansive and wide-ranging zoo, investors require only a small number of factors to explain almost all the differences in returns between diversified portfolios.
In my recently published book, “Your Complete Guide to Factor-Based Investing” (BAM Alliance Press, 2016), my co-author, Andrew Berkin, and I established the following criteria for a factor to be considered worthy of investment. In addition to providing incremental explanatory power to portfolio returns and having delivered a return premium, it must be:
The factors that meet these criteria are market beta (the average annual return on the overall stock market minus the average annual return on one-month Treasury bills), size (the annual average return of small-cap stocks minus the annual average return of large-cap stocks), value (the annual average return of value stocks minus the annual average return of growth stocks), momentum (the average return of stocks that have done well recently minus the average return of stocks that have recently done poorly), profitability (the average return of the most profitable companies minus the average return of the least profitable companies), and the related but somewhat broader quality factor (the average return of high-quality companies minus the average return of low-quality companies).
For investors not familiar with the quality factor, quality stocks have the following characteristics: low earnings volatility, high margins, high asset turnover, low financial leverage, low operating leverage and low specific-stock risk.
Two additional factors, carry (the return realized, net of financing, if an asset’s price remains unchanged) and term (the average annual return of long-term—20-year—U.S. government securities minus the average annual return of one-month Treasury bills), also meet the criteria for investment, but this article focuses on the first six factors listed and approaches the discussion of them from an equity perspective.
It’s clear the “discovery” and subsequent vetting of these factors has given us a new way to think about diversification. Rather than view a portfolio as a collection of asset classes, investors can view it as a collection of diversifying factors. But before we dive into what this brave new world of factor-based investing looks like, it’s important to keep in mind the basic fact that all factors are long/short portfolios (e.g., the value factor buys the cheapest stocks and shorts the most expensive).
That being said, and to shed greater light on how factor-based investing works in a portfolio, let’s return to the total stock market fund mentioned previously. Because market beta is the measure of the risk of a portfolio relative to the risk of the stock market, a total stock market (TSM) fund has by definition an exposure to beta of 1.0. However, while a TSM fund has about a 10% allocation to small-cap stocks, it has no exposure at all to the size factor.
This seeming contradiction confuses many investors. Think about it this way: While the small stocks in a TSM fund do provide positive exposure to the size factor, its large-cap stocks provide an exactly offsetting amount of negative exposure. That puts net exposure to the size factor at zero. Similarly, while roughly 30% of the holdings of a TSM fund are value stocks, providing positive exposure to the value factor, growth stocks in such funds provide an exactly offsetting amount of negative exposure, resulting in a net exposure to the value factor of zero.
Thus, a TSM fund has the following factor exposures: beta, 1.0; size, zero; and value, zero. Along these same lines, a TSM fund would have zero exposure to the other factors that meet the criteria for investment and are used in multi-factor models: momentum, profitability and quality.
To diversify a portfolio across the size and value factors, investors must “tilt” it so that the portfolio owns more than the market’s share of small and value stocks. Because these factors have provided factor premiums and have had low correlations to each other, the diversification benefit of tilted portfolios has historically produced higher Sharpe ratios (a measure of risk-adjusted returns and thus of portfolio efficiency), meaning they tend to earn higher returns while experiencing similar volatility.
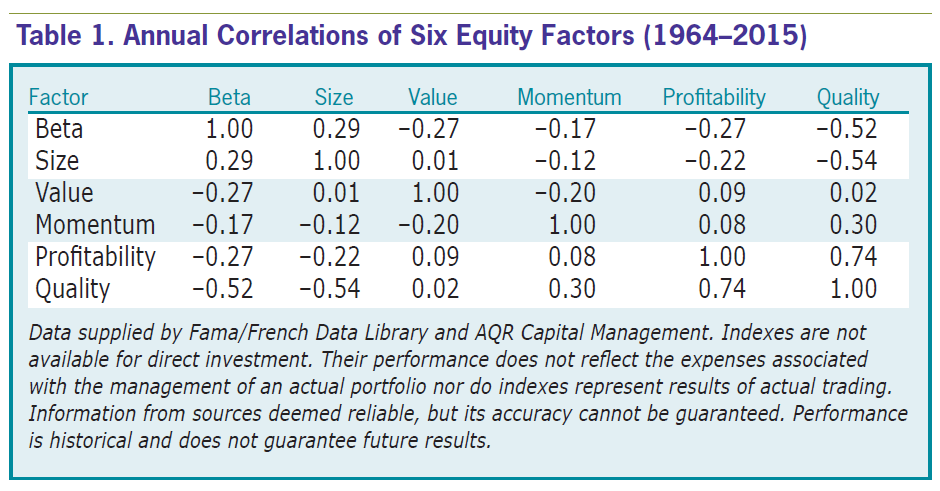
Table 1 shows the annual correlations of the six equity factors under analysis to each other, in the United States for the period from 1964 through 2015. With the sole exception of the high correlation between the related profitability and quality factors, the correlations are low to negative. Notice in particular the negative correlations of the momentum premium to the beta, size and value premiums. This demonstrates the diversification benefit of adding momentum factor exposure to a portfolio that also has exposure to those other factors.
Investors can use this knowledge about premiums and their correlations to build more efficient portfolios that historically have shown reduced downside risk. This is accomplished by lowering the portfolio’s exposure to market beta while at the same time increasing its exposure to other factors. As a result, the portfolio requires less exposure to market beta to achieve the same expected return because the equities it does hold have a higher expected return than the total market portfolio. It has now become more diversified in terms of its factors exposure. What’s more, because the portfolio can hold more safe bonds without sacrificing return, its exposure to the term factor (meaning its sensitivity to interest rate fluctuations) went up, further diversifying it.
In addition, because stocks are so much more volatile than bonds, a typical 60% stock/40% bond (60/40) portfolio that invests in total market funds has about 86% of its risk in the single factor of market beta. By tilting the portfolio to other equity factors that have provided premiums and meet the criteria for investment (thereby lowering its exposure to market beta), investors can reduce the portfolio’s concentration of risk in beta while spreading it among other factors. That will create more of what is referred to as a risk-parity portfolio (a portfolio that has more equal allocations to each factor).
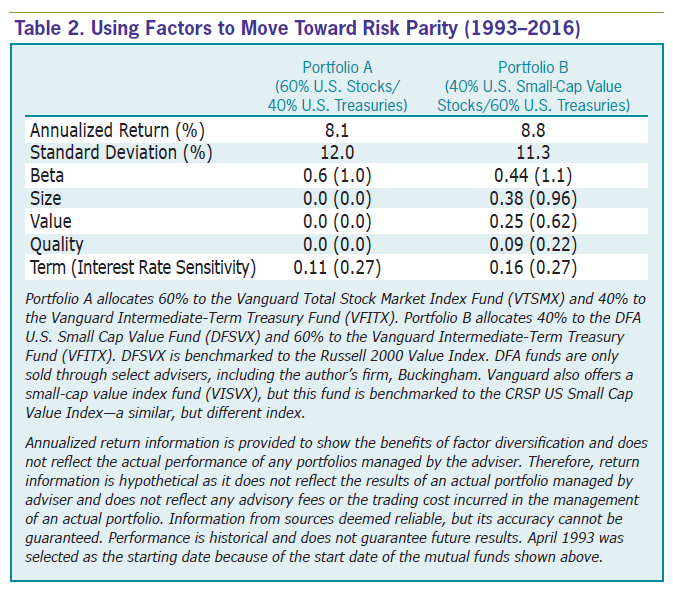
To demonstrate this point, consider two portfolios. Portfolio A is the typical 60/40 portfolio. It consists of just two funds, the Vanguard Total (U.S.) Stock Market Index fund  (VTSMX) and the Vanguard Intermediate-Term Treasury fund (VFITX). Portfolio B is a 40/60 portfolio that also uses just two funds, the DFA U.S. Small Cap Value Fund (DFSVX) for its equity portion and the same bond fund, VFITX, for its fixed income portion. (My firm, Buckingham, recommends DFA funds in constructing client portfolios. See Table 2 for more information about the DFA fund.) The period covered is from DFSVX’s inception date in April 1993 through March 2016 (thus permitting annual rebalancing).
Table 2 shows the annualized returns, standard deviation and exposure (loadings) the two portfolios have to each factor. The figures in parentheses represent each mutual fund’s factor loading (using the regression tool available at Portfolio Visualizer (www.portfoliovisualizer.com) and the Fama-French research factors). To calculate the portfolio’s factor loading, multiply the fund’s loading by the allocation percentage. For example, Portfolio B’s allocation to DFSVX is 40% and the fund’s loading on market beta was 1.1. Thus, the portfolio’s loading on market beta was 0.44 (1.1 (DFSVX) 0.4 = 0.44).
Portfolio B is able to hold less equity risk (less exposure to market beta) because the equities it does own have higher expected returns. While the two portfolios had relatively similar returns and volatility, Portfolio B was more efficient, with both higher returns and less volatility. Furthermore, not only was it less volatile, but Portfolio B experienced far less downside risk. In 2008, Portfolio A lost 16.9%, while Portfolio B, thanks to its greater allocation to safe bonds, lost less than 7% (VTSMX lost 37.0%, VFITX gained 13.3% and DFSVX lost 36.8%).
In terms of diversification, Portfolio A has exposure to market beta of 0.6, just a 0.11 loading on the term factor and no exposure to the size, value and quality factors. Portfolio B is more diversified, with relatively more equal weightings on the equity factors and a higher loading on the term factor. Portfolios can also be structured to gain exposure to the momentum factor and its premium, which neither of these portfolios has. Using long/short funds can help investors construct portfolios even closer to risk parity. Consider Table 3, which lays out some additional benefits of diversifying across factors.
Table 3 provides the premium for each of the listed factors, its volatility and its Sharpe ratio. To avoid being accused of data mining, the table shows the same information for what are referred to as naïve, or 1/N, portfolios. (A naïve portfolio allocates the same amount to each of the chosen assets or factors.) Portfolio 1 has a 25% allocation to each of the four factors of market beta, size, value and momentum. Portfolio 2 is allocated 20% to each of the same four factors, but adds a 20% allocation to the profitability factor. Portfolio 3 simply substitutes the quality factor for the profitability factor.
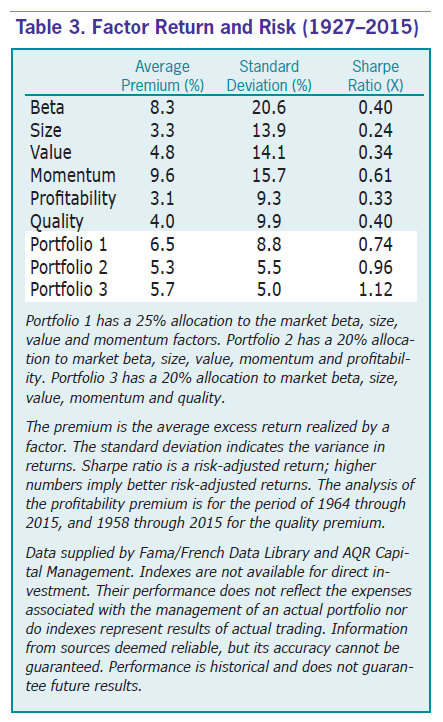
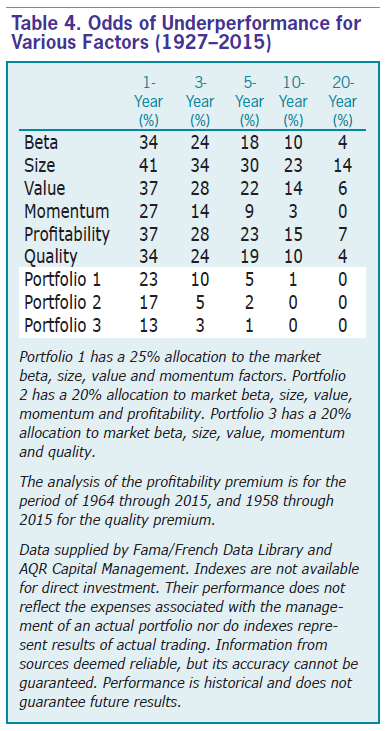
Note how the low correlations among the factors lead to higher Sharpe ratios (implying better risk-adjusted returns) for the three portfolios than for any of the individual factors. We can also see the benefits of diversifying across factors in Table 4, which provides the odds of underperformance over various time horizons.
As you look at Table 4, you should observe three things. First, in each case, the longer the horizon, the lower the odds of underperformance become. Second, no matter how long the horizon, each of the individual factors experience some periods of underperformance, even at horizons of 20 years. The sole exception is momentum at the 20-year horizon. However, this doesn’t guarantee success for momentum at 20-year horizons going forward. Third, no matter the horizon, the odds of underperformance are lower for each of the three portfolios than for any of the individual factors.
There’s one other important point to make. An argument that I often hear from older investors can be summed up with something like this: I simply don’t have 20 years to wait to earn a factor’s premium. Unfortunately, we live in a world where all crystal balls are cloudy. Even worse, investing isn’t really even about risk. It’s about uncertainty. Unlike at the poker table, where players can calculate the odds of drawing to that full house, the best investors can do with markets is estimate the odds of negative outcomes based on history. All investors can do is to put the odds in their favor. No matter the horizon, the best odds of success have come with building portfolios diversified across factors (not portfolios concentrated in single factors, even the ones with the largest historical premiums).
In summary, a total market portfolio has all of its equity eggs in one factor (or risk) basket—market beta—while a factor-based portfolio can diversify its risks across many baskets, creating more risk parity. Harvesting different risk baskets, each with premiums and low-to-negative return correlations to the others, is a prudent way for investors to diversify while improving the risk-adjusted returns.
Finally, investors should heed these words of caution: First, all factors have experienced long periods of underperformance. Thus, before investing in one of them, investors should be sure they believe strongly in the reasons why they think the factor will persist in the long run. Without this strong belief, it is unlikely that investors will be able to maintain discipline during the inevitable long periods of underperformance. Second, because there is no way to know which factors will deliver premiums in the future, investors should build a portfolio broadly diversified across them. Remember, it’s been said that diversification is the only free lunch in investing. Thus, I recommend you eat as much of it as you can.
Portfolio Strategies

Portfolio Strategies
Portfolio Strategies

James Hardin from SC posted over 9 years ago:
Paul S from CA posted over 9 years ago:
Todd Snedden from VA posted over 9 years ago:
Stephen Sanders from NY posted over 9 years ago:
Dave Samuels from CA posted over 9 years ago:
Carl Gamble from TX posted over 9 years ago:
gg from California posted over 9 years ago:
David Lambert from OH posted over 9 years ago:
David Lambert from OH posted over 9 years ago:
Bud Sloan from NV posted over 9 years ago:
cynthia m from MN posted over 9 years ago:
Russ Stoeckler from WI posted over 9 years ago:
Edward Seid from HI posted over 9 years ago:
George Sturgis from MS posted over 9 years ago:
James Braselton from AZ posted over 9 years ago:
Mark Sheingold from MA posted over 9 years ago:
Jim Linnemann from MI posted over 9 years ago:
James C from SD posted over 9 years ago:
James Borgeson from NJ posted over 9 years ago:
Jim Davidson from California posted over 9 years ago:
Brian Mahon from New York posted over 6 years ago:
Terry B. from Minnesota posted over 6 years ago:
You need to log in as a registered AAII user before commenting.
Log InCreate an account