In deciding how to apportion your money in a mutual fund portfolio, you don’t want to start by chasing last year’s best-performing funds. The performance of any fund is determined foremost by the objective of its investment strategy, which is based on targeting a specific market within an asset class. In different years, some asset classes outperform others due to the overall cycle of economic conditions. Because of this, recent short-term performance does not inherently indicate prospective performance.
Fund performance between asset classes becomes even more variable over longer periods of time. The correlations between stock, bond, real estate and commodity funds also decrease over time. Even once you’ve narrowed down your comparison to a single asset class, a broad class such as stock funds will show notable differences in performance between its specific categories. A fund following a value-based strategy investing in small-cap stocks may post different returns than a large-cap growth fund or sector-specific stock fund, such as one following health or energy companies.
In determining which fund categories to investigate, start with an asset allocation model. AAII offers three sample models composed of varying combinations of large-cap, mid-cap, small-cap, international and emerging market stocks, along with intermediate- and short-term bonds. Once you’ve determined which categories suit your investment needs and timeline based on an overall asset allocation model, compare funds over a variety of periods. Note which funds have higher returns and better grades.
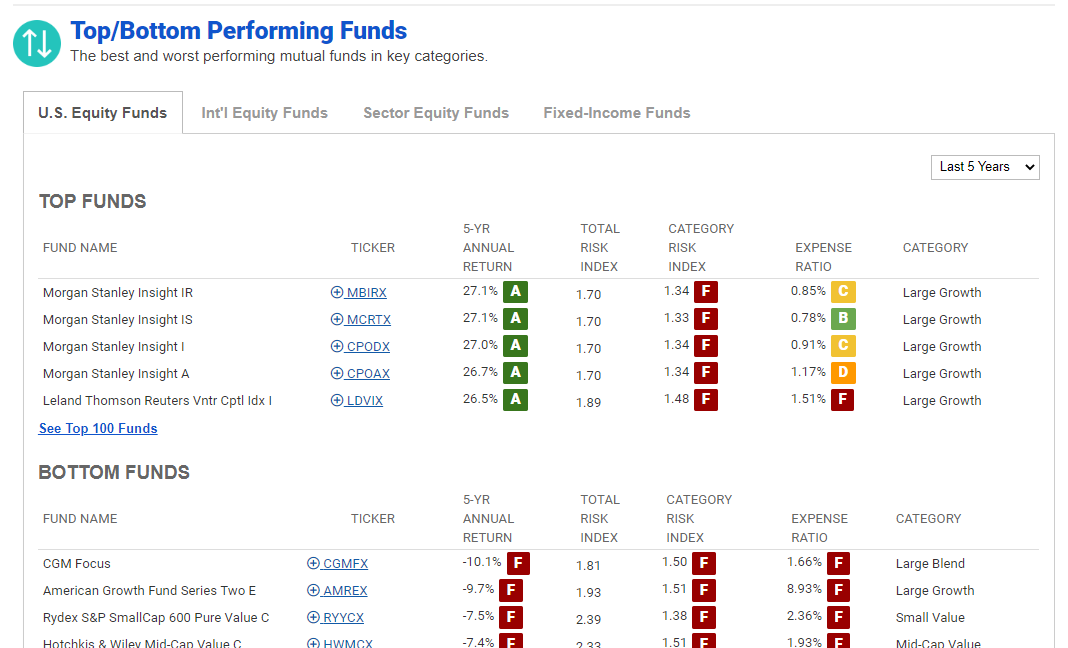
On the Funds page of AAII.com, you can find tables that help you compare a fund to its peers. The Top/Bottom Performing Funds table highlights funds within key asset categories and can be adjusted to compare funds based on one-year, three-year, five-year and 10-year performance.
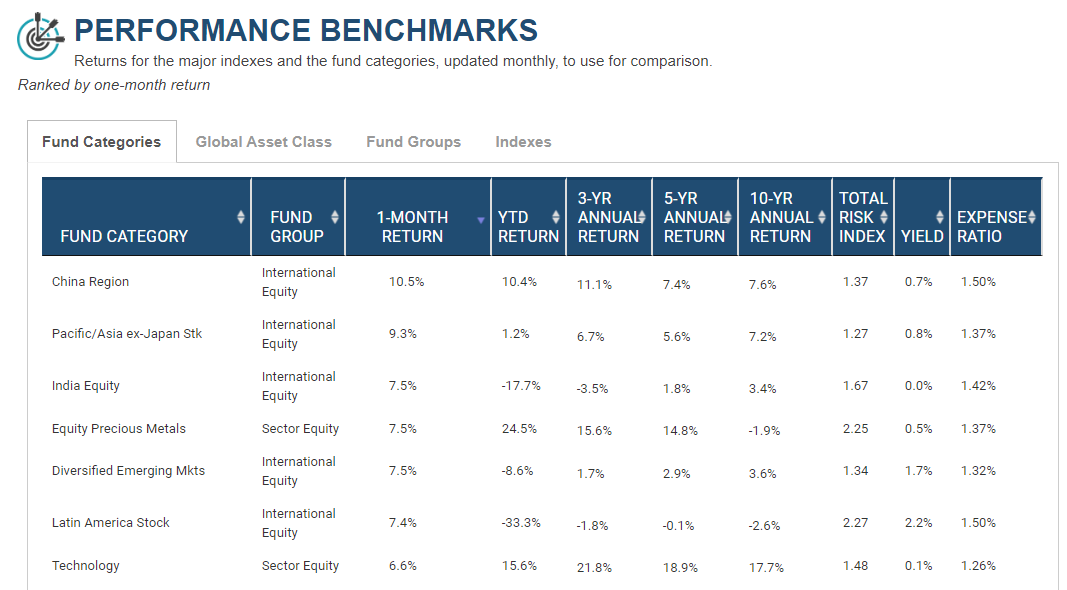
The Performance Benchmarks table shows returns for the major indexes and fund categories. By default, the table is sorted by one-month returns, but it can be adjusted to sort by one-year, three-year, five-year and 10-year return, total index risk and alphabetically. The expanded version of the table includes all of the benchmarks, with separate tabs for specific fund categories, global asset classes and major fund groups as well as a tab with index performance.