Earnings estimates are the profit forecasts made by brokerage firm analysts. The consensus estimate is the average of all published earnings forecasts for a specific company made available by I/B/E/S—the Institutional Brokers’ Estimate System—which compiles the data given to it by participating analysts. Investors follow revisions to consensus earnings estimates over time as they have been shown to be short-term drivers of stock prices.
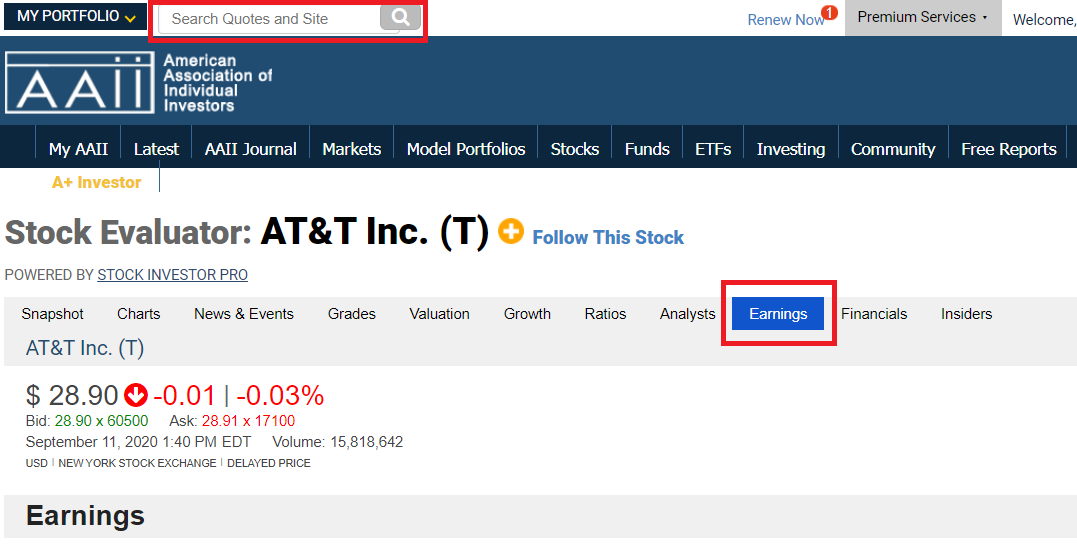
To see a company’s consensus earnings estimate, type its ticker or name into the search box at the top of AAII.com and select the stock from the dropdown list. When the company’s Stock Evaluator page has loaded, click on the Earnings tab and scroll down to the second section, Consensus EPS Estimates. Here, a chart and table provide 90-day, 60-day, 30-day, seven-day and day-of estimates.
Revisions to the average estimate of all analysts’ forecasts have been shown to be short-term drivers of stock prices. This is because the market is forward-looking. Security prices are dictated by expectations, and prices fluctuate as these expectations are affirmed or are proven to be unfounded and as analysts adjust their expectations based on the company’s latest results and updated management guidance for future quarters.
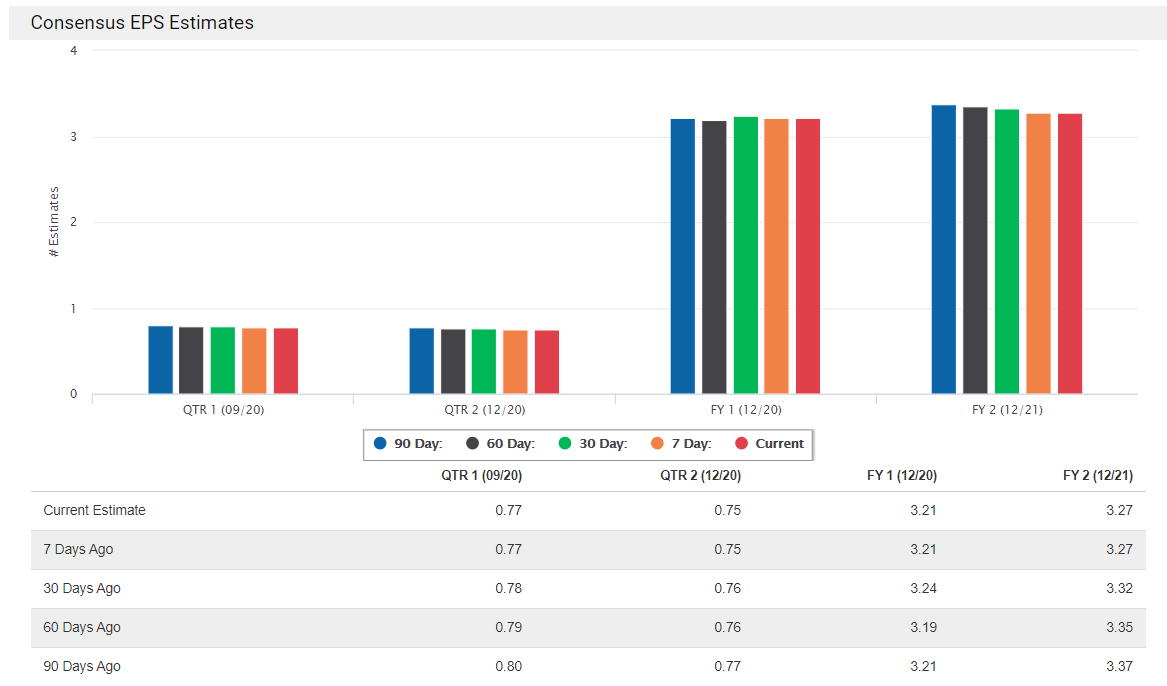
Upward revisions signal that analysts are more positive about a company’s earnings prospects. Downward revisions signal that analysts are more negative. When earnings estimates are revised significantly upward—by 5% or more—stocks tend to show above-average performance. Earnings revisions for high and low price-earnings stocks tend to have a greater impact on stock prices. This tends to be the case for upward revisions for low price-earnings stocks and downward revisions for high price-earnings stocks.
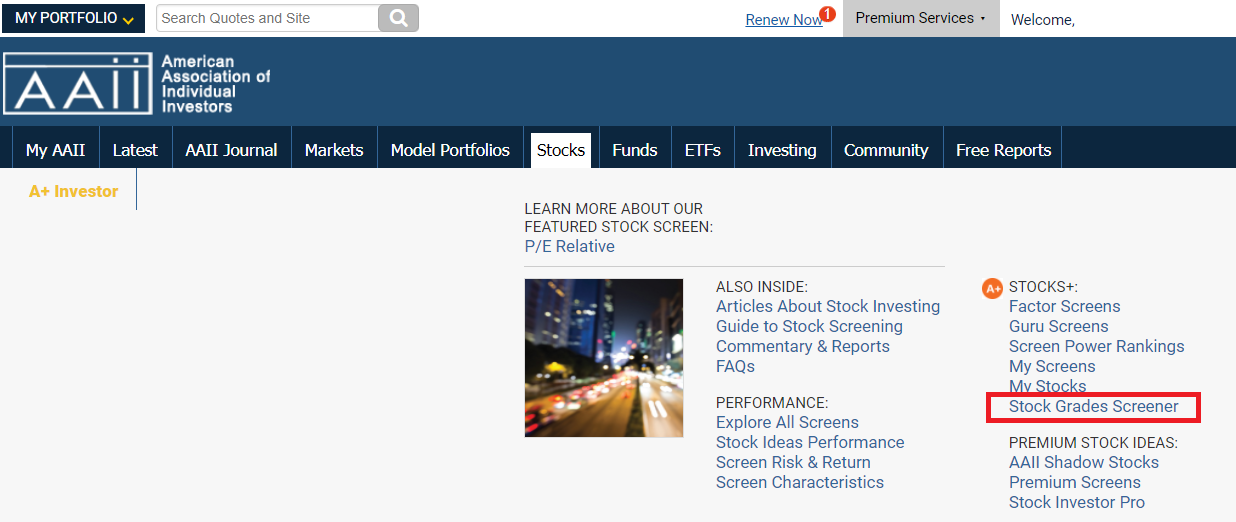
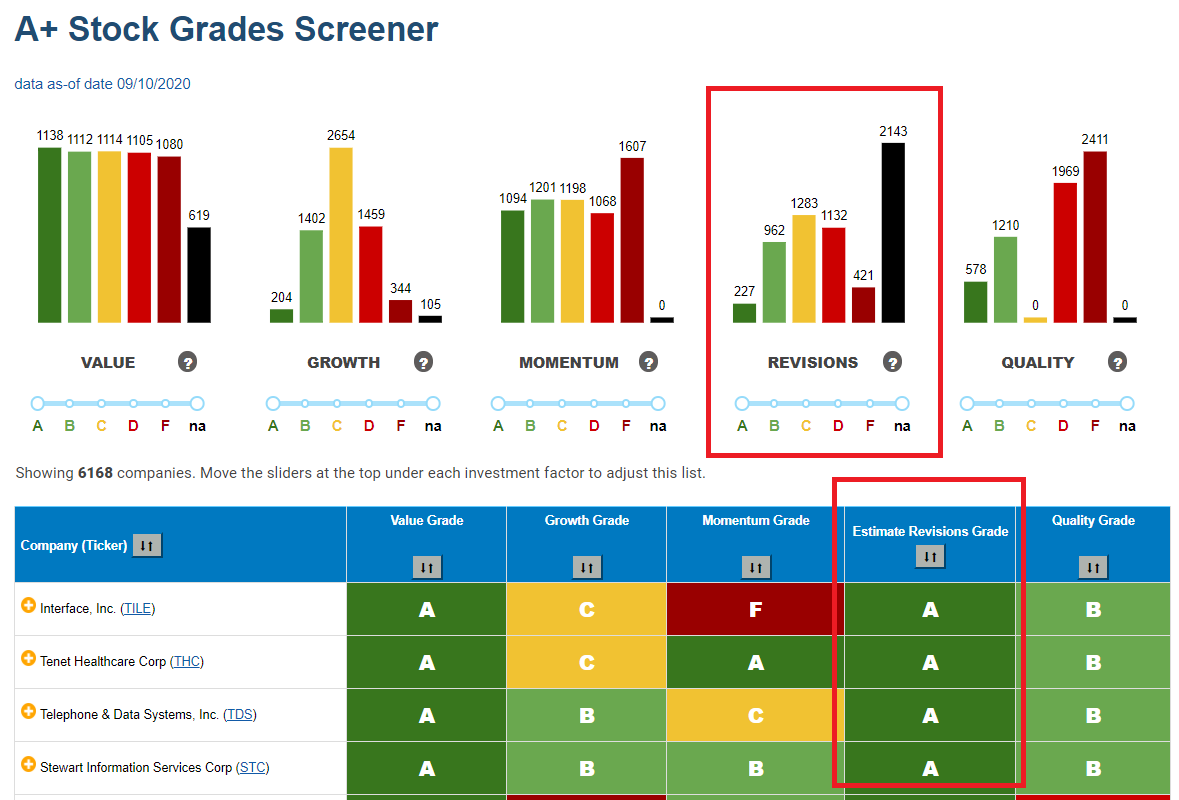
A+ Investors also have exclusive access to a series of Stock Grades that cover earnings estimates for over 6,000 stocks. The Earnings Estimate Revisions Grade ranks companies by the strength of their recent quarterly earnings surprises and earnings estimate revisions for the current fiscal year over the last month and last 90 days. To screen for companies based on their Estimate Revisions Grade, click the Stock Grades Screener link under the Stocks drop-down menu. Stock Grades are updated daily.