Academics and investors have long sought to determine what motivates a stock to outperform the market. Can outperformance be attributed to something external to a stock’s relative volatility, or is it a ‘random walk down Wall Street’? Research shows that certain characteristics, such as momentum, can indicate when a stock is or might about to be outperforming.
The investing industry commonly refers to these characteristics as factors. Along with value, momentum is one of the most persistent and lasting investment factors. Both factors take advantage of longstanding behavioral errors exhibited by investors.
Specifically, momentum investing takes advantage of investors’ desire to buy stocks with recent good performance. Investors look for stock price performance better than that of other stocks in the belief that the rising price will attract other investors, who will drive up the price even more.
Momentum is normally measured by comparing the price change of a stock over a time period relative to a benchmark, such as the S&P 500 index, or against a segment of stocks. This measurement is called relative strength.
Subscribers to A+ Investor can view Stock Grades based on the momentum factor for a given company. The Momentum Grade uses the weighted four-quarter relative strength price change for each of the past four quarters to rank companies. The most recent quarterly price change is given a weight of 40% and the price change for each of the three previous quarters is given a weighting of 20%.
Stocks with high relative levels of momentum tend to continue to outperform, while stocks with low relative levels of momentum tend to continue to underperform. To see a stock’s Momentum Grade, click on the Grades tab of its Stock Evaluator page. Type a stock’s ticker into the search box at the top of AAII.com to open the Stock Evaluator.
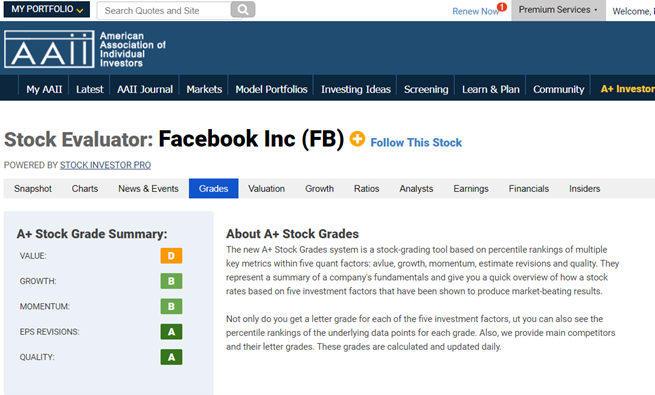
The weighted four-quarter relative strength price score for Facebook Inc. (FB) is 66 as of the close on November 12, 2020. This means that the company’s weighted four-quarter performance ranks in the 66th percentile of all U.S.-listed stocks, with higher emphasis given to the relative performance over the most recent quarter compared to that for the previous three quarters. Facebook’s weighted price performance was 6.0% greater than that of the S&P 500 over the same period, while the technology sector median was only 4.0% higher than the benchmark.
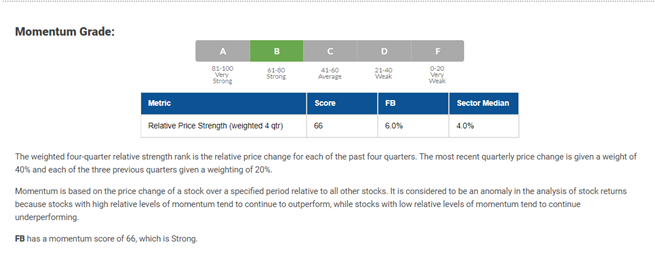
Company performance that is equal to that of the S&P 500 is represented by a relative strength score of 0%. Companies outperforming the S&P 500 have positive relative strength figures, while those underperforming the S&P 500 have negative relative strength values.
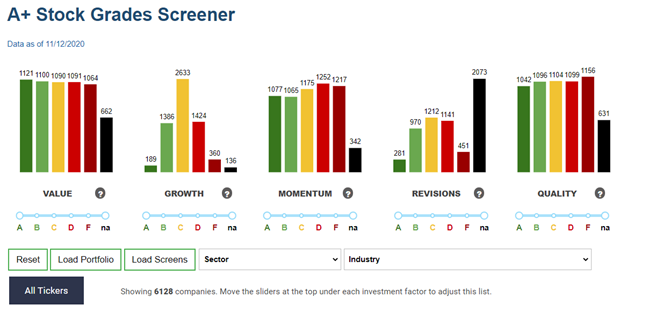
A+ Investor subscribers can also screen for stocks with targeted momentum grades using the A+ Stock Grades Screener. Move the A to F slider to the desired grades.