If you didn’t already know, the A+ Stock Grades system gives a quick overview of how a stock rates based on five investment factors that have been shown to produce market-beating results. Since the debut of the grading system with A+ Investor at the beginning of 2020, we’ve continued researching and backtesting the system to ensure the validity of its factor bases and to find improvements in how the grades apply to stocks. Recently, we instituted a new methodology for calculating the A+ Quality Grade.
Each of the five grades is based on the percentile rankings of key metrics. A higher-quality stock possesses traits associated with upside potential and reduced downside risk. Previously, the Quality Grade used a combination of five components to assess the quality of a stock.
The components of the prior Quality Grade calculation considered management’s financial decisions (accruals and change in asset turnover), whether the interests of shareholders are being recognized (share buybacks and dividends) and whether analysts are more optimistic than they were previously about the stock (earnings estimate revisions).
The new calculation is more expansive and results in a proportionate ranking of stocks. The revised Quality Grade consists of the percentile ranks of eight investment factors: return on assets (ROA), return on invested capital (ROIC), gross profit to assets, buyback yield, change in total liabilities to assets, accruals, Z double prime bankruptcy risk (Z) score and F-Score.
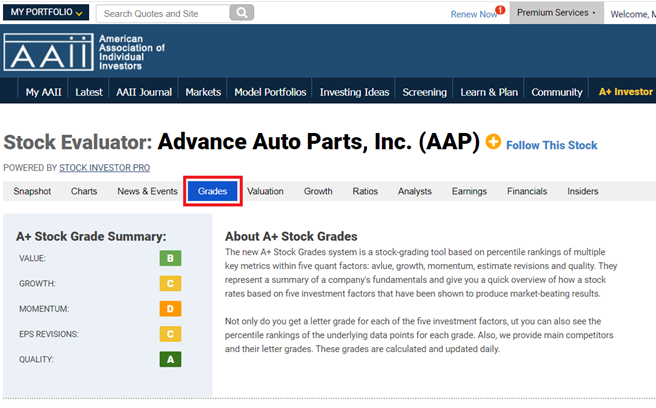
You can find a breakdown of the Quality Grade for each stock on its Stock Evaluator page, under the Grades tab. This new Quality Grade is in effect anywhere the grade is used throughout AAII.com.
For every stock, an individual percentile rank is calculated within each of the eight factors for quality. The average of a stock’s percentile rankings for all eight factors is then compared against the possible stock universe as a percentile ranking, or Quality Score, which translates to its ultimate Quality Grade.
The score can consider all eight measures or, should any of the eight measures not be valid, the remaining measures that are valid, with a minimum of four non-null metrics required to calculate a Quality Score.
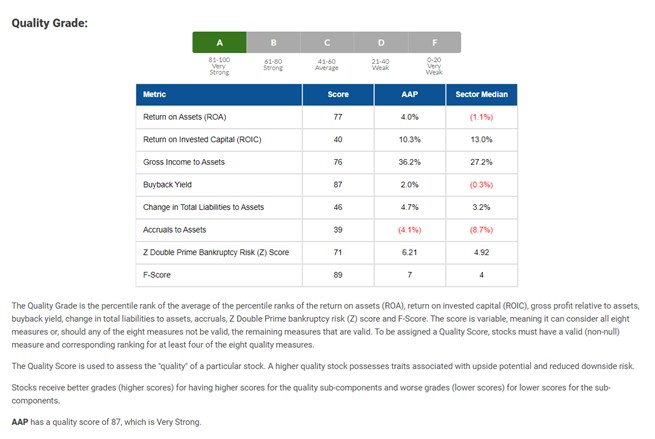
Advance Auto Parts Inc. (AAP) ranks in a variety of positions across the eight metrics making up the Quality Grade; the stock ranks in the 89th percentile for its F-Score but in the 39th percentile for its accruals-to-assets ratio as of the close on November 19, 2020.
For Advance Auto Parts, the average score for its eight variables is 63.1. When this average is ranked against other averages, Advance Auto Parts’ Quality Score—the percentile ranking of the average of its percentile rankings for all eight factors—is 87. This means that in comparison to all 6,000+ publicly traded stocks, Advance Auto Parts has very strong quality.
The data and calculations powering the A+ Stock Grades are updated as of the close on the latest trading day.

