


In these volatile markets, we wanted to make sure our valued members get access to the best information possible to help you navigate the uncertainty. This is why you may have noticed the recent enhancements to our Stock Ideas Update email.
Each week, we are sending you education and stock ideas that are relevant to today’s market. Markets like these expose bargains, so we want to highlight a few ideas that can help you replenish your portfolio through sound strategies with good long-term performance.
If you find this information valuable and want an edge throughout this market volatility, you can access robust stock screens and evaluations through A+ Investor, a suite of rigorous investment tools that includes diversification analysis, stock evaluators and more than 50 stock screens updated every day.
This week we cover a strategy that identifies stocks that have strong return on equity and send you a list of stocks that currently pass the AAII Return on Equity screen. Return on equity (ROE) may help to reveal profitable firms, but does Wall Street reward the stock prices of these firms? The AAII Return on Equity screen has been rewarded by Wall Street, outperforming the S&P 500 index since the screen’s inception in 1998. The AAII Return on Equity screen has returned 32.4% year-to-date through October 30, 2020.
Measuring Profitability by What Shareholders Earned
Return on equity is a popular measure of profitability and corporate management excellence. The measure is determined by dividing the annual earnings of the firm by stockholder’s equity. The measure relates earnings generated by a company to the investment that stockholders have made and retained within the firm. Stockholder’s equity is equal to total assets of the firm less all its debt and liabilities. Also known as stockowner’s equity, owner’s equity or even simply equity, it represents investors’ ownership interest in the company.
Warren Buffett considers it a positive sign when a company is able to earn above-average returns on equity. Buffett believes that a successful stock investment is a result first and foremost of the underlying business; its value to the owner comes primarily from its ability to generate earnings at an increasing rate each year. Buffett examines management’s use of owner’s equity, looking for management that has proven it is able to employ equity in new moneymaking ventures, or for stock buybacks when they offer a greater return. If the earnings are properly reinvested in the company, earnings should rise over time and stock price valuation will also rise to reflect the increasing value of the business.
Return on equity indicates how much the stockholders earned for their investment in the company. Annual net income of $100 million created on a base of $300 million in stockholder’s equity is very good ($100 ÷ $300 = 0.30, or 30%). However, $100 million in annual net income relative to $3,000 million in shareholders’ equity would be considered poor ($100 ÷ $3,000 = 0.03, or 3%). Generally, the higher the return on equity, the better. A return on equity above 15% is good, and figures above 20% are considered exceptional. It is important to compare return on equity with industry-wide averages to get a true feel for the significance of a company’s ratio.
Return on Equity Defined
Return on equity can be simply stated as net income divided by common stockholder’s equity. However, return on equity can be broken down into three components: net profit margin, asset turnover and financial leverage. Multiplying these three components together results in return on equity.
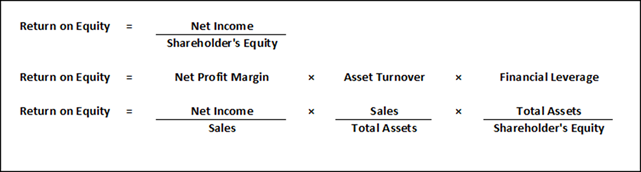
The net profit margin—net income divided by sales—reflects how efficient a firm is in operations, administration, financing and tax management per sales dollar. An improvement in profit margin translates into an increase in earnings for a given level of sales.
Asset turnover—sales divided by total assets—shows how well a company utilizes its asset base to produce sales. Poorly deployed or redundant assets result in a low asset turnover that adversely reflects return on equity and profitability.
Multiplying profit margin and asset turnover together results in return on assets. A firm can increase its return on assets and thereby its return on equity by increasing its profit margin or its operating efficiency as measured by its asset turnover. Margins are improved by lowering expenses relative to sales. Asset turnover can be improved by selling more goods with a given level of assets. This is the reason why companies try to divest assets (operations) that do not generate a high degree of sales relative to the value of the assets, or assets that are decreasing their sales generation. When examining profit margins or asset turnover, it is important to consider industry trends and compare them to how a company is doing within its industry.
Financial leverage completes the return on equity equation. Financial leverage—total assets divided by common stockholder’s equity—indicates to what degree the firm has been financed through debt as opposed to equity sources. The greater the value of this leverage ratio, the greater the financial risk of the firm—but also the greater the return on equity. If equity is small relative to debt, then earnings generated will result in a high return on equity if the firm is profitable. The risk with high levels of debt is that a company will not generate enough cash flow to cover the interest payments during challenging times.
Debt magnifies the impact of earnings on return during both good and bad years. When large differences between return on assets and return on equity exist, an investor should closely examine the liquidity and financial risk ratios.
The ideal firm would maintain a high net profit margin, utilize assets efficiently and do it all with low risk, low financial leverage. The key in working with return on equity is examining and understanding the interplay between the determinates of the ratio.
Implementing the AAII Return on Equity Screen
The primary goal of the AAII Return on Equity screen is to identify companies with consistently high return on equity. Secondarily, the AAII approach includes characteristics to filter out firms with high levels of debt, low margins and low asset turnover relative to industry medians.
The AAII Return on Equity approach starts by seeking out companies operating with a return on equity 1.5 times their respective industry median over the last 12 months and each of the last five fiscal years. This screen helps to reveal companies whose management has consistently generated the highest profits from its equity capital. The AAII Return on Equity strategy does not simply screen for companies with return on equity levels of 20% or higher, but instead looks for ratios that are high relative to industry norms to highlight firms outperforming their peers.
Stocks Passing the Return on Equity Screen (Ranked by Return on Equity)
| Company Name | Ticker |
Closing Price (11/13) ($) |
Return on Equity (%) |
Indus Return on Equity (%) |
Return on Equity 5-Yr Avg (%) |
EPS Growth Rate 5-Yr (%) |
Sales Growth Rate 5-Yr (%) |
Industry |
|---|---|---|---|---|---|---|---|---|
| Medifast Inc. | MED | 169.62 | 80.2 | 9.2 | 38.8 | 44.8 | 20.1 | Food Processing |
| FactSet Research Systems Inc. | FDS | 328.26 | 48.2 | 16.4 | 53.6 | 11.1 | 8.2 | Professional Information Services |
| Tractor Supply Company | TSCO | 131.98 | 46.7 | 6.7 | 32.5 | 11.8 | 7.9 | Retailers - Other Specialty |
| Logitech International | LOGI | 83.16 | 44.2 | 6.8 | 24.0 | 116.4 | 8.2 | Computer Hardware |
| Intuit Inc. | INTU | 356.95 | 42.5 | 3.7 | 57.4 | 40.0 | 12.9 | Software |
| Vertex Pharmaceuticals Inc. | VRTX | 225.52 | 38.2 | (48.6) | 7.6 | 28.2 | 48.3 | Biotech & Medical Research |
| Trex Company Inc. | TREX | 72.33 | 34.5 | 8.5 | 46.3 | 31.0 | 13.7 | Construction Supply & Fixtures |
| MarketAxess Holdings Inc. | MKTX | 522.93 | 33.3 | 11.5 | 29.3 | 22.2 | 14.2 | Financial & Commodity Opers & Servs |
| Toro Co. | TTC | 87.10 | 31.0 | 5.0 | 43.2 | 10.7 | 7.6 | Heavy Machinery & Vehicles |
| Fastenal Company | FAST | 47.53 | 30.6 | 7.5 | 29.9 | 10.6 | 7.4 | Industrial Machine & Equip |
| Educational Development Corp. | EDUC | 15.57 | 30.3 | (0.4) | 23.1 | 44.6 | 28.3 | Consumer Publishing |
| T. Rowe Price Group Inc. | TROW | 140.43 | 30.3 | 5.1 | 27.3 | 13.5 | 6.7 | Investment Mgmnt & Fund Opers |
| Rollins, Inc. | ROL | 58.83 | 29.2 | 7.6 | 30.3 | 8.2 | 7.4 | Business Support Services |
| Lululemon Athletica Inc. | LULU | 325.45 | 29.0 | (2.8) | 27.6 | 24.4 | 17.2 | Apparel & Accessories |
| ResMed Inc. | RMD | 214.74 | 28.1 | (12.6) | 20.5 | 11.4 | 12.0 | Advanced Medical Equip & Tech |
| LGI Homes Inc. | LGIH | 111.92 | 27.8 | 13.6 | 25.4 | 41.3 | 36.8 | Homebuilding |
| Simulations Plus, Inc. | SLP | 68.09 | 22.4 | (12.6) | 25.0 | 21.3 | 24.3 | Advanced Medical Equip & Tech |
| J.B. Hunt Transport Services | JBHT | 129.15 | 21.1 | 11.4 | 31.3 | 8.5 | 8.3 | Freight & Logistics - Ground |
| EPAM Systems Inc. | EPAM | 333.38 | 18.4 | 4.4 | 15.6 | 26.4 | 25.7 | IT Services & Consulting |
| Clearfield Inc. | CLFD | 23.03 | 9.3 | 2.6 | 8.4 | 8.6 | 9.1 | Communications & Networking |
| Source: AAII Stock Investor Pro, Refinitiv and I/B/E/S. Data as of 11/13/2020. | ||||||||
As discussed above, return on equity is influenced by profitability, efficiency and leverage. Therefore, the next set of screens seek out companies outperforming their peers in these areas. First, the AAII Return on Equity approach requires that a firm’s net margin (net income divided by sales) exceed the industry median over the last four quarters. Net profit margin looks at bottom-line profitability. Firms exceeding their peers are able to translate a higher percentage of sales into profits.
Next, the AAII Return on Equity screen makes sure that the asset turnover (sales divided by total assets) for a firm exceeds the industry median over the last four quarters. Asset turnover helps to measure the efficiency of a firm’s use of its asset base. Firms exceeding their peers are generating higher levels of sales dollars for a given level of assets.
The AAII Return on Equity approach also specifies that when looking at the financial leverage of firms, the ratio of total liabilities to total assets at the end of the most recent quarter falls below the industry median. A high return on equity can be attained by having a very high amount of debt and, therefore, a very low stockholder’s equity. In such a case, return on equity would be high, but risky. Financial leverage increases return but also increases risk. Highly leveraged firms have more volatile earnings. Acceptable levels of debt vary from industry to industry. More stable industries such as utilities can comfortably carry more debt on their balance sheets than volatile industries such as oil and gas. By comparing levels of liabilities to industry medians, AAII takes industry differences into account.
To help ensure some basic level of growth, the AAII Return on Equity strategy requires positive earnings and sales growth over the last four quarters. The AAII Return on Equity approach also specifies that the firm’s five-year historical earnings and sales growth exceed medians for their industry. The approach does not specifically look for high absolute levels of growth, just some sign that the firms are expanding faster than their peers.
The AAII Return on Equity screen requires that a stock be listed on an exchange to help ensure trading liquidity. Due to their special nature, the AAII screen also excludes real estate investment trusts (REITs), closed-end funds and American depositary receipts (ADRs).
Keep in mind that no matter how well a stock screening methodology has performed (or how badly it has underperformed) over the long term, stock screening is only the first step in the stock selection process. You will want to do your homework to see why these companies are at their current levels. Only then will you gain insight into those that will continue to languish and those that may eventually flourish.
The stocks meeting the criteria of the approach do not represent a “recommended” or “buy” list. It is important to perform due diligence to verify the financial strength of the passing companies and to identify those stocks that match your investing tolerances and constraints before committing your investment dollars. Keep in mind that the quantitative screens AAII has developed are based upon our interpretations of published works tied to the market gurus.
Discussion
FREE REPORT

No comments have been added yet. Add your thoughts to the discussion!
You need to log in as a registered AAII user before commenting.
Log InCreate an account