


There are many proponents of investing based on market capitalization. James O’Shaughnessy is one of those proponents. We introduced four stock screening strategies in 2006 based on his book “Predicting the Markets of Tomorrow: A Contrarian Investment Strategy for the Next Twenty Years” (Portfolio, 2006). The book discusses market-capitalization trends and investment cycles that O’Shaughnessy believes last about 20 years.
The best-performing strategy of the group is called Tiny Titans, which focuses on low-price micro-cap stocks. Much research has been done regarding the success of investing in this market-cap category. AAII’s Shadow Stock Portfolio is based on a study that showed that small and micro-cap stocks tend to outperform the overall market over long periods of time.
O’Shaughnessy believes the reason for this outperformance is that few analysts follow these small stocks. In addition, many institutional investors and mutual funds cannot trade these stocks without moving the price due to the relatively small number of outstanding shares. This leaves room for surprises, which can lead to a performance “pop.” O’Shaughnessy also says that micro-cap stocks have a low correlation with the overall stock market, making them a potential hedge in a portfolio of larger-cap stocks.
On the flip side, micro-cap stocks can be very volatile and risky. A sudden influx or outflow of money in the stock can cause the price to move dramatically.
Screen Overview
AAII’s version of O’Shaughnessy’s Tiny Titans stock screen consists of very few criteria. First, all foreign stocks and over-the-counter stocks are eliminated. Next, a stock’s market capitalization must be between $25 million and $250 million. As of April 30, 2010, AAII’s fundamental stock screening program, Stock Investor Pro, included 2,299 stocks out of 9,858 that met this criterion. In contrast, large-cap stocks are generally considered to have a capitalization of $5 billion or greater.
After filtering out the larger capitalization stocks, the Tiny Titans screen looks for stocks with price-to-sales ratios of less than 1.0. O’Shaughnessy uses this as a proxy for “cheapness,” as opposed to a price-earnings ratio. His reasoning is that all viable companies have sales, and sales are harder to manipulate than earnings. In his book called “What Works on Wall Street” (McGraw-Hill, 2005), O’Shaughnessy found that stocks with low price-to-sales ratios produced higher returns. A total of 3,026 stocks in the Stock Investor Pro database met this single criterion, and 568 met all the criteria.
Finally, O’Shaughnessy thinks investors should hold 25 stocks in this micro-cap portfolio to diversify the risk that goes along with holding such volatile stocks. He narrowed the list to the 25 stocks with the highest 52-week relative strength as compared to the S&P 500. We adjusted this criterion until exactly 25 stocks passed, and ended up with a 52-week relative strength of greater than 245% for all passing companies.
Performance & Characteristics
Figure 1 gives the performance of the Tiny Titans screen since 1998. The performance is compared to the S&P 500, S&P MidCap 400, S&P SmallCap 600 and a list of all U.S. exchange-listed stocks. The Tiny Titans screen has outperformed each of these benchmarks on a cumulative basis, gaining 3,010.3% since 1998. The S&P SmallCap 600 index has gained 110.4% over the same period.
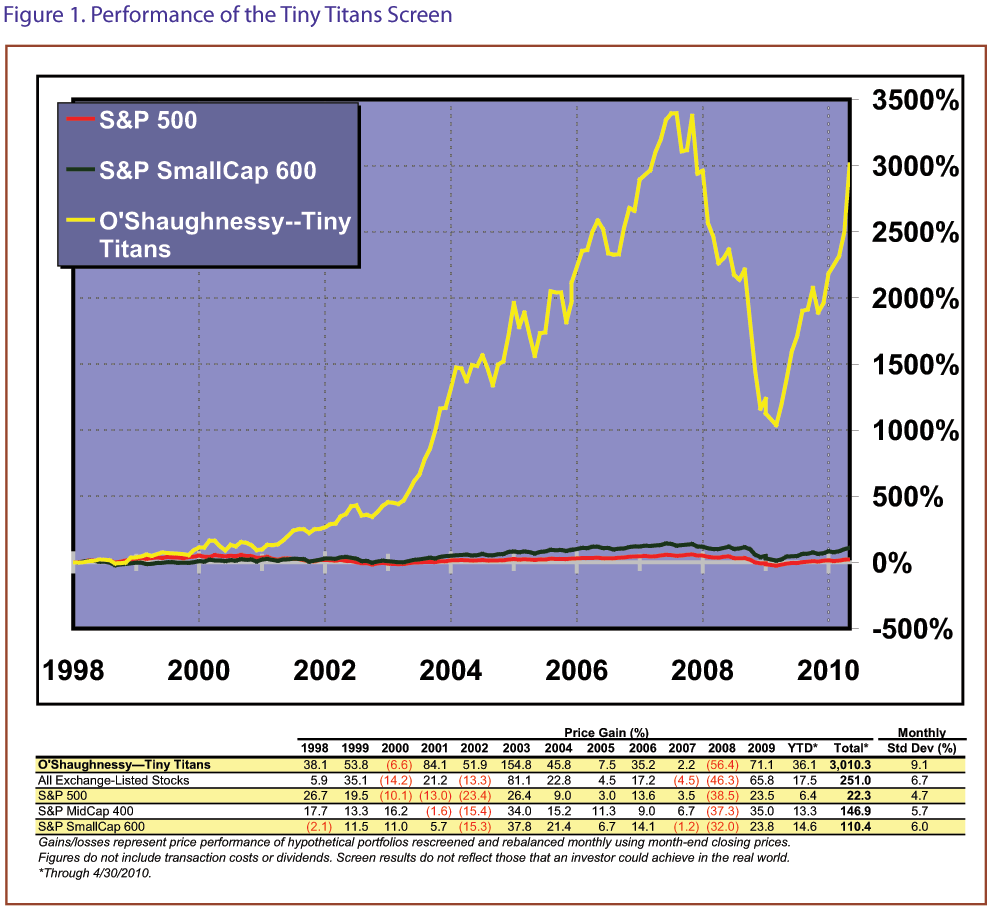
The worst year for the Tiny Titans was 2008 when it lost 56.4%. During that year of market turmoil, all but one of AAII’s stock screens (Piotroski) lost money and the Tiny Titans loss was among the largest. Its best year was 2003 with a gain of 154.8%. This was a good year for stocks in general and a better year for smaller capitalization stocks. Year-to-date, Tiny Titans is one of the better-performing screens, up 36.1% as of April 30, 2010.
Also worth noting is that the standard deviation (a measure of volatility) of this screen is 9.1 compared to a much lower 4.7 for the S&P 500.
Table 1 lists the portfolio characteristics compared to all exchange-listed stocks. Not surprisingly, the Tiny Titans have a much lower market cap ($174.6 million versus $468 million), a lower price-to-sales ratio (0.5 versus 1.5), and a much higher relative strength (370% versus 5%). Interestingly, looking at traditional measures of value, the Titans have a higher price-earnings ratio (21.0 versus 19.4) and a higher price-to-book-value ratio (1.8 versus 1.7) than the exchange listed stocks. However, looking at the passing companies list on page 29, you can see that most of the stocks have negative trailing 12-month earnings per share, making the price-earnings ratio not meaningful. A lot of micro-cap companies tend to be young, so negative earnings per share is not abnormal.
The highest number of passing companies in a month is 27 and the lowest is 24, due to ties in relative strength. The screen has a relatively high rate of turnover of 42.3% each month.
| Portfolio Characteristics (Median) |
Tiny Titans |
Exchange- Listed Stocks |
| Price-earnings ratio (X) | 21.0 | 19.4 |
| Price-to-book-value ratio (X) | 1.8 | 1.7 |
| Price-to-sales ratio (X) | 0.5 | 1.5 |
| Price-earnings-to-EPS est growth (X) | 2.0 | 1.5 |
| EPS 5-yr. historical growth rate (%) | -26.1 | -0.6 |
| EPS 5-yr. estimated growth rate (%) | 10.0 | 12.1 |
| Market cap. ($ million) | 174.6 | 468.0 |
| Relative strength vs. S&P (S&P=0) (%) | 370 | 5 |
| Monthly Observations | ||
| Average no. of passing stocks | 25 | |
| Highest no. of passing stocks | 27 | |
| Lowest no. of passing stocks | 24 | |
| Monthly turnover (%) | 42.3 | |
| Data as of 4/30/2010. | ||
Passing Companies
Looking at Table 2, you can see that the smallest company has a market cap of $30 million (Patrick Industries) and the largest of the group is $240 million (Libbey Inc.). Libbey also has the highest 52-week relative strength of the group (798%). The company designs, manufactures and markets a line of glass tableware, ceramic dinnerware and metal flatware.
Libbey has had a string of negative earnings since 2004. The company lost $5.84 per share in 2008 and lost $1.90 per share in 2009. The company had been increasing sales, losing only a little ground in 2009. With the economic downturn, this is not surprising. Cost of goods sold as a percentage of sales has remained relatively the same through the years. If sales are generally increasing and costs are inline, why is Libbey posting negative earnings? The answer is acquisitions and debt. The company was aggressive with acquisitions, which resulted in taking on a lot of long-term debt. Interest expense is eating away at the company’s earnings each year. In 2005, long-term debt was under $250 million. This number has doubled to over $500 million in 2009.
This demonstrates the importance of careful analysis of any stock. In fact, Libbey announced first-quarter earnings on April 29, 2010, that beat analyst expectations by 75%. However, the stock plummeted more than 7% the next week.
This also demonstrates the risk of scarcely followed micro-cap stocks—prices can be extremely volatile.
Table 2. Companies Passing the Tiny Titan Screen
A current list of stocks passing this screen can be found here.
| Company (Exchange: Ticker) |
Share Price ($) |
Mkt Cap ($ Mil) |
P/S Ratio (X) |
P/E Ratio (X) |
12-Mo EPS ($) |
52-Wk Rel Strgth (%) |
Description |
| Libbey Inc. (A: LBY) | 14.9 | 240.8 | 0.3 | nmf | -1.94 | 798 | glass tableware |
| Spanish Broadcasting (M: SBSA) | 1.7 | 111.2 | 0.9 | nmf | -0.33 | 640 | media & entertainment |
| Lee Enterprises (N: LEE) | 3.8 | 169.6 | 0.2 | 21.0 | 0.18 | 632 | local news, info & advertising |
| Commercial Vehicle Gp (M: CVGI) | 9.4 | 221.5 | 0.5 | nmf | -3.74 | 617 | seat systems for trucks |
| Bell Microproducts (M: BELM) | 7.0 | 226.1 | 0.1 | 31.8 | 0.22 | 551 | data storage & server prods |
| Nexstar Broadcasting Gp (M: NXST) | 6.7 | 190.8 | 0.8 | nmf | -0.44 | 533 | TV broadcasting |
| BioFuel Energy Corp. (M: BIOF) | 2.6 | 85.3 | 0.2 | nmf | -0.67 | 522 | ethanol & co-products |
| NaviSite, Inc. (M: NAVI) | 3.0 | 107.5 | 0.7 | nmf | -0.50 | 471 | IT for enterprise-host servs |
| Salem Communications (M: SALM) | 4.7 | 111.2 | 0.6 | nmf | -0.35 | 446 | radio broadcasting |
| IDT Corp. (N: IDT) | 9.9 | 224.3 | 0.2 | nmf | -1.92 | 436 | telecom servs |
| Federal Agricu’l Mortgage (N: AGM) | 22.5 | 228.4 | 0.8 | 2.8 | 8.08 | 424 | ag real estate & rural mortgage |
| Emmis Communications (M: EMMS) | 2.3 | 87.3 | 0.3 | nmf | -8.53 | 388 | radio broadcasting |
| Patrick Industries (M: PATK) | 3.3 | 29.9 | 0.1 | nmf | -0.61 | 370 | RV building prods |
| Newcastle Investment (N: NCT) | 3.8 | 200.0 | 0.6 | nmf | -4.23 | 348 | real estate & finance |
| Sypris Solutions (M: SYPR) | 4.5 | 88.4 | 0.3 | nmf | -0.30 | 346 | specialty prods and servs |
| Gray Television (N: GTN) | 3.8 | 182.4 | 0.7 | nmf | -0.83 | 306 | TV broadcasting |
| NN, Inc. (M: NNBR) | 7.2 | 118.9 | 0.5 | nmf | -2.17 | 304 | metal & plastic components |
| Dreams, Inc. (A: DRJ) | 1.6 | 61.7 | 0.7 | nmf | 0.00 | 302 | sports memorabilia |
| Ultra Clean Holdings (M: UCTT) | 9.9 | 212.7 | 0.9 | nmf | -0.45 | 299 | systems for semiconductors |
| Kid Brands (N: KID) | 10.0 | 215.1 | 0.9 | 18.5 | 0.54 | 284 | infant & child consumer prods |
| Rural/Metro Corp. (M: RURL) | 7.1 | 178.0 | 0.3 | 88.1 | 0.08 | 278 | private fire protection servs |
| Lifetime Brands (M: LCUT) | 14.5 | 174.6 | 0.4 | 111.8 | 0.13 | 276 | kitchen appliances & home décor |
| Sport Chalet (M: SPCHA) | 3.1 | 43.1 | 0.1 | nmf | -1.35 | 274 | sporting goods stores |
| Navarre Corp. (M: NAVR) | 2.2 | 78.2 | 0.2 | 4.7 | 0.46 | 259 | PC software & video games |
| Jamba (M: JMBA) | 3.6 | 188.7 | 0.6 | nmf | -0.48 | 246 | retail fruit smoothie franchises |
| Exchange Key: A = American Stock Exchange; M = NASDAQ; N = New York Stock Exchange. | |||||||
| Source: AAII’s Stock Investor Pro/Thomson Reuters. Data as of 4/30/2010. | |||||||
Conclusion
O’Shaughnessy believed that investing based on market capitalization could improve performance. However, he never advised holding a portfolio made up of only one market-cap category. He recommends that conservative investors limit small and micro-cap holdings to 25% of an overall portfolio—more aggressive investors can hold up to 35%.
Remember that these stock screens are not lists of recommended stocks. The screens simply find stocks with similar quantifiable characteristics. It is important to perform additional due diligence on any company that passes a stock screen.
Discussion
FREE REPORT

Blah from ID posted over 16 years ago:
John from MI posted over 14 years ago:
Jean from IL posted over 14 years ago:
Diego from TX posted over 12 years ago:
Joe Lan from IL posted over 12 years ago:
DAVID L from VA posted over 3 years ago:
JEAN H from IL posted over 3 years ago:
You need to log in as a registered AAII user before commenting.
Log InCreate an account