
A year ago, I wrote about why I favored corporate bonds instead of government bonds. I revisited the subject this week after doing my semiannual review of my workplace retirement savings account.
One of the funds I hold in my 403(b) account is the Vanguard Intermediate-Term Investment-Grade Fund Admiral Shares (VFIDX). As the name implies, it invests in higher-quality corporate bonds. These bonds are riskier than Treasury bonds with similar maturities because there is a greater chance of a corporate issuer defaulting. The risk of default among investment grade bonds is nowhere near as high as it is for high-yield (aka, junk) bonds, but U.S. government bonds are still the safest.
The reason I took a second look was credit spreads. A credit spread is the difference in yield between a safer and riskier bond of similar maturity. It’s helpful to think of spreads in terms of insurance premiums. Insurance companies charge more if they think there is a greater risk of having to pay out on a policy (e.g., because a person has had a few traffic violations). Similarly, bond investors demand higher yields if they think there is a greater risk of the bond issuer defaulting. Depending on the prevailing economic and risk-taking environment, credit spreads can narrow (less difference between the yields for safer and riskier bonds) or widen (a bigger difference between the yields for safer and riskier bonds).
As of last Friday, the spread between Moody’s Baa rated bonds and the benchmark 10-year Treasury note was 1.88%. Put another way, if you were to compare the yield of a corporate bond at the bottom edge of what qualifies as investment grade to the yield of the 10-year note, you’d notice the yield on the former being 188 basis points higher. Of course, without any additional context, this doesn’t tell you whether the spread is narrow or wide.
Fortunately, the data is available in the St. Louis Federal Reserve’s FRED Economic database. Since 1986, the median spread has been 220 basis points. It has ranged between a low of 116 basis points (March 20, 1989) and a high of 616 basis points (December 4, 2008). So, while the current spread ranks in the bottom third historically, it is not unusually low.
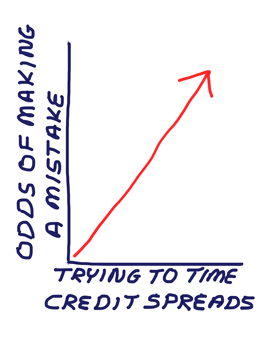
Even if you determined the prevailing spread between Treasuries and investment grade corporate bonds to be unusually low, could you profit from it? Alternatively, would it make financial sense to follow a tactical strategy of allocating to Treasuries when spreads were tight and then go into corporate bonds when spreads were wide? Judging from the annual returns of the Vanguard Intermediate-Term Treasury Fund (VFITX) relative to the returns of Vanguard Intermediate-Term Investment-Grade Fund (VFICX), the answer is probably not without possessing a working crystal ball. When I matched the returns of the funds with the annual changes in the credit spreads, no clear trend was evident. It’s possible that a more granular approach might find a pattern, but you would still have to identify when spreads are likely to reverse direction before the shift occurs.
One pattern I did notice was the tendency for VFICX (corporate bonds) to underperform VFITX (Treasuries) during tougher periods for stocks (e.g., 2002, 2008, 2011, etc.). This is not surprising given that declines in stock prices are often accompanied by a flight to quality (meaning dollars flowing into Treasury bonds) and bear markets and steep corrections are accompanied by concerns about economic growth. Again, profiting from such events requires being able to forecast them in real time—far easier said than done.
As far as my 403(b)—where I hold the admiral share class version of the Vanguard Intermediate-Term Investment-Grade Fund—I made no changes to its holdings. I check the account twice a year to see if any rebalancing is needed. As of last weekend, none of my funds accounted for less than 15% or more than 25% of the account’s total value. (I equal weight the five funds.) The monthly contributions are likely helping to keep the need to rebalance at bay.
For those who are curious, the five funds I hold in the account are the Vanguard S&P 500 Index fund (VFIAX), Vanguard FTSE All-World ex-US Small-Cap Index fund (VFSVX), Vanguard Intermediate-Term Investment-Grade (VFIDX), Vanguard Real Estate Index fund (VGSLX) and Vanguard Small-Cap Value Index fund (VSIAX). Each fund has the same target allocation of 20%. All but the all-world small-cap fund are admiral share class funds.

- Corporate Bond Analysis: What to Consider – When considering a corporate bond, look beyond yield and focus on an issuer’s character, capacity, collateral and conditions.
- Where Credit Is Due: A Look at the Ratings – In this 2009 AAII Journal article, we explained what credit ratings are and contrasted the various ratings from Moody’s, S&P and Fitch.
- Well-Built 529s Can Be a Great Option for College Savings – These plans provide a tax-free way to grow and use savings to pay for college; plus see which plans Morningstar rates as being the best.
- Stock Order Types – This month’s InvestoGraphic explains the various options your broker may give you to choose from when placing an order to buy or sell a stock.
Earnings season remains in full swing with nearly 140 S&P 500 companies scheduled to report. Included in this group are Dow Jones industrial components: Coca-Cola Co. (KO) and Pfizer Inc. (PFE) on Tuesday; Apple Inc. (AAPL) and DowDuPont Inc. (DWDP) on Thursday; and Chevron Corp. (CVX) and Exxon Mobil Corp. (XOM) on Friday.
The week’s first economic report will be September personal income and outlays, released on Monday. Tuesday will feature the August S&P Corelogic Case-Shiller home price index and the Conference Board’s October consumer confidence survey. The October ADP employment report and the October Chicago Purchasing Managers’ Index (PMI) will be released Wednesday. Thursday will feature preliminary third-quarter productivity, the October PMI manufacturing index, the October ISM manufacturing index and September construction spending. The October jobs data—including the change in the nonfarm payrolls and the unemployment rate—as well as October motor vehicle sales, September international trade and September factory orders will be released on Friday.
Chicago Federal Reserve bank president Charles Evans, who will speak on Monday, is the only Fed official scheduled to make a public appearance.
- Companies Surpassing Industry Norms
- Learning From the Mistakes Made by Legendary Investors
- Future Retirees at Greater Risk of Hardship
Pessimism about the short-term direction of the stock market is at its highest level in six months. The latest AAII Sentiment Survey also shows optimism among individual investors falling to an unusually low level.
Bullish sentiment, expectations that stock prices will rise over the next six months, fell 6.0 percentage points to 28.0%. Bullish sentiment was last lower on July 4, 2018 (27.9%). Bullish sentiment is below its historical average of 38.5% for a third consecutive week and the sixth time in the last seven weeks.
Neutral sentiment, expectations that stock prices will stay essentially unchanged over the next six months, is unchanged at 31.0%. Neutral sentiment is above its historical average of 31.0% for the 34th time in the past 36 weeks.
Bearish sentiment, expectations that stock prices will fall over the next six months, jumped 6.0 percentage points to 41.0%. Pessimism was last higher on April 11, 2018 (42.8%). Pessimism is above its historical average of 30.5% for the sixth time in the last seven weeks.
As stated above, optimism is at an unusually low level, though barely. At the same time, pessimism is at an unusually high level. Bullish sentiment readings that are more than one standard deviation below their historical average (currently less than 28.1%) have mostly been followed by higher-than-average six- and 12-month returns for the S&P 500 index.
The majority of the responses to this week’s survey were recorded before yesterday’s drop. Our survey period runs from Thursday through Wednesday with reminder emails to take the survey sent to a rotating group of AAII members each Monday.
Some AAII members had been anticipating a decline in stock prices prior to the recent downward volatility; whether the pullback is steep enough to prompt them to act remains to be seen. Tariffs and the possibility of an escalating trade war remain front and center on the minds of many individual investors. Also influencing sentiment are Washington politics (including President Donald Trump), midterm elections, economic growth, valuations and corporate profits.
Since we are holding our annual Investor Conference in Las Vegas starting tomorrow, this week’s special question asked AAII members what they most like to gamble on. Slightly more than a fourth of all respondents (26%) say they gamble on stocks, particularly technology stocks. Approximately 23% say they don’t gamble. Blackjack is listed by 9% of respondents, followed by the lottery and table games (poker, roulette and craps) at 6% each. Slightly more than 4% say slot machines.
Here is a sampling of the responses:
- “I don’t gamble. I always like the odds on my side.”
- “I like to devote a small portion of my stocks (2% to 3%) and gamble on a stock that has the potential to really change things in its industry.”
- “Mega Millions and Powerball lotteries when jackpot exceeds $250 million.”
- “In Las Vegas, slots and roulette (though they are probably the two best games for the house).”
- “Living another year!”

Bullish: 28.0%, down 6.0 points
Neutral: 31%, no change
Bearish: 41%, up 6.0 points
Bullish: 38.5%
Neutral: 31.0%
Bearish: 30.5%
Local Chapter Meetings

October 18, 2018 Actionable Steps for the Current Market
October 11, 2018 It’s Been a Tougher Year Than the Headline Numbers Suggest
October 4, 2018 Diversification Cushions the Blow of Drawdowns, But at a Cost
September 27, 2018 Increasingly, Just One Analyst Is Behind a Stock’s Long-Term Earnings Forecast

