


Related

AAII How-To
Screens based on upward revisions have shown a historical ability to identify potential outperformers.
by John Bajkowski | June 2026

Earnings play a pivotal role in both a company’s long-term viability and its investment prospects. Because the market is forward-looking, stock prices are driven by expectations for a company’s future performance. As those expectations change, or prove inaccurate, stock prices adjust accordingly. Even modest shifts in earnings expectations can have a meaningful impact on a stock’s price.
Both positive and negative revisions to analysts’ earnings estimates, along with earnings surprises—reported results that come in above or below expectations—can have lasting effects on stock performance. As a result, tracking analysts’ earnings estimate revisions and earnings surprises can be a rewarding investing strategy.
Earnings per share (EPS) estimates involve the interaction of many company, industry and economic forces. They embody an analyst’s opinion of factors such as sales growth, product demand, competitive industry environment, profit margins and cost controls.
Earnings are a key variable used to value stocks; as a result, slight changes in expectations for future earnings or the earnings growth rate often leave a significant and lasting impact on stock prices.
Tracking the earnings estimates made by analysts and the adjustments in those estimates is an important component of stock analysis.
There are several firms that track and analyze earnings estimates. Services such as S&P Global Market Intelligence, I/B/E/S, FactSet and Zacks Investment Research provide consensus earnings estimates by tracking the estimates of thousands of investment analysts. Tracking these expectations and their changes can help investors identify stocks likely to outperform or underperform in the future.
When using earnings estimates, it is important to remember that a stock’s current price typically reflects the consensus estimate. As a result, it is not unusual to see a stock decline even after reporting higher earnings than in the previous reporting period. In many cases, the actual earnings increase simply falls short of what the market had expected.
Earnings surprises occur when a company reports actual earnings that differ from consensus analyst estimates.
Most companies announce earnings within approximately three to six weeks following the end of each quarter. During earnings season, investment news outlets provide daily coverage of earnings announcements, often highlighting companies reporting significant earnings surprises.
Positive earnings surprises occur when a company reports actual earnings that are significantly above analysts’ forecast earnings per share. Negative earnings surprises occur when reported earnings per share fall significantly below expectations. Companies reporting significant positive earnings surprises often experience above-average stock performance, while firms with negative earnings surprises frequently see below-average stock performance.
Stock price changes resulting from an earnings surprise are often felt immediately, but the effects can also persist over the long term. This is because analysts often don’t fully adjust their projections for future quarters based on the factors influencing current results. Studies indicate that the impact of an earnings surprise can persist for as long as one year after the announcement.
This means that it may not make sense to buy a stock after the initial price decline due to a negative earnings surprise. There is a reasonable expectation that the stock will continue to underperform the market for some time. Conversely, the persistent impact of a positive earnings surprise suggests that it may not be too late to invest in an attractive company after a better-than-expected earnings report has been released.
Not surprisingly, the prices of large companies tend to adjust to earnings surprises more quickly than those of small companies. Larger firms are followed by more analysts and portfolio managers, who often react rapidly to new information. Companies reporting significant quarterly earnings surprises also frequently experience additional surprises in subsequent quarters, reflecting continued analyst misjudgments. When a company reports a meaningful surprise, it is often a sign that similar surprises may follow.
Since both positive and negative earnings surprises—and the earnings estimate revisions that follow—have lingering long-term effects, a rewarding investing strategy may be one that avoids stocks that have negative earnings estimate revisions or have reported lower-than-expected earnings. Selecting stocks with positive earnings estimate revisions and positive earnings surprises before and even after the earnings are announced may be profitable. Even a strategy of simply selling after negative earnings surprises and buying after positive earnings surprises probably has some merit.
AAII tracks a series of separate screens that look for companies with recent estimate revisions. The screens are basic and simply focus on revisions to current and next fiscal-year estimates without any additional fundamental or price-momentum-based considerations.
The AAII screens focus on two types of revisions:
Two additional filters require a minimum 5% estimate change for both the current and next fiscal year in order to see if significant upward or downward revisions have a greater impact on stocks.
These four screens are available to all AAII members through the Investor Hub section of AAII.com. A+ Investor and Stock Investor Pro subscribers can customize the screens through the AAII Custom Stock Screener and Stock Investor Pro, respectively.
The criteria used for these analyst revisions screens are listed in the box at the end of this article.
AAII tracks more than 50 stock screening methodologies on AAII.com and reports both the companies passing each screen and the performance of simple hypothetical portfolios invested in those passing companies.
Figure 1 highlights the performance of the four estimate revisions screens. Over the long term, stocks with upward earnings estimate revisions have clearly outperformed those experiencing downward revisions, although periods of economic transition can occasionally reverse these relationships in the short run. Changes in stock prices resulting from an earnings estimate revision are usually felt immediately, but there is some persistence to the impact. The estimate revisions screens highlight companies after their initial monthly estimate revisions. Even though the greatest impact on stock price was probably in the month the revisions took place, the impact of the revision was still felt in model portfolios that compared the current consensus estimate to that of the previous month.
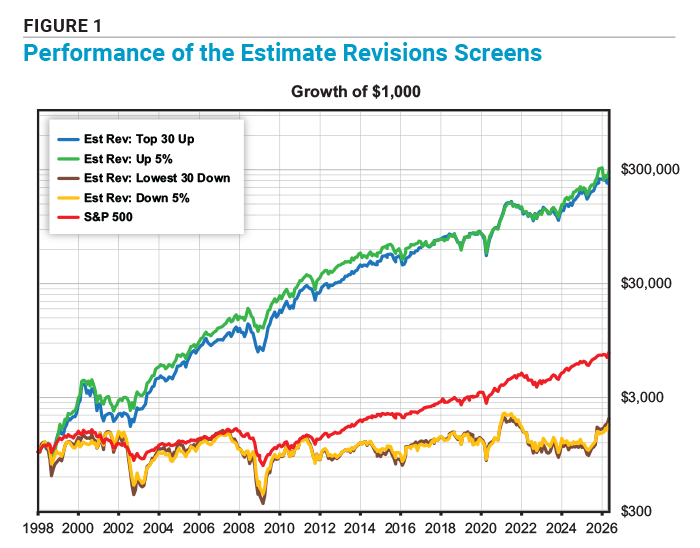
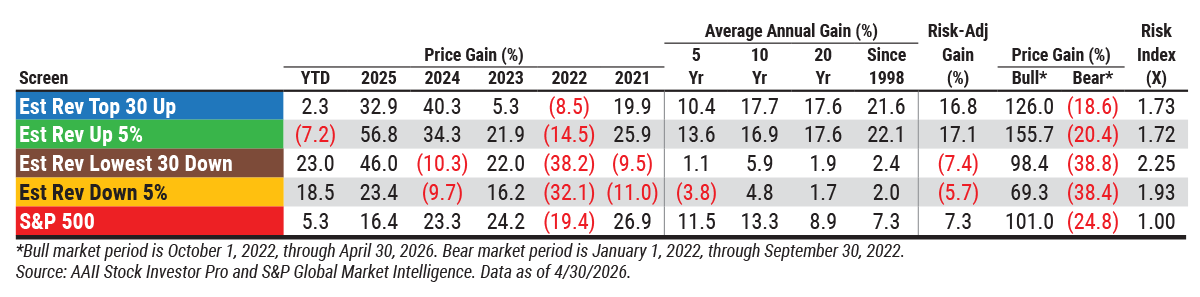
Both upward revisions screens have outperformed the large-cap S&P 500 index since their inception at the start of 1998. As Figure 1 shows, the Estimate Revisions Top 30 Up and Estimate Revisions Up 5% screens generated compound annual price returns of 21.6% and 22.1%, respectively, from January 1998 through the end of April 2026, compared to an average annual gain of 7.3% for the S&P 500 over the same period. In contrast, the Estimate Revisions Lowest 30 Down and Estimate Revisions Down 5% screens posted annual gains of just 2.4% and 2.0%, respectively, over the same period. These figures exclude dividends; total returns would have been higher if dividend payments were included.
Notably, however, companies experiencing downward revisions posted strong gains in 2025 and over the current year as of April 30, 2026, a period marked by sudden and unexpected economic shocks tied to evolving trade policies and the Iran war. Even so, the Estimate Revisions Up 5% screen has produced positive annual returns in 76% of calendar years, compared to 59% for the Estimate Revisions Down 5% screen. The Estimate Revisions Up 5% screen has also outperformed the S&P 500 in 75% of calendar years, while the Estimate Revisions Down 5% screen has outperformed the index in only 36% of years.
As shown in Table 1, the stocks that currently have upward revisions of 5% or above have a higher median price-earnings (P/E) ratio (42.2) than the typical exchange-listed stock (20.0) or S&P 500 constituent (25.2). In general, stocks with upward revisions are currently trading with higher multiples than those with downward revisions.
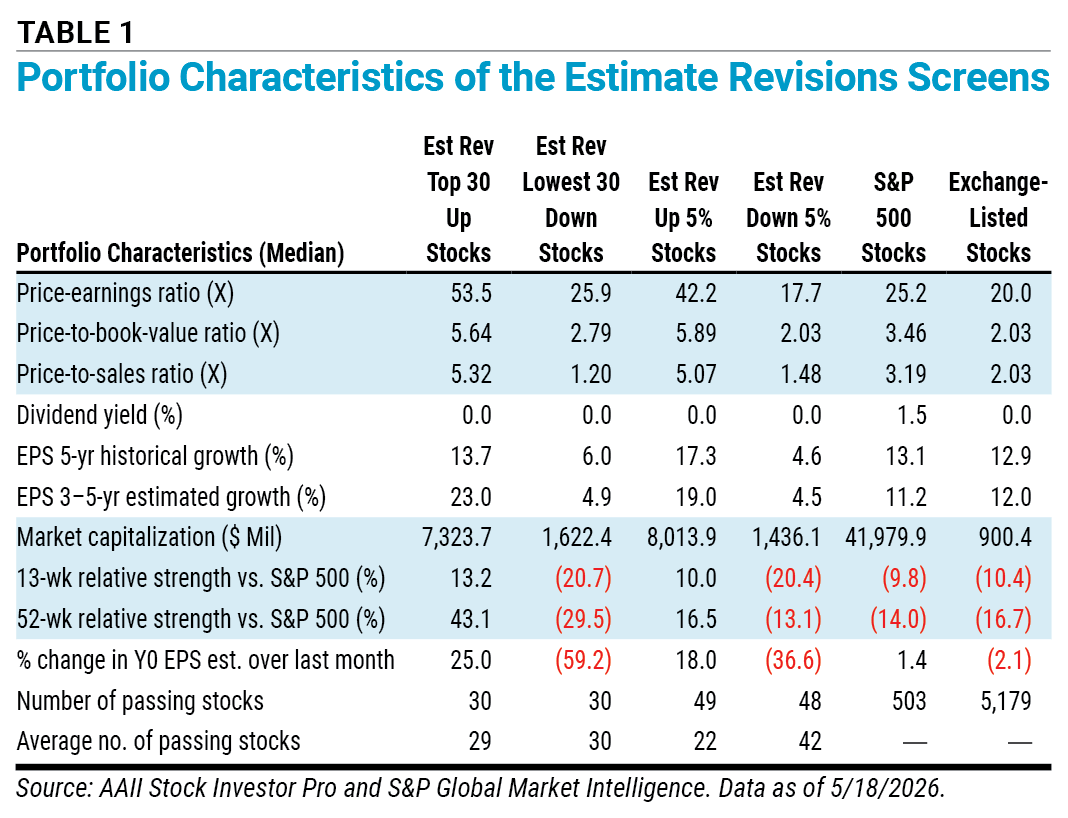
Stocks with upward revisions generally have higher historical and expected earnings growth rates than stocks with downward revisions or even the typical exchange-listed stock.
The estimate revisions screens seek out companies with at least five analysts providing estimates, so it is not surprising that they tend to be larger than the typical exchange-listed company. It is interesting to see that the current groups of companies with upward revisions have larger median market capitalizations than the groups of companies with downward revisions.
Most of the stocks with upward estimate revisions also have strong relative price strength over the last 13 and 52 weeks.
Given the nature of the criteria for these screens, it is not surprising to see that the stocks passing the upward revisions screens have positive average percentage increases in current fiscal-year earnings estimates over the last month, while the downward revisions stocks have had large declines over the same period.
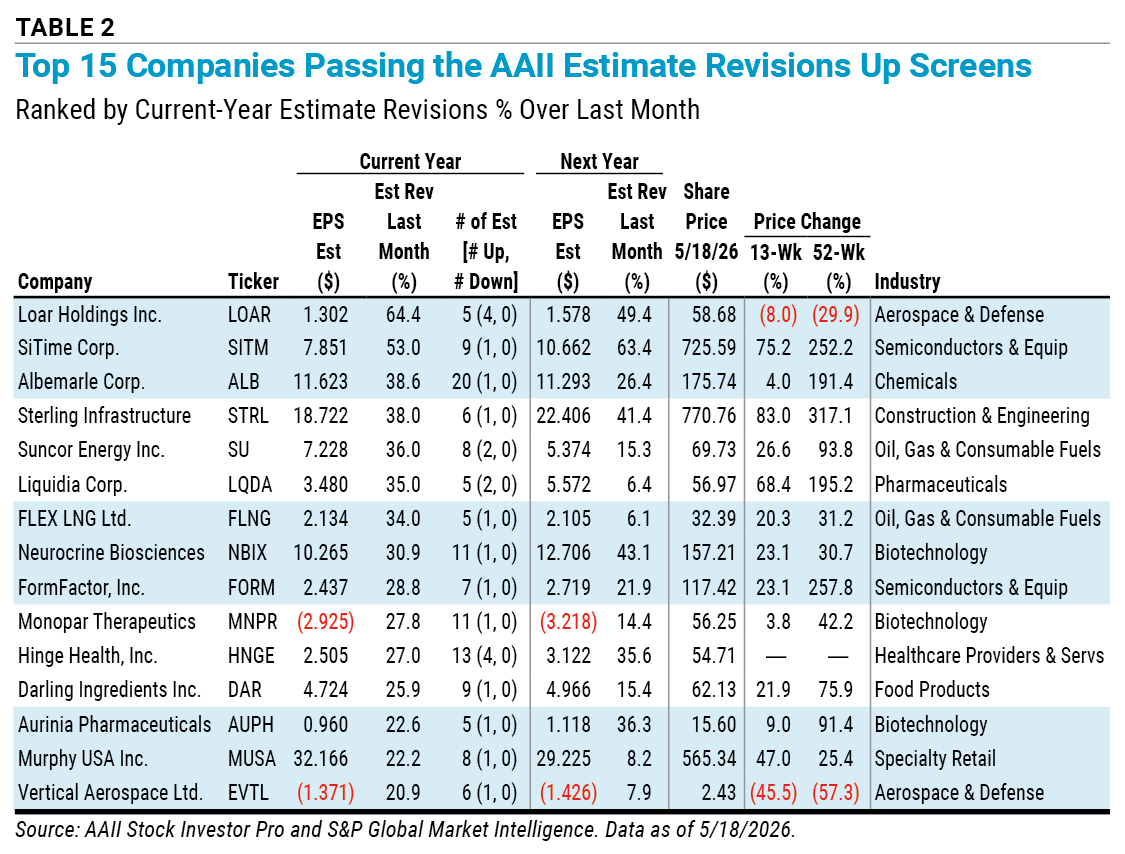
Among the stocks in Table 2 with the highest upward revisions, aerospace and defense component firm Loar Holdings Inc.  (LOAR) had the largest percentage increase in its current fiscal-year earnings estimate over the past month at 64.4%. The consensus estimate increased from $0.792 to $1.302 per share. Additionally, the company had a 110.2% earnings surprise during its latest quarterly report in May 2026. Generally, technology, energy, defense and biotechnology companies dominate the list of companies with large upward revisions.
Go to All Screens for an updated list of stocks passing these screens.
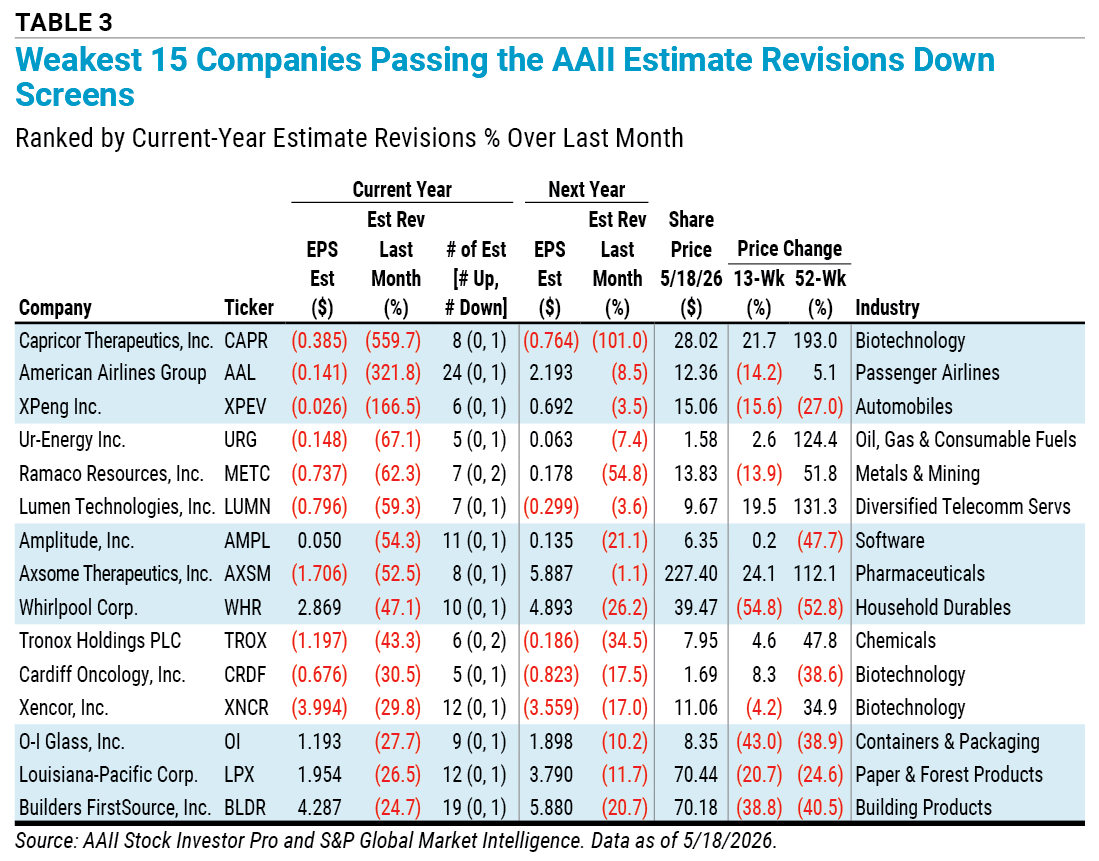
When looking at the stocks in Table 3 with the lowest revisions, American Airlines Group Inc. (AAL) had the second-largest percentage decrease in its current fiscal-year earnings estimate over the past month at –321.8%. The consensus estimate went from a loss of $0.033 to a loss of $0.141 per share. The company’s first-quarter 2026 earnings actually topped the consensus estimate: American Airlines reported a loss of $0.40 per share, while analysts were expecting a loss of $0.46 per share. Most of the stocks with the largest downward revisions are expected to post a loss this year, but half of those with negative current-year expectations are expected to return to profitability next year.
While the upward estimate revisions screens have shown promising results over the long term, it is important to note that they are only first cut screens. They do not examine issues such as financial strength or liquidity. Instead, they highlight the importance of changes in expectations and their impact on stock prices, as well as the potential benefit of adding an earnings estimate revisions consideration to a more robust set of filters.
AAII How-To



MANJUNATH S from CA posted 2 months ago:
BARRY J from TX posted 2 months ago:
Vinod N from MA posted 2 months ago:
You need to log in as a registered AAII user before commenting.
Log InCreate an account