

Related

AAII Stock Ideas
Why revisions to earnings estimates are important and where you can find revisions data and tools on AAII.com.
by Sam Levine | June 2026

Positive revisions to analyst consensus earnings estimates can point you toward stocks experiencing business momentum that is better than the market expects or alert you to a company that is performing worse than its stock price currently implies.
I explain why revisions to earnings estimates are important to investors. Then, I discuss how AAII’s Earnings Estimate Revisions Grade is calculated and provide insights on how to use revisions in your investing strategy. Lastly, I show you several places on AAII.com where you can find earnings estimate data and tools.
A stock’s current price reflects the market’s expectations for future cash flows. If a company’s cash flows are certain, all else being equal, the stock price should stay constant.
In reality, companies’ fortunes continually evolve as they roll out new products, their customers’ preferences shift and their cost structures change. One of the most important jobs for stock analysts is to forecast the future earnings of each stock they cover.
As analysts uncover new information about the companies they follow that they think will drive profits higher or lower, they will raise or lower their earnings forecasts for upcoming quarters or fiscal years. Every analyst following a particular stock will use their own method to forecast earnings, leading to a range of estimates. When an analyst revises their estimate higher, it is a statement that they expect the company to be more profitable (or lose less money) than before.
Financial data companies, such as S&P Global Market Intelligence, compile analysts’ earnings estimates, average them and then publish a consensus estimate. That consensus estimate represents the earnings per share that analysts, on average, expect a company to report. Many investors use consensus estimates to calculate price targets for the stocks they follow.
Companies may surprise the market by reporting earnings that are higher or lower than the consensus estimate at the time of the release. A surprise compels investors to reevaluate their expectations for the stock. Reporting earnings below the consensus estimate can lead to a dramatic drop in stock price, so companies often subtly guide analysts toward estimating earnings that are one or two pennies below what their own internal analyses project. It is not unusual for companies to report earnings that are only slightly above the consensus estimate.
When a company reports earnings that deviate from the consensus estimate by a significant margin—and especially if it does so consistently—it is a signal that analysts are overlooking important information about the company.
One might think that stock prices would adjust quickly to earnings surprises, but that is not necessarily the case. AAII has found that the impact can last as long as a year, with the effects of negative surprises tending to last longer than those of positive surprises. Also, the stock prices of larger firms tend to react more quickly to surprises than those of smaller firms, likely because larger firms have broader investor interest and analyst coverage.
The Earnings Estimate Revisions Grade judges both analysts’ estimate revisions and the size of the difference between reported earnings and the consensus estimate by evaluating four factors. Stocks that report earnings significantly higher than the consensus estimate and have their consensus estimate increase will receive a higher Earnings Estimate Revisions Score than companies that either meet or fail to match expectations and have their consensus estimate lowered.
A stock’s Earnings Estimate Revisions Grade reflects the quintile in which it ranks, based on its score, when compared against all other stocks in AAII’s universe. More than 3,500 companies have earnings estimates for their current fiscal year. The grade ranges from A (very positive) to F (very negative).
Positive earnings estimate revisions are associated with stock outperformance. The Estimate Revisions Up 5% and Estimate Revisions Top 30 Up screens have among the highest long-term returns of all AAII Stock Screens [see the AAII Stock Ideas article in this issue for more on these screens]. Likewise, earnings estimates revised lower are closely associated with below-average performance. A 2024 FactSet study found that stocks with positive surprises enjoyed an average 1.0% price increase over the two days before and after the earnings release, while the prices of stocks with negative surprises decreased an average of 2.3% over the same four-day period.
The Earnings Estimate Revisions Grade uses the standardized unexpected earnings (SUE) score, which measures how surprising an earnings beat or miss actually is. The SUE score considers both how widely dispersed analysts’ estimates are and the magnitude of the difference between the actual earnings and the estimates. A reported earnings number that is significantly higher than a consensus estimate drawn from a tight range of forecasts is more compelling than a report that only slightly beats a consensus estimate drawn from a broad range of forecasts. The SUE score standardizes earnings surprises so stocks that report earnings around $0.10 per share can easily be compared with stocks reporting earnings of $10.00 per share.
The four factors used to determine the Earnings Estimate Revisions Grade are:
Earnings estimates for the current quarter, the current fiscal year and the next fiscal year can be found on AAII’s Stock Evaluator pages. Simply type a company’s name or ticker symbol into the search box located at the top of most pages on AAII.com, and then scroll down to the Financial Summary section. A+ Investor and AAII Platinum subscribers can view the Earnings Estimate Revisions Grades and Scores by clicking on the Grades tab in the Evaluator. The Earnings tab provides even more detail.
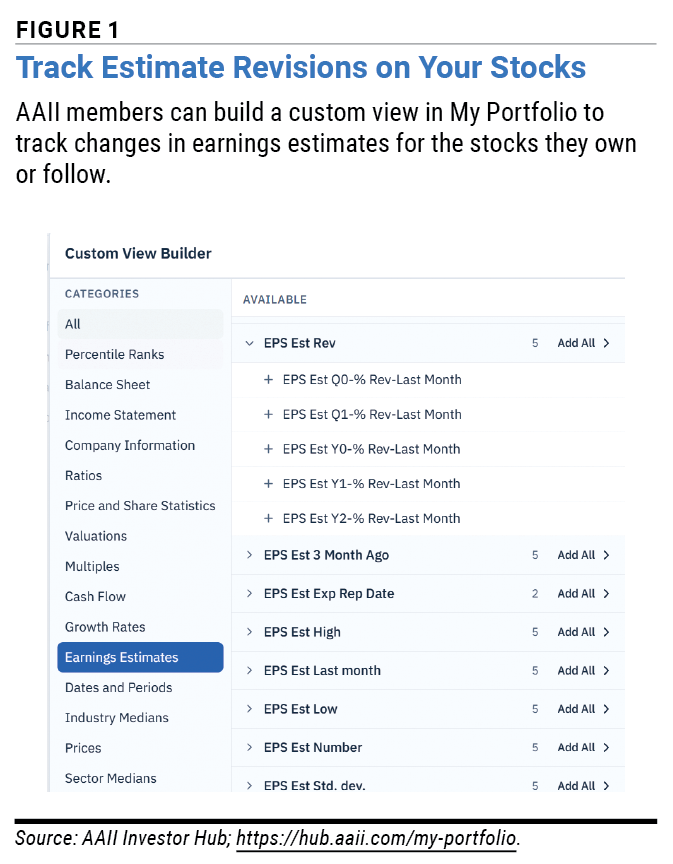
All AAII members can also create a custom view in My Portfolio to view earnings estimates on the stocks they own or are tracking (Figure 1). After you have created a portfolio, click on the View drop-down menu above your holdings, then choose Create Custom View. Select Earnings Estimates from the list of categories, and choose up to five data fields to display. (There is no data field limit for A+ Investor and AAII Platinum subscribers.)
The AAII Custom Stock Screener, available to A+ Investor and AAII Platinum subscribers, allows you to screen not only by the Earnings Estimate Revisions Grade but also the components that comprise it (Figure 2). You can also add additional criteria such as growth rates, valuation ratios and indicators of fundamental strength.

AAII’s helpful artificial intelligence (AI) agent James can give you the Earnings Estimate Revisions Grade for a specific stock. In the AAII Investor Hub, simply click on the small Ask James bubble in the lower-right corner of the screen.
AAII Stock Ideas

First Cut Stocks


No comments have been added yet. Add your thoughts to the discussion!
You need to log in as a registered AAII user before commenting.
Log InCreate an account