


Related

First Cut Stocks
Combining the criteria behind multiple grades provides more robust analysis than relying on a single factor.

Charles Rotblut leads a class in AAII's new Essential Investing Video Course. Go to https://www.aaii.com/ves for more information and to subscribe.
The AAII A+ Investor Stock Grades evaluate stocks across five key investment factors: value, growth, momentum, earnings estimate revisions (and surprises) and quality. The grades are based on percentile rankings that compare each stock against all other stocks in the AAII universe of over 6,600 companies. A stock in the 85th percentile for its Value Grade is cheaper than 85% of all other stocks. Grades are distributed evenly, with the top 20% of stocks receiving A’s, the next 20% receiving B’s and so on through F’s for the bottom 20%.
The quantitatively calculated letter grades are available to A+ Investor and Platinum subscribers, but all AAII members can see the many of the key measures underlying those grades. The AAII Stock Evaluator provides percentile rankings for valuation and growth metrics, with many key financial metrics available in the Snapshot, Ratios and Financials tabs. To access the Stock Evaluator, simply type a company’s name or ticker symbol into the search box at the top of most AAII.com pages.
This article shows the metrics that are used to calculate each of our grades and explains how you can use those metrics to determine whether or not a stock is attractive.
Value investors seek to buy stocks trading below their intrinsic value.
The Value Score combines six valuation metrics to arrive at the Value Grade. Valuation ratios can differ by industry. Technology companies might show high price-to-book-value (P/B) ratios, while homebuilders often trade at much lower price-to-book ratios. The Value Grade considers the average of all six ratios to capture the overall valuation picture.
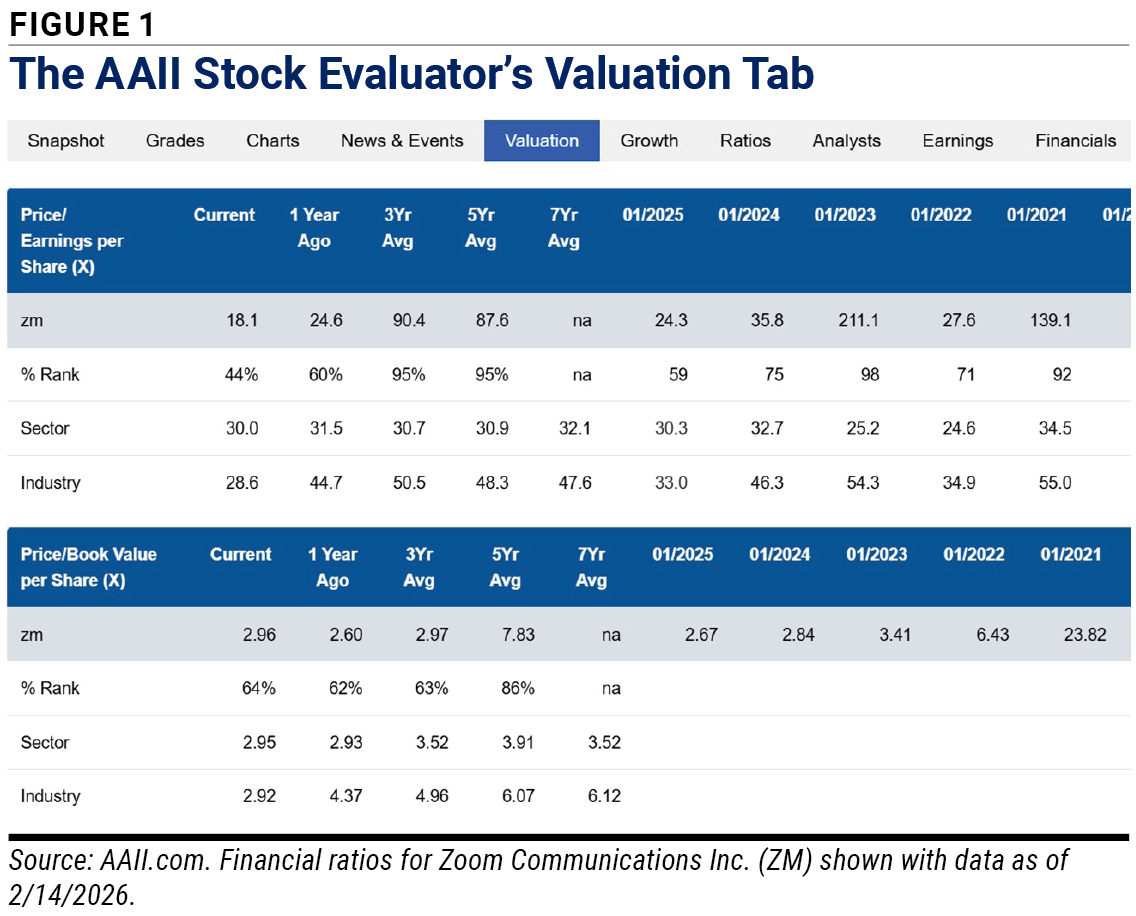
You can see all six ratios and their percentile rankings in the Valuation tab of the Stock Evaluator (Figure 1). Lower percentiles indicate better value.
Academic and industry research shows that portfolios of stocks with valuations ranking in the lowest 40% tend to outperform over the long term. Like other styles, value experiences periods of both outperformance and underperformance. Under all environments, value stocks tend to trade at prices that provide more upside should their results be better than expected.
The Growth Grade emphasizes the notion that “slow and steady wins the race.” Companies growing at extremely high rates attract competition or face saturation. When growth slows, stock prices typically fall.
The Growth tab of the Stock Evaluator provides percentile rankings for growth trends. There are three metrics used to calculate the Growth Score.
Growth investors should seek out companies that have a year-over-year sales growth ranking between the 40th and 79th percentiles, a track record of growing sales and positive cash flow. Avoid stocks that have very high growth rates and/or are not turning sales into positive cash flow. [For more on the importance of cash flow, see the Stock Strategies article in this issue.]
Momentum investing capitalizes on the tendency of stocks with high relative strength to continue outperforming. It is based on two behavioral ideas: First, investors like stocks that are doing well, and second, rising prices signal expectations for the business to perform well.
The Momentum Grade is based on a Momentum Score that uses a weighted four-quarter approach, giving more weight to recent price performance (40% for the most recent quarter, 20% each for the prior three quarters). Our research found that this approach works better than looking at only the past 13 weeks or considering 52-week relative performance on an unweighted basis.
The Stock Evaluator’s Snapshot tab shows the price change (52-week) metric along with its percentile ranking. This metric indicates whether the stock has positive momentum, but we also suggest clicking on the Charts tab to confirm that the stock has outperformed over the most recent 13-week (three-month) period. Additionally, you can judge a stock’s price performance against the broader market by clicking the Add Symbol button above the chart to add an index exchange-traded fund (ETF) to compare the stock against. Invesco Russell 1000 Equal Weight ETF  (EQAL), which equally weights the largest 1,000 U.S. stocks, can work well for such comparisons.
Price change rankings above the 80th percentile indicate very strong momentum. Those between the 60th and 79th percentiles show good momentum. The 40th to 59th percentile range indicates neutral momentum, and rankings below the 40th percentile signal weakness.
Check whether momentum is consistent across time frames. Strong 52-week performance combined with underperformance for the most recent 13-week period suggests fading momentum. Weak 52-week performance with improving three-month trends can signal turnaround potential.
Quality stocks possess underlying financial strength. Stocks exhibiting strong quality traits have reduced downside risk, while those with weak quality are risky.
The Quality Grade is based on a Quality Score that evaluates eight components. The Ratios tab of the Stock Evaluator lists values for many of the components underlying this grade (Figure 2). Percentile rankings for some of these metrics can be found in the Evaluator’s Snapshot tab.

Many of these individual metrics vary by industry and sector. What may be high for a manufacturer may not be high for a biotechnology company. Nonetheless, low numbers for several metrics are a reason for concern.
A consensus earnings estimate is the average of the earnings that covering analysts expect a company to report for any upcoming year or quarter. Unlike analyst recommendations, which are skewed toward buy or outperform ratings, earnings estimates reveal whether analysts view a company as performing better or worse than previously expected.
Revisions to earnings estimates can drive stock performance. AAII’s earnings estimate screens that focus on stocks with upward revisions historically have some of the highest total and risk-adjusted returns among all the AAII Stock Screens tracked. Our earnings estimate screens that focus on stocks with downward revisions have had among the worst long-term performance.
The Earnings Estimate Revisions Grade examines four components.
The Snapshot tab shows the current consensus estimate along with the estimates from one month ago and three months ago. A+ Investor and AAII Platinum subscribers can access the Earnings tab to see several quarters of earnings surprise history.
Combining the criteria behind multiple grades provides more robust analysis than relying on a single factor.
Quality, momentum and earnings estimate revisions can be overlayed on any strategy. Value strategies pair well with momentum and quality characteristics. Technical analysis is enhanced when watchlists include stocks with strong quality traits and positive earnings estimate revisions.
Growth investors should emphasize sustainable growth and strong underlying quality. Growth at a reasonable price (GARP) investors are encouraged to combine both Growth and Value Grade components. Doing so will reduce the odds of overpaying for sustainable growth.
Most of the underlying components of the A+ Grades can be accessed in the Stock Evaluator. A+ Investor and AAII Platinum subscribers can see the actual grades and the factors driving those grades through the Grades tab of the Stock Evaluator. A+ Investor and AAII Platinum also provide subscribers with the ability to screen based on the A+ Grades via the Custom Screener and view the grades for all of the stocks held in your My Portfolio.
First Cut Stocks



DAVE G from TX posted 6 months ago:
You need to log in as a registered AAII user before commenting.
Log InCreate an account