


Related

Stock Strategies
Based on research into various components that reflect a company’s “quality,” we tweaked the quality grade for stocks.

Wayne Thorp leads a class in AAII's new Essential Investing Video Course. Go to https://www.aaii.com/ves for more information and to subscribe.
There is a substantial amount of research that illustrates the merits of investing using quality factors to judge stocks. Therefore, AAII included a quality rating as part of its A+ Investor service, which also grades stocks on value, growth, momentum and earnings revisions.
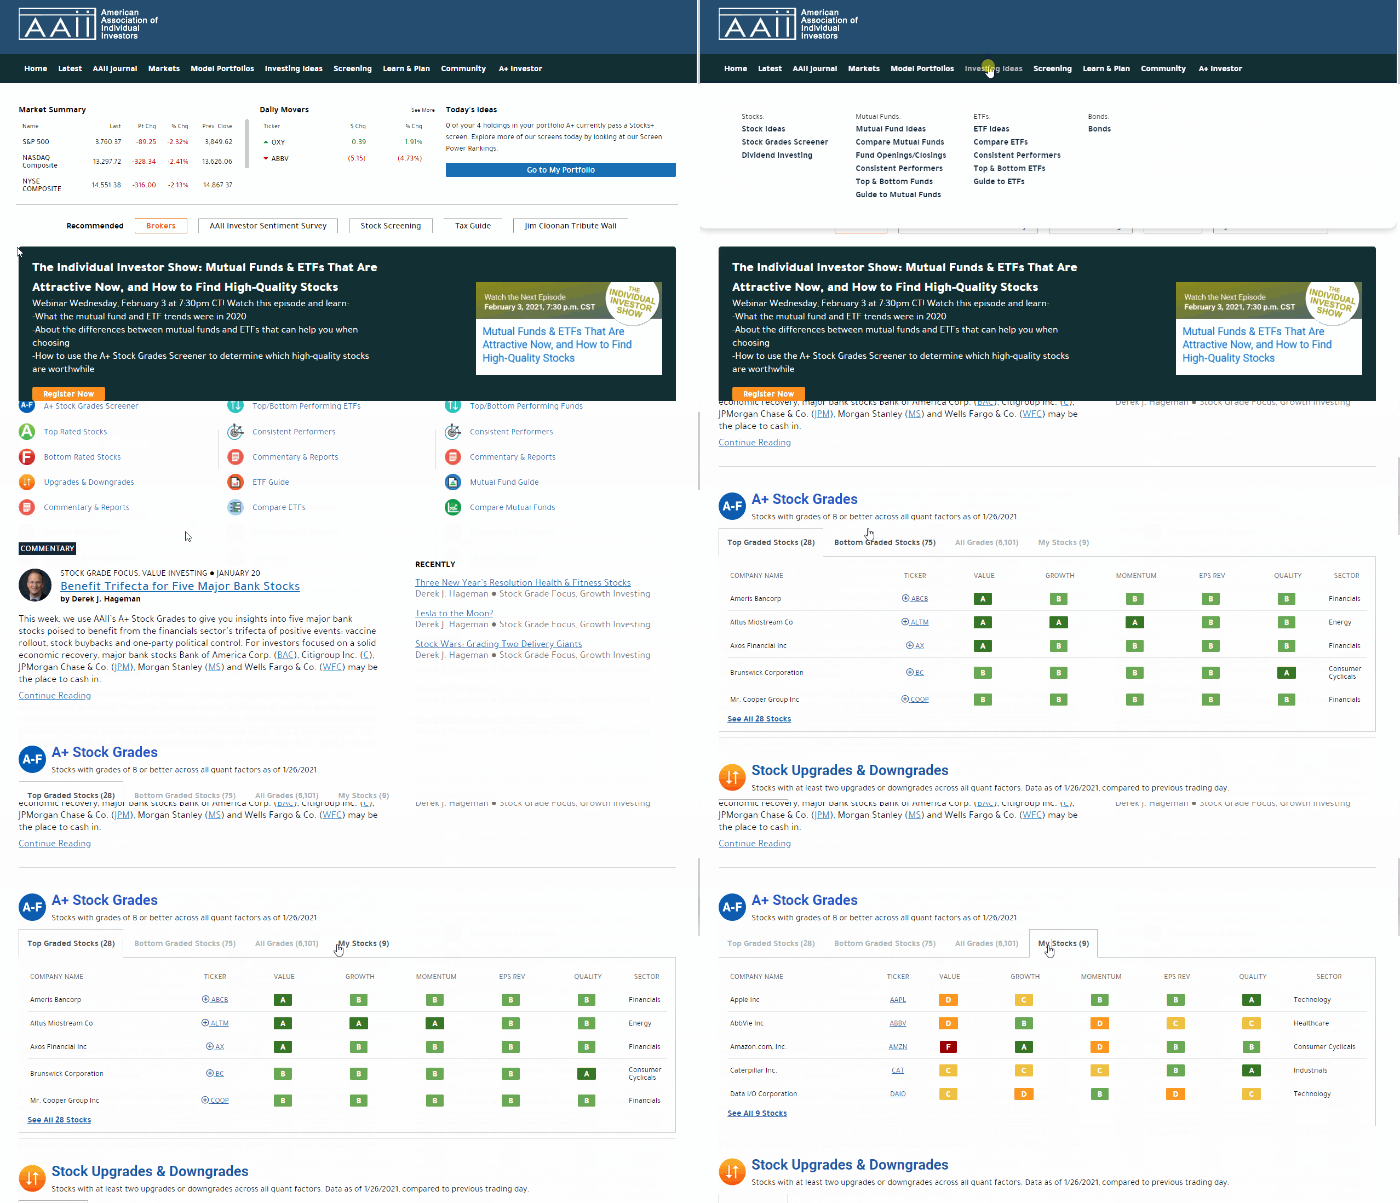
Available to all AAII members, the Investing Ideas page of AAII.com notes if any stocks have consistently high or low grades for quality, as well as for the other four factors, and separately reveals stocks that have had significant changes to their grades. In addition, any member who sets up a portfolio of stocks using My Portfolio can view their A+ grades by clicking on the My Stocks tab of the Stock Grades table at the Investing Ideas page (Figure 1). There’s also a tab to see which of your stocks have had changes to their grades at the Stock Upgrades/Downgrades table.
There are several measures of quality that both academic research and real-world results have shown to generate market-beating returns. Late last year, we rolled out a new methodology for arriving at the A+ Quality Grade.
Previously, the Quality Grade used a combination of five components to assess the “quality” of a particular stock. A higher quality stock possesses traits associated with upside potential and reduced downside risk. The components of the prior Quality Grade calculation considered management’s financial decisions (accruals and change in asset turnover), whether the interests of shareholders are being recognized (share buybacks and dividends) and whether analysts are more optimistic than they were previously about the stock (earnings estimate revisions).
Figure 1. See Grades for Your Stocks
The new A+ Quality Grade is the percentile rank of the average of the percentile ranks of return on assets (ROA), return on invested capital (ROIC), gross profit to assets, buyback yield, change in total liabilities to assets, accruals, Z double prime bankruptcy risk (Z) and F-Score. The score is variable, meaning it can consider all eight measures or, should any of the eight measures not be valid, the remaining measures that are valid. To be assigned a Quality Score, stocks must have a valid (non-null) measure and corresponding ranking for at least four of the eight quality measures.
We made these changes based on research into various components that reflect a company’s “quality.” To ensure the validity of the factors used for the revised Quality Grade, we also backtested the results of the new scoring system across all letter grades (A to F) for the period of 1998 through 2019.
As we would expect, moving from Quality Grades of F to D to C to B to A resulted in better cumulative returns for each higher grade. Even between Quality Grades of A and B, the higher letter grade outperformed the lower by more than a factor of four.
Return on assets (ROA) is an indicator of how profitable a company is relative to its total assets. ROA offers an indication of how efficient a company’s management is at using its assets to generate earnings. The higher the ROA number, the better, because the company is earning more money on less investment in assets.
Return on assets is determined by dividing net income for the most recent 12 months by total assets and is displayed as a percentage.
Return on invested capital (ROIC) is a profitability measure that calculates the profit that a company generates from long-term sources of company funding that have provided capital. Invested capital can be provided by both bondholders and shareholders. Subpar ROIC can suggest poor capital allocation or an inability by management to deploy capital effectively.
For the purposes of the Quality Grade, the numerator of the equation measures a company’s earnings before interest and taxes (EBIT), also referred to as operating income, while the denominator measures the sum of net working capital and net fixed tangible assets. ROIC is displayed as a percentage.
A company’s gross profit is calculated by subtracting the cost of goods sold (COGS) from sales to arrive at gross income. This figure is then divided by total assets.
Gross income represents the amount of profit a company earns by selling its products or services. Cost of goods sold is the cost a firm incurs by manufacturing or producing an item, such as material and direct labor costs. Gross profit reflects a firm’s basic pricing decisions and its material costs. The greater the gross profit and the more stable it is over time, the greater the company’s expected profitability.
By comparing gross profit to assets, investors are getting a snapshot as to whether the firm’s assets are profitable. Since the profitability test is measured so near the top line, it is considered a very clean measure of economic profitability. Generally, the higher the gross-profit-to-assets ratio, the better.
A stock’s buyback yield is determined by comparing the average shares outstanding of a fiscal period with the average shares outstanding of another fiscal period. In this case, we are comparing the average shares outstanding for the latest fiscal quarter to the average shares outstanding in the same fiscal quarter a year ago.
According to economic theory, an investor should be indifferent to dividends or buybacks. Dividends return cash to shareholders. Buybacks increase ownership, giving shareholders a bigger claim to future earnings and larger dividend payments—assuming dividend payout ratios are unchanged and net income is essentially stable.
The percentile rank notes the percentage of buyback yield in the universe of domestically traded companies with a buyback yield that is equal to or lower than it. For example, a buyback that is greater than 75% of the stocks with a valid buyback yield is said to be in the 75th percentile, where 75 is the percentile rank. The higher the percentile ranking a company has for buyback yield, the greater the percentage of shares outstanding it has repurchased over the last year.
To arrive at the change in total liabilities over the last year, the ratio compares the level of total liabilities of a company for the latest quarter to that of the same quarter a year ago. The difference is then divided by total assets for the last fiscal quarter and is presented as a percentage.
Dividing the net change in total liabilities by total assets “scales” it by company size, making it comparable across companies. The higher the percentile ranking a company has for the change in total liabilities scaled by assets, the greater the decline in total liabilities relative to assets over the last year. The percentile rank ranges from 0 to 100, with 0 signaling the least favorable and 100 signaling the most favorable.
This ratio tracks the difference between net income and income from operations over the last 12 months (net income minus cash from operations) and then divides that difference by the total assets for the last quarter.
Accrual accounting requires transactions to be recognized based on when they occur as opposed to when cash changes hands.
It is preferable for a company to have cash flow from operations that is greater than net income before extraordinary items (making this ratio negative). The measure tries to avoid firms making accounting adjustments to earnings in the short run that may weaken long-term profitability.
Dividing accruals by total assets “scales” it by company size, making it comparable across companies. The higher the percentile ranking a company has for the accruals-to-total-assets ratio, the more persistent a company’s earnings are perceived to be. The percentile rank ranges from 0 to 100, with 0 signaling the least favorable and 100 signaling the most favorable.
This measure was developed by Edward Altman, a professor emeritus at New York University’s Stern School of Business. He created the Z-score model to assess the financial riskiness of a company. The original model was based on balance sheet, income statement and stock price data for publicly traded manufacturing companies. A new model, Z double prime was developed for not only private companies but also companies in other industrial sectors like retail, wholesale, service, energy and public utilities.
Z double prime is calculated using four financial ratios: working capital to total assets, retained earnings to total assets, earnings before interest and taxes to total assets and book value of equity to book value of total liabilities. The higher the percentile ranking a company has for Z double prime, the less apt it is to face insolvency. The percentile rank ranges from 0 to 100, with 0 signaling the least favorable and 100 signaling the most favorable.
The F-Score is a discrete score from 0 to 9 that reflects nine criteria used to determine the strength of a firm’s financial position. The F-Score was created by University of Chicago Professor Joseph Piotroski, who devised the scale according to specific aspects of a company’s financial statements. The F-Score was originally developed to determine the best value stocks, with a score of nine being the best and zero being the worst.
For every criterion met, one point is awarded; otherwise, no points are awarded. The points are then added up to determine the highest level of financial strength. The nine criteria are: return on assets, operating cash flow, change in return on assets, accruals, change in leverage, change in liquidity, equity offering, change in gross margin and change in asset turnover.
The higher the percentile ranking a company has for the F-Score, the higher the perceived financial strength of the company.
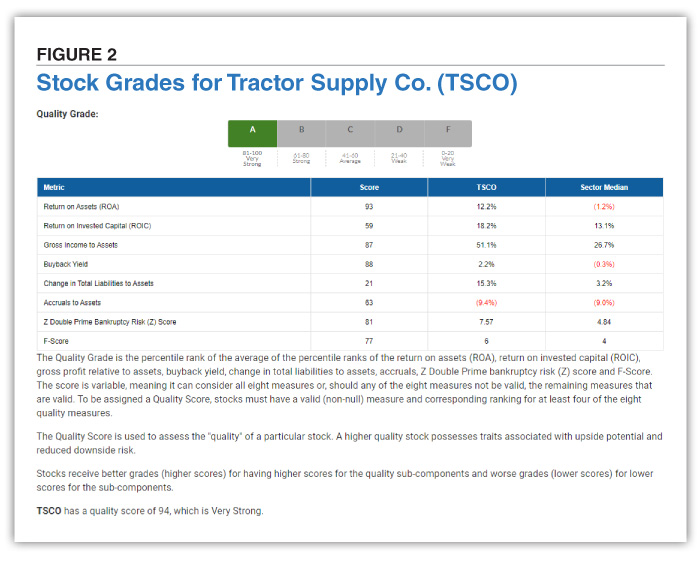
The expanded valuation measurements used for the Quality Grade taken from the Grades tab of the Stock Evaluator page for Tractor Supply Co.  (TSCO) are shown in Figure 2.
The “Score” for each of the eight variables used for the Quality Grade is the percentile rank for the company. So, for example, Tractor Supply ranks in the 93rd percentile for return on assets as of the close on Monday, January 25, 2021. The TSCO column shows the actual value for the company for each of the eight metrics. So Tractor Supply’s ROA was 12.2% as of the close on January 25. The Sector Median column displays the median values for the company’s respective sector. In the case of Tractor Supply, the median or midpoint ROA for the companies in its sector (other specialty retailers) was –1.2% as of January 25.
Beyond taking the average of percentile ranks for the eight variables now used for the Quality Grade, the final letter grade is based on the percentile rank of that average. For Tractor Supply, the average score for its eight quality variables is 71.1 as of January 25. To have a more uniform distribution of letter grades, however, we then take the percentile rank of the average score. So Tractor Supply’s average score of 71.1 ranks in the 94th percentile for all stocks in the A+ Investor universe as of January 25.
Stock Strategies

Feature


LARRY K from TX posted over 5 years ago:
CHARLES R from IL posted over 5 years ago:
BILL W from TX posted over 5 years ago:
You need to log in as a registered AAII user before commenting.
Log InCreate an account