

Related

Stock Strategies
Identifying low-quality stocks to avoid is one way to boost your chances for investment success.
by Wayne A. Thorp | July 2020

Wayne Thorp leads a class in AAII's new Essential Investing Video Course. Go to https://www.aaii.com/ves for more information and to subscribe.
As investors, we get a lot of information on what we should buy. There is much written and talked about “stock picking” but comparatively little about “stock elimination.” However, there is something to be said for knowing which investments to avoid as well.
While we usually try to buy stocks that we know will appreciate in value, investors who owned stock the likes of Enron Corp. would probably have seen notably better performance if they hadn’t owned it. Research from O’Shaughnessy Asset Management shows that between 1964 and 2015, using quality as a filter in the investment process could have improved annual returns by an average of 2.3% annually. For this reason, paying attention to a stock’s quality is a useful part of the analysis process.
The term “quality,” especially when it comes to investing, is a subjective term. There is a substantial amount of research that illustrates the merits of investing using quality factors. Quality often refers to companies with low debt, stable earnings growth and profitability. However, there is also research into quality that has found that “high quality” companies have higher returns on equity (ROE) or lower accruals (roughly measured as the difference between operating cash flow and net income).
Here are some measures of quality that both academic research and real-world results have shown to generate market-beating returns.
Accruals are revenues earned or expenses incurred, which impact a company’s net income on the income statement when cash related to the transaction has not yet changed hands. Accruals also affect the balance sheet, as they involve non-cash assets and liabilities. Accrual accounts include, among many others, accounts payable, accounts receivable, accrued tax liabilities and accrued interest earned or payable.
Accrual accounting introduces many interpretations and estimates by management into the financial statements. Decisions regarding the capitalization of expenses, the recognition of revenue, the creation of reserves against losses and write-off of assets are examples of just a few of the factors that may vary from firm to firm. Many of these issues are factors that relate to the quality of a firm’s earnings. Overly aggressive use of accruals can lead to future write-downs, hurting the stock’s price.
One measure of earnings quality examines the difference between a company’s cash from operations and its net income over the trailing 12 months.
Operating cash flow is a measure of the amount of cash generated by a company’s normal business operations. Operating cash flow indicates whether a company can generate sufficient positive cash flow to maintain and grow its operations; otherwise, it may require external financing for capital expansion.
One method of calculating operating cash flow is to start with net income and then make adjustments for non-cash expenses such as depreciation and changes in working capital, current assets and current liabilities such as accounts receivable and accounts payable.
From an earnings quality standpoint, when a company’s operating cash flow exceeds net income, earnings are more persistent. This means there are fewer adjustments to net income that reflect the accounting assumptions made by management. This, in turn, indicates a more conservative accounting approach, which is an indicator of higher quality.
Asset turnover is sales divided by average assets. This ratio shows how efficient management is at generating revenues from the company’s average assets, which is the average of total assets at the beginning and the end of a company’s fiscal year.
Asset turnover levels tend to fluctuate between industries. So, it is best to compare this metric across companies in similar industries or business lines. Alternatively, if you are comparing a broader collection of companies, looking for improvements in the asset turnover year over year would be a useful exercise. Improvements in the ratio imply greater efficiency, whereas a worsening suggests that the company may become less efficient in turning its assets into sales.
Companies with excess cash can pay out dividends as well as repurchase outstanding shares that have been issued to the public. When a company reduces the number of outstanding shares, remaining shares gain a slightly larger proportional claim to the company and its profits. This allows earnings per share to expand more quickly than net income. A share buyback can also signal to the market that management thinks the shares are attractively priced at current levels. Conversely, the issuance of shares dilutes the ownership percentage of existing shareholders.
The buyback yield is the change in average shares outstanding for the latest fiscal quarter relative to the average shares outstanding in the same fiscal quarter a year ago. For example, if a company had 40.0 million shares outstanding at the end of its latest fiscal year and this was down from 50.0 million shares outstanding at the end of the previous quarter, shares have declined by 20%. The 20% reduction in the number of shares is the buyback yield. A company that issues more shares will have a negative buyback yield.
Reductions in the number of shares outstanding increase the percentage ownership that each remaining share of stock outstanding represents.
Dividend growth examines the percentage change in dividends per share over a specific time period. This could be one quarter’s dividend compared to the dividend in the same quarter the previous year, the change in dividends from one fiscal year to the next, or an annualized growth rate over the last three-, five- or seven-year period, etc.
Initiating or raising a dividend has been associated with higher returns. Suspending or cutting a dividend has, in aggregate, led to significantly lower returns.
Earnings estimates are the consensus profit forecasts made available by brokerage analysts. Revisions to the average estimate of all analysts’ forecasts (the consensus estimate) have been shown to be short-term drivers of stock prices. Upward revisions signal that analysts are more positive about a company’s earnings prospects; downward revisions signal that analysts are more negative.
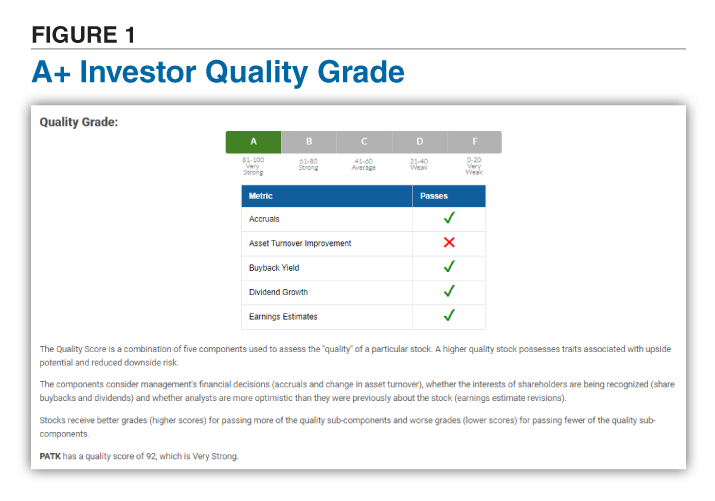
AAII provides quality ratings as part of its A+ Investor service. The quality grade ranks companies A through F based on management’s use of accruals, asset turnover improvement, earnings estimate revisions, buyback yield and dividend growth (Figure 1).
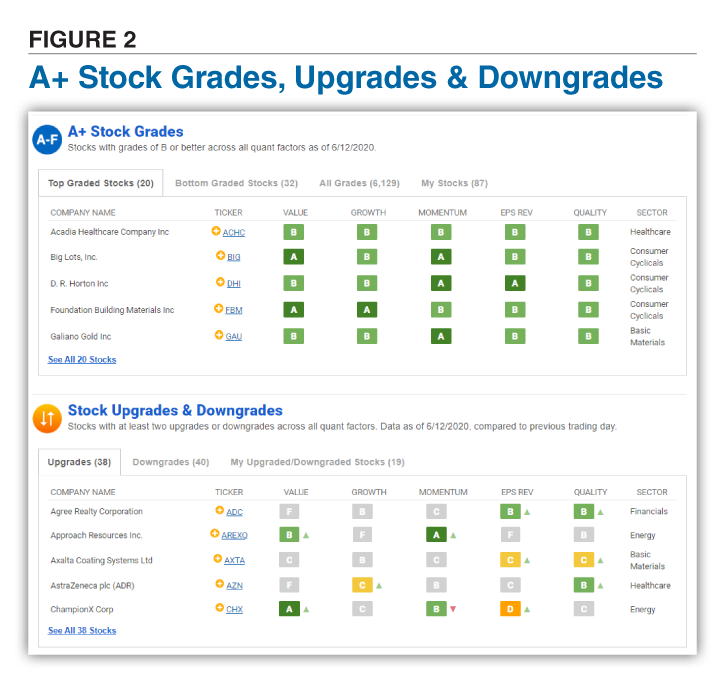
Available to all AAII members, the Stocks page of AAII.com notes if any stocks have consistently high or low grades across the many A+ Investor factors and separately reveals significant changes in their grades (Figure 2).
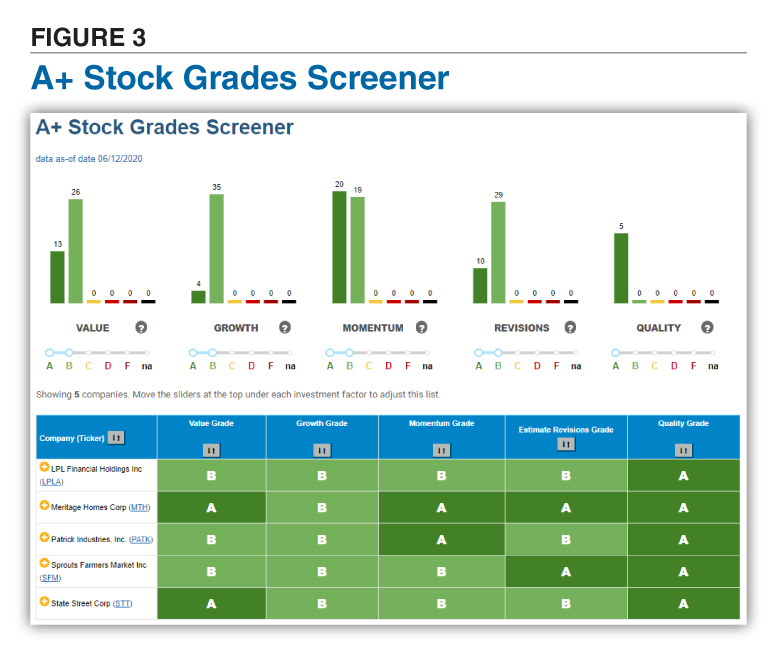
In addition, A+ Investor subscribers can use the Stock Grades Screener to weed out stocks of questionable quality based on the five factors (Figure 3).
There are two ways to develop a winning investment strategy. You can actively look for companies exhibiting qualities that, historically, have led to higher stock prices. Alternatively, you can avoid companies with characteristics that point to suspect quality. By not owning low-quality stocks, you also boost your chances for investment success.
Stock Strategies

Financial Statements

Stock Strategies

No comments have been added yet. Add your thoughts to the discussion!
You need to log in as a registered AAII user before commenting.
Log InCreate an account