



- Missing the market’s best and worst days significantly impacts long-term investment returns
- The Model Shadow Stock Portfolio follows strict selection criteria, focusing on small, undervalued stocks
- Quarterly reviews adjust holdings based on valuation, market cap and earnings
Belief that a so-called “Trump put” would protect the stock market evaporated by mid-March, as President Trump refused to rule out a recession and continues to modify and escalate tariff policies without presenting a clear long-term strategy.
Investors, consumers and businesses tend to pull back in an environment of uncertainty. Investors had bet strongly that Trump’s agenda to lower taxes and drive deregulation would fuel economic growth in a similar way to his first term, during which he frequently touted the stock market’s performance as a barometer of his success. It was widely assumed that the threat to increase tariffs was primarily a negotiating tactic to force other nations to lower their tariffs.
It can be challenging to stay calm when chaos ensues, yet maintaining a long-term perspective is the key to investing success. Corrections are a regular and expected part of the healthy market cycle. The key is to stay with your planned allocation and investing approach.
It may be tempting to think that you can improve your rate of return by getting out of the market during declines and jumping back in when the market improves. However, it has been shown that the best and worst trading days tend to be clustered together. Missing the worst days typically also means missing the best days. Six of the 10 best trading days of the market occurred within two weeks of the 10 worst trading days.
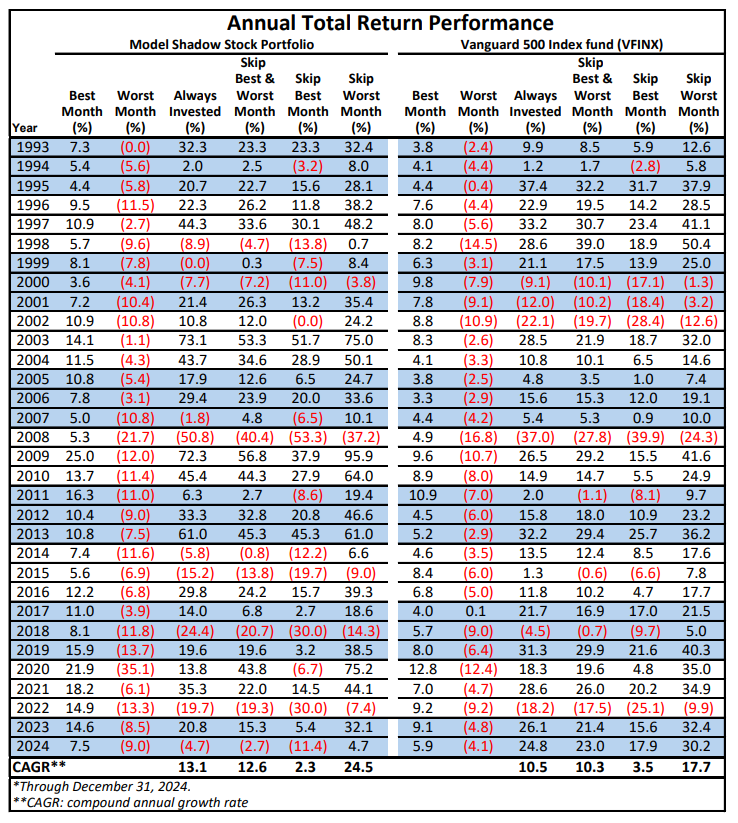
The Model Shadow Stock Portfolio has been in place for 32 complete calendar years through the end of 2024. If you were not invested during the best-performing month of each year over the history of the Model Shadow Stock Portfolio through the end of 2024, the compound annual growth rate (CAGR) would be reduced from 13.1% to 2.3%. The total annual return of the Vanguard 500 Index fund  (VFINX), a proxy for the market, is reduced from 10.5% to 3.5% when out of the market during its best month of each year from 1993 through 2024.
If you were out of the market during the worst month of each year, the compound annual growth rate increases from 13.1% to 24.5% for the Model Shadow Stock Portfolio and from 10.5% to 17.7% for the Vanguard 500 Index. The Model Shadow Stock Portfolio has been more volatile than the large-cap Vanguard 500 Index. The stock prices of less liquid smaller companies typically decline more sharply during market corrections and then bounce back more strongly than the overall market.
Even more surprising is the impact of being out of the market for both the best and worst month of each year. If both the best and worst months are skipped, the 13.1% return of the Model Shadow Stock Portfolio goes down to 12.6%. The impact of giving up the best-performing month of each year outweighs the benefit of being out of the market during the weakest month of each year. The same is true with the Vanguard 500 Index, for which the fully invested return of 10.5% is reduced to 10.3%. See the online version of this article for a table showing data for each year since 1993.
The allure of market timing is certainly strong. The reality is that it is very difficult to successfully time entry and exit points. Many successful trend-following investors acknowledge that the primary benefit of market timing is reducing extreme volatility, not boosting long-term rates of return.
Quarterly Portfolio Review and Deletion
Since its inception in 1993 through the end of February 2025, the AAII Model Shadow Stock Portfolio had a compound average annual return of 13.0%, versus the Vanguard 500 Index’s average annual gain of 10.5% over the same period. The Vanguard Small Cap Index fund (NAESX) posted an average annual gain of 9.8% over the same period. Figure 1 shows performance over other time periods.
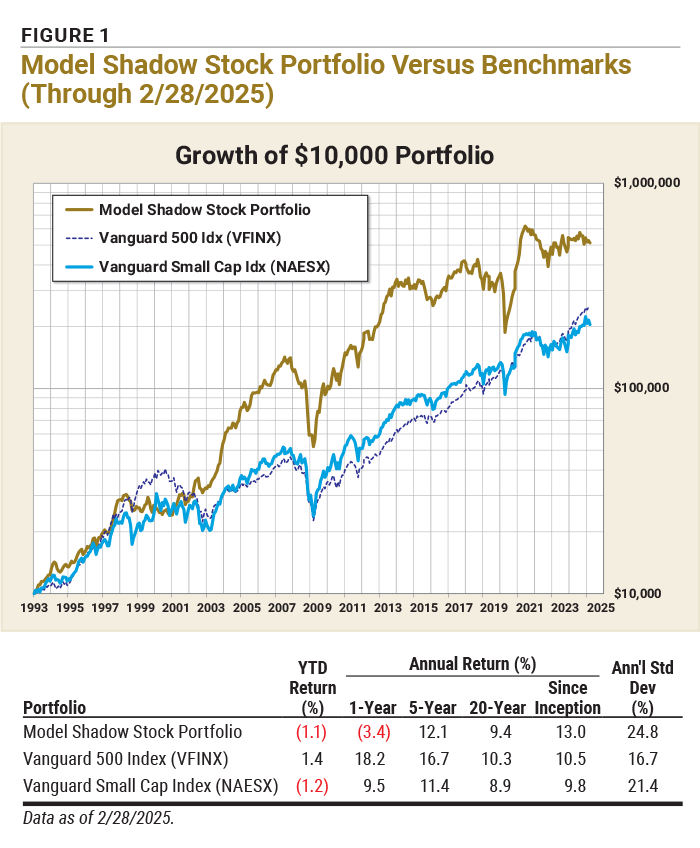
The Model Shadow Stock Portfolio is reviewed quarterly to determine portfolio deletions and additions. The quarterly review cycle is tied to the reporting cycle of most firms and limits costly portfolio turnover. AAII’s stock analysis and screening service Stock Investor Pro, with data as of February 28, 2025, was used to determine the value and size break points for the quarterly review.
The primary Model Shadow Stock Portfolio selection criteria target the intersection of the smallest 10% of domestic stocks as measured by market capitalization, along with the “cheapest” 10% of domestic stocks as measured by the price-to-book-value (P/B) ratio.
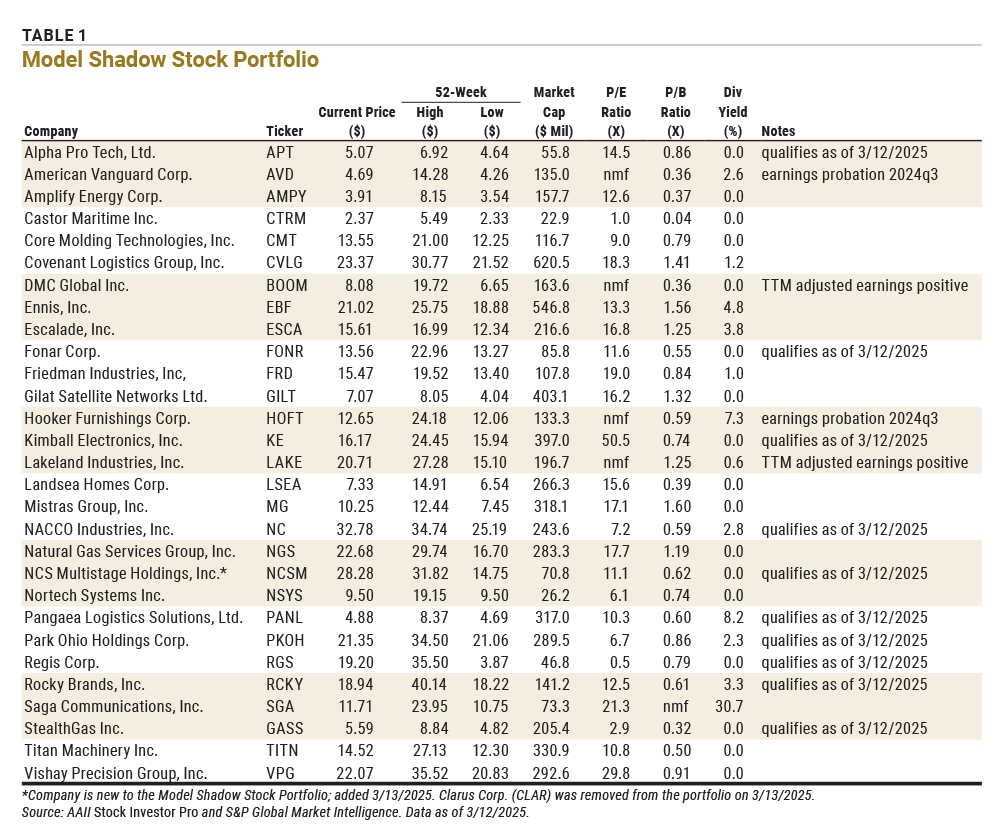
Approaching Size Limit: Stocks are sold if their market capitalization goes above three times the initial maximum criterion and there is a stock to replace it. The current market-cap maximum for initial screening is $400 million. Stocks are marked “approaching size limit” if their current market cap exceeds 2½ times the initial criterion, or $1.0 billion.
Approaching Value Limit: Stocks are sold once their price-to-book-value (P/B) ratio goes above three times the initial criterion and there is a stock to replace it. The current initial price-to-book ceiling is 0.90. Stocks are marked “approaching value limit” if their current price-to-book ratio exceeds 2½ times the initial criterion, or 2.25.
Earnings Probation: If the last 12 months’ earnings are negative, the stock is put on probation; if a subsequent quarter has negative earnings prior to 12-month earnings becoming positive, the stock is sold. When available, adjusted (non-GAAP) earnings are used to put stocks on probation or remove them. Otherwise, earnings from continuing operations are used. The date is the calendar quarter for which the company first reported negative trailing 12-month earnings.
Qualifies As Of: Stock still qualified as an addition when the screen was run with current data. Stocks that don’t currently qualify as an addition are held until they meet one of the deletion rules.
TTM Adjusted Earnings Positive: Trailing four-quarter GAAP earnings are negative, resulting in no meaningful figure for the price-earnings (P/E) ratio. However, adjusted earnings for the period are positive.
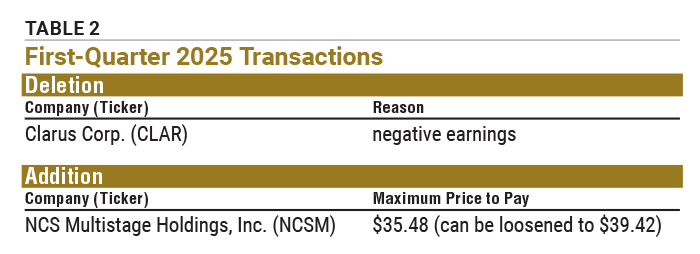
A complete list of current portfolio holdings is presented in Table 1. After the quarterly review of the Model Shadow Stock Portfolio, one stock was removed and one stock was added (Table 2).
Value
The price-to-book cutoff has decreased slightly from 0.83 in December to 0.82. The current initial qualifying maximum price-to-book ratio is 0.90 and we left it unchanged. Qualifying stocks must have a price-to-book ratio of 0.90 or lower when added to the model portfolio. Stocks in the model portfolio are removed for valuation if they exceed three times the initial maximum price-to-book ratio at the time of a quarterly portfolio review.
As of March 12, 2025, Mistras Group Inc. (MG) had the highest price-to-book ratio in the model portfolio at 1.60. No stocks in the model portfolio exceeded the maximum price-to-book ratio at the time of review.
Size
We examine the market-cap levels of domestic companies listed on the New York Stock Exchange (NYSE) to determine the size cutoff for the lowest decile when adding stocks to the model portfolio. The lowest decile market-cap level decreased from $380 million in December to $350 million using data in Stock Investor Pro as of February 28, 2025. We maintained the maximum initial qualifying market-cap value at $400 million. Holdings are removed if their market cap goes above three times the initial criterion at the time of the quarterly review.
Covenant Logistics Group Inc. (CVLG) had the highest market cap in the model portfolio at $620.5 million as of March 12, 2025, but this did not exceed the $1.2 billion market-cap maximum at the time of review.
Earnings
If a company has trailing 12-month earnings from continuing operations that are negative, the stock is placed on probation; if a subsequent quarter has negative earnings prior to trailing 12-month earnings becoming positive, the stock is deleted. When available, adjusted (non-GAAP) earnings are used to put stocks on probation or remove them.
Companies are given additional time to file their fiscal year-end financial statements than their quarterly reports. While larger companies must file their annual reports 60 days from the year-end, small firms have 90 days to file with the U.S. Securities and Exchange Commission (SEC). Over three-quarters of publicly traded firms have fiscal-year-ends matching the calendar-year end. As a result, not all of the Model Shadow Stock Portfolio holdings released their year-end statements at the time of the review. The shorter deadlines for filing quarterly statements are 40 days from the quarter-end for large companies and 45 days for smaller firms. We therefore tend to get more timely quarterly reports later in the year.
Portfolio Deletion: Clarus
Clarus Corp. (CLAR) was on earnings probation after reporting a loss for the second calendar quarter. It reported positive adjusted earnings for the third quarter, but a loss during the fourth quarter, and its trailing 12-month earnings are still negative. It is the policy of the Model Shadow Stock Portfolio to remove a stock once its trailing 12-month adjusted earnings go negative and the company reports a subsequent quarterly loss while trailing earnings are still negative. Clarus was removed from the portfolio due to negative earnings. Clarus was added to the Model Shadow Stock Portfolio on December 12, 2022, at a price of $8.1395 per share. It was deleted on March 13, 2025, at $3.9055 per share, for a price loss of 52.0%.
Quarterly Portfolio Addition
As of March 12, 32 stocks met the initial selection criteria for the Model Shadow Stock Portfolio. AAII members can see and research which companies are currently passing the initial selection criteria in the Shadow Stock Ideas table on AAII.com. The list of currently passing Shadow Stock Ideas is updated daily—Tuesday through Saturday.
Nine qualifying stocks were already in the Model Shadow Stock Portfolio at the time of the review. The remaining 23 stocks were examined to ensure adequate liquidity, timely financial filings, and appropriate industry and foreign considerations. The Shadow Stock Portfolio Rules on AAII.com provide guidance on factors to consider when selecting stocks for your portfolio.
With the proceeds from the deletion, as well as the cash held in the portfolio, the Model Shadow Stock Portfolio was able to take a position in one company, although it was below the average position size for the existing holdings in the tracking portfolio.
Portfolio Addition: NCS Multistage
NCS Multistage Holdings Inc. (NCSM) is a provider of highly engineered products and support services that enable oil-and-gas operators to optimize oil and natural gas well completions and field development strategies. Its products and services are used primarily by exploration and production companies for onshore wells, predominantly wells that have been drilled with horizontal laterals in unconventional oil and natural gas formations. Its products and services are utilized in oil and natural gas basins throughout North America and in selected international markets, including Argentina, China, the Middle East and the North Sea. The company has a strong presence in Canada, which represented over 60% of its consolidated revenue in 2024. A strengthening of the U.S. dollar relative to the Canadian dollar would lower its U.S. dollar reported results. The imposition of tariffs and reciprocal trade actions between the U.S. and Canada could also impact business. NCS Multistage was founded in 2006 and is headquartered in Houston, Texas.
NCS Multistage has a book value per share of $39.42 as of December 31, 2024. If you wish to stay within the 0.90 price-to-book maximum, you should pay no more than $35.48 per share ($39.42 x 0.90). However, if the stock price has moved up after being added to the portfolio, you can still purchase the stock unless the price-to-book ratio goes above 1.00, which equates to a price of $39.42 per share.
Next Portfolio Review
The next quarterly review of the Model Shadow Stock Portfolio will take place following the release of first-quarter results in June 2025. If there are any changes to the model portfolio, they will be announced at the time in the Model Shadow Stock Portfolio Update email. Sign up for this email at www.aaii.com/email so you don’t miss it!
Discussion
FREE REPORT

JOHN L from NJ posted over 1 year ago:
MICHAEL W from OH posted over 1 year ago:
TOM G from VA posted over 1 year ago:
JOHN L from NJ posted over 1 year ago:
James F from USA posted over 1 year ago:
You need to log in as a registered AAII user before commenting.
Log InCreate an account