


Wayne Thorp leads a class in AAII's new Essential Investing Video Course. Go to https://www.aaii.com/ves for more information and to subscribe.

- How to use LLMs like ChatGPT and Claude to analyze market sentiment on company earnings calls, news and social media
- Practical prompts and workflows that detect subtle tone shifts and language patterns predictive of stock movement
- Common sentiment signals that precede rallies, sell-offs or corporate transitions across market cycles and sectors
Large language models (LLMs) excel at identifying patterns in text that humans often overlook. When executives say “normalizing demand” instead of “declining sales,” or when Reddit sentiment shifts from jokes to serious concern, these artificial intelligence (AI) tools catch it. This guide shows you exactly how to use OpenAI’s ChatGPT, Anthropic’s Claude and other LLMs to analyze market sentiment with the same techniques professional investors use.
Why Sentiment Analysis Works
Market prices move when perception changes. A company can post solid earnings, but if management sounds defensive during the conference call, shares often drop. Conversely, money-losing companies can experience a surge in value when executives project confidence about their prospects. This is the reality of sentiment-driven markets.
Traditional sentiment indicators, such as put-call ratios and the CBOE Volatility Index (VIX), measure broad market fear and greed. However, they overlook the granular shifts occurring in individual stocks. That’s where LLMs shine—they process thousands of text sources to detect subtle changes in how people discuss specific companies.
Consider GameStop Corp.  (GME) in early 2024. Before the stock surged 243% in May, Reddit discussions shifted from memes to serious technical analysis. Posts about “diamond hands” gave way to discussions of failures to deliver and regulatory filings. LLMs scanning this content would have caught the tonal shift weeks before mainstream media noticed.
How LLMs Decode Financial Language
LLMs trained on millions of documents recognize patterns humans often miss. They understand that “challenging headwinds” for a firm means facing problems, while “sequential improvement” suggests that things are gradually getting better. More importantly, they catch hedging language that company executives use to soften bad news.
Here’s what LLMs detect particularly well:
- Management confidence levels: Decisive language (“we will achieve”) versus hedged statements (“we believe we can achieve”)
- Deflection patterns: When executives give long answers to simple questions or pivot to unrelated positives
- Sentiment momentum: Whether language is becoming more or less optimistic over time
- Inconsistencies: When guidance doesn’t match the tone of prepared remarks
The key insight: LLMs don’t just count positive and negative words. They understand context, detecting when language like “remain optimistic” actually signals concern.
Tesla Case Study: What LLMs Catch
During Tesla Inc.’s (TSLA) October 2024 Robotaxi event, human analysts focused on the technology demonstration. But LLMs analyzing the presentation transcript flagged an unusual amount of conditional language. Phrases like “when regulatory approval comes” and “assuming favorable conditions” appeared far more frequently than during previous Tesla events.
The stock dropped 8% the next day. Why? Not because the technology disappointed, but because the timeline uncertainty became clear. LLMs caught what humans missed: a shift from Tesla’s typically definitive language to heavy qualification.
This pattern repeats across earnings calls. An LLM analyzing Bed Bath & Beyond Inc.’s fourth-quarter 2022 earnings call would flag executives’ use of the phrase “exploring strategic alternatives” five times as highly unusual repetition. The company filed for bankruptcy two months later.
Practical Prompts That Generate Alpha
These prompts have been tested and refined by actual users. Copy and modify them for your needs.
The Earnings Call X-Ray
This prompt is effective because it focuses on linguistic patterns that have been proven to correlate with future performance. Executives who give specific guidance tend to meet it. Those who deflect often disappoint.
Analyze [Company]’s latest earnings call for these specific patterns:
1. Defensive language indicators:
- Excessive use of “believe,” “think,” “hope”
- Long answers to simple questions
- Pivoting to past achievements when asked about the future
2. Confidence markers:
- Specific numbers and dates
- Direct answers to analyst questions
- Voluntary disclosure of challenges
3. Compare the Q&A tone to prepared remarks—which sounds more genuine?
Rate management credibility from 1-10 and explain why.
The Reddit Reality Check
Social media sentiment matters most when it shifts suddenly or when experienced users break from the crowd. This prompt filters for quality insights.
Analyze recent Reddit discussions about [Stock] on r/wallstreetbets and r/stocks:
- What percentage of posts are substantive analysis vs. memes?
- Are experienced users (3+ year accounts, high karma) bullish or bearish?
- What specific concerns keep appearing across multiple threads?
- Any mentions of unusual options activity or insider transactions?
Separate signal from noise - focus on concrete claims that can be verified and substantiated.
The News Narrative Tracker
Media narratives often become self-fulfilling. Catching narrative shifts early provides a trading edge.
How has financial media coverage of [Company] changed over the past month?
- Early coverage themes vs. current themes
- New concerns that weren’t discussed before
- Positive developments that stopped being mentioned
- Changes in the experts being quoted
Identify the narrative shift and whether it’s justified by facts or just momentum.
The Sector Sentiment Scanner
Relative sentiment often matters more than absolute levels. The best-sounding company in a worried sector often outperforms.
Compare sentiment across the top 5 companies in [sector]:
- Which company’s management sounds most confident in recent communications?
- Are the concerns company-specific or affecting everyone?
- Who’s gaining mention share in discussions?
- Any divergence between stock performance and sentiment?
Identify the sentiment leaders and laggards with specific examples.
Building Your Daily LLM Workflow
This 30-minute routine captures most significant sentiment shifts.
Premarket (10 Minutes)
- Run the sector sentiment scanner on your main holdings’ industries.
- Check for any overnight earnings—if yes, run the earnings call X-ray.
- Ask: What are the 3 most important things affecting [your holdings] today?
The sector sentiment scanner provides immediate context—is your stock’s weakness company-specific or sector-wide? During earnings season, the X-ray prompt on fresh transcripts reveals tone shifts before analyst reports hit. The third query prioritizes your attention on what actually matters.
Midday Check (Five Minutes)
- For any stocks moving >3%, ask: Why is [Stock] moving? Summarize in two sentences.
- If unexplained moves: Run the Reddit reality check.
- Note any sentiment/price divergences for evening analysis.
This check catches momentum shifts. Unexplained movements often stem from social media buzz or obscure news, and LLMs can quickly identify them. When price and sentiment diverge—the stock is up but sentiment is negative, or vice versa—you’ve found tomorrow’s likely direction.
After Market Close (15 Minutes)
- Run the news narrative tracker on your biggest positions.
- For new positions you’re considering, ask: What’s the bear case for [Stock]? Be specific.
- Weekly review prompt: How did sentiment shifts align with price moves this week?
Evening analysis, free from market noise, helps identify building narratives. The bear case prompt prevents confirmation bias—if bears have weak arguments, your bull thesis strengthens. The weekly review trains your pattern recognition. After a month, you’ll spot which sentiment shifts actually predict price moves.
Weekend Deep Dive (45 Minutes)
Once per week, conduct a systematic analysis with these prompts.
- Earnings Season Prep: Which of my holdings report next week? What’s the sentiment setup going into earnings? High expectations increase disappointment risk.
- Sector Rotation Check: Compare sentiment momentum across sectors. Where is sentiment improving fastest? Deteriorating? Money flows toward improving sentiment.
- Social Sentiment Audit: Review the past month of Reddit/Twitter discussion on [your holdings]. Any building concerns or excitement? Gradual shifts matter more than daily noise.
- Management Credibility Review: Based on the last four quarters, which CEOs delivered on promises vs. disappointed? Track record predicts future credibility.
The key is consistency. Sentiment shifts build over days before causing major moves. Daily monitoring catches these building waves. Missing one day isn’t fatal, but missing a week means playing catch-up.
Advanced Techniques That Actually Work
The Inconsistency Detector
Changes in what management emphasizes often precede fundamental shifts. Retailers start discussing “inventory optimization” before admitting that sales are slow. Software companies shift from “user growth” to “revenue per user” when growth stalls. These rhetorical pivots provide early warning signals.
Compare [Company]’s last three earnings calls:
- Which topics did management eagerly discuss before but now avoid?
- Have their key metrics changed? (e.g., from revenue growth to “adjusted EBITDA”)
- Are they using more or fewer qualifiers when discussing guidance?
- Any phrases that appear suddenly in the latest call?
Flag the biggest changes in communication style.
Example output: “In Q3, management mentioned ‘competitive pressure’ zero times. In Q4, it appeared 7 times. Meanwhile, discussions of ‘market leadership’ dropped from 5 mentions to 1. This suggests market share loss.”
The Sentiment Divergence Finder
The greatest opportunities arise when different groups perceive the same situation in varying ways. LLMs excel at spotting these perception gaps. When management claims an “industry headwind” but competitors report strength, someone’s wrong. When options traders bet on a bearish outcome but analysts remain bullish, volatility ensues.
For [Stock], identify any disconnects between:
- Management tone vs. analyst tone in recent reports
- Social media sentiment vs. news coverage
- Options flow vs. verbal sentiment
- Company statements vs. competitor statements about industry conditions
Which source do you find more credible and why?
Real-life example: In late 2023, retail management teams cited “cautious consumers” while credit card data showed a strong spending trend. Companies with honest assessments outperformed those that made excuses by 15% over the following months.
The Catalyst Probability Assessor
This prompt helps you position yourself before binary events by assessing management’s real confidence level. CEOs who say “we expect to meet guidance” sound different from those who say “we remain committed to our guidance.” The first expresses confidence; the second suggests struggle.
Before drug approvals, clinical trial results or major product launches, management language often telegraphs outcomes. Biotechnology executives tend to become notably vague in the lead-up to disappointments. Technology CEOs stop giving specific launch dates when products face delays.
[Company] faces [upcoming event/catalyst]. Based on recent management language:
- How prepared do they sound? Quote specific phrases.
- Are they setting up excuses or expressing confidence?
- How does their tone compare to previous similar events?
- What outcome is the market expecting based on sentiment?
Rate the probability of positive surprise from 1-10.
The Industry BS Detector
When entire industries face the same challenge, smart analysis separates the winners from the whiners. During a supply chain crisis, companies with genuine operational excellence find solutions, while weaker operators merely complain. LLMs can quickly identify which companies offer specifics versus platitudes.
Analyze industry-wide earnings calls for [sector]:
-
What excuse appears across multiple companies?
-
Which company sounds most/least credible discussing this issue?
-
Any company taking responsibility while others blame external factors?
-
Historical check: Did similar excuses precede sector downturns before?
Identify who’s hiding behind industry excuses vs. facing company-specific issues.
The Preannouncement Detective
Companies often telegraph bad news through subtle changes in communication before making official announcements. LLMs excel at detecting these patterns across multiple documents. Unusual Form 8-K filings, sudden investor relations website updates or executive changes with specific backgrounds all carry sentiment signals.
Analyze [Company]’s recent 8-K filings, press releases and executive communications:
- Any unusual timing of announcements? (Friday afternoon, holidays)
- Increased legal language or disclaimers?
- Changes in communication frequency?
- New executives brought in with “turnaround” experience?
Rate the likelihood of a negative preannouncement in the next 30 days.
The Conference Call Theater Critic
Sometimes, how things are said matters more than what’s said. CEOs who suddenly defer financial questions after previously answering them confidently may be distancing themselves from upcoming disappointments. Calls ending abruptly or experiencing convenient technical issues during difficult questions warrant extra scrutiny. Assess the choreography, not just the script.
Beyond words, analyze the earnings call dynamics:
- Did the CEO dominate the call or defer to the CFO frequently?
- Were analyst questions cut short or fully answered?
- Any ‘technical difficulties’ during tough questions?
- How did management respond to multipart questions?
Common Pitfalls and Solutions
Training Date Cutoffs: Most LLMs don’t know about recent events. Solution: Provide context about recent developments or use search-enabled versions of the LLMs. Always specify dates in your prompts.
Hallucination Risk: LLMs sometimes invent plausible-sounding information. Solution: Focus on sentiment analysis, not specific facts. Verify any numbers or quotes independently.
Context Limitations: Can’t paste entire transcripts. Solution: Use investor relations summaries, focus on the Q&A sections or break down the analysis into manageable chunks.
Overconfidence in Output: LLMs often sound certain even when making guesses. Ask, What could make this analysis wrong? and What information would change your view?
Making Sentiment Analysis Actionable
Sentiment analysis becomes valuable when integrated into your investing process.
Screening: Use sentiment scans to identify stocks that warrant further research based on changing language patterns.
Monitoring: Track shifts in sentiment as potential indicators that conditions are changing.
Risk Awareness: When sentiment deteriorates in holdings, it may indicate developing issues worth investigating.
Pattern Recognition: Watch for specific phrases that historically precede significant corporate changes. “Strategic review, “exploring options” and “challenging environment” often signal transitions.
When sentiment diverges sharply from fundamentals, you’ve identified a situation requiring deeper analysis.
Sentiment Patterns Across Market Cycles
Understanding how corporate sentiment evolves through different market phases enhances your analysis.
Bull Market Sentiment Evolution
Early stage: Cautious optimism, management emphasizes “improvement” and “recovery.”
Mid stage: Confident language, specific growth targets and expansion discussions.
Late stage: Euphoric tone, dismissive of risks and “this time is different” narratives.
Watch for: Gradual shift from facts to vision and increasing use of superlatives.
Bear Market Sentiment Progression
Early stage: “Temporary headwinds,” “near-term challenges” and maintaining guidance.
Mid stage: “Uncertain environment,” “preserving capital” and guidance suspension.
Late stage: “Exploring all options,” “strategic alternatives” and survival mode.
Watch for: Progression from confidence to caution to crisis management.
Sector Rotation Sentiment Clues
Different sectors often show sentiment shifts at different times. When technology CEOs sound defensive while industrials CEOs gain confidence, it may indicate changing market dynamics. LLMs can efficiently track these relative sentiment shifts across sectors, helping you understand broader market narratives.
Earnings Season Sentiment Patterns
Companies that report early in the earnings season often set the tone. If early reporters sound cautious, later reporters frequently follow suit. LLMs help identify these narrative themes as they develop, not after they’re established.
Real Patterns Worth Watching
Through practical use, specific patterns consistently provide value.
The Defensive Pivot
When management stops talking about growth and starts emphasizing “cash generation” or “returning capital to shareholders,” trouble often lurks. Watch for this language shift in transcripts. Growth companies that suddenly discover the virtues of dividends have usually discovered they can’t grow anymore. Technology companies that pivot from “total addressable market” to “improving unit economics” are waving red flags.
The Complexity Increase
Simple businesses that suddenly need complicated explanations often face problems. When a retailer starts talking about “omnichannel synergies” instead of same-store sales or when a software company introduces multiple new metrics because the old ones are not performing well, pay attention. Complexity is where bad news hides. Watch for this—it’s remarkably consistent.
The Metric Shuffle
Companies that change their featured metrics are often hiding deterioration in traditional measures. Watch for the progression: revenue growth —> adjusted revenue —> EBITDA —> adjusted EBITDA —> free cash flow before growth investments. Each step down this ladder suggests a weakening of the core business. LLMs excel at tracking these metric changes across multiple quarters.
The Enthusiasm Gap
When management sounds less excited than analysts, disappointment often follows. This shows up in word choice: Management uses “solid” while analysts say “spectacular.” Management says “progressing” while analysts expect “accelerating.” These gaps in enthusiasm level often precede guidance cuts.
The Social Sentiment Surge
Sustained buzz on Reddit and X, formerly known as Twitter, (not just one-day spikes) often precedes institutional attention. Look for multiweek buildups where discussion quality improves—fewer memes, more due diligence posts and veteran traders joining conversations. The January 2024 regional bank recovery followed this exact pattern.
The Guidance Creep
Watch how guidance language evolves. “We expect” becomes “we currently expect” becomes “based on current visibility.” Each added qualifier reduces commitment. Companies adding multiple qualifiers to previously firm guidance are preparing to miss their targets.
The Competitor Callout
When companies suddenly start mentioning competitors they previously ignored, they’re usually losing market share. Count competitor mentions across earnings calls. Spikes indicate defensive positioning. Winners talk about their execution; losers blame “competitive dynamics.”
Starting Your LLM Practice
Begin with these steps:
-
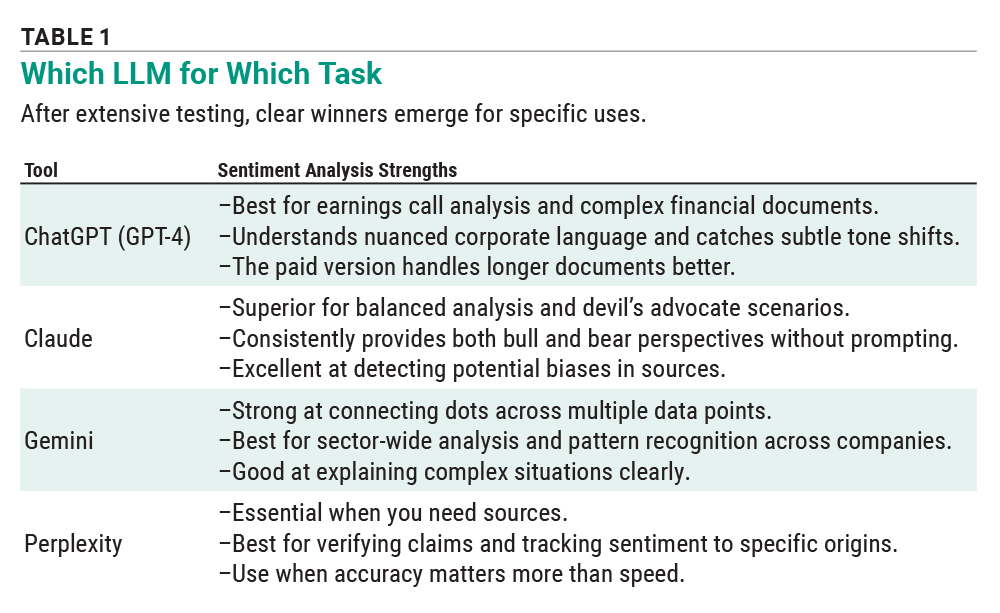
Pick one LLM (free versions work fine). Table 1 outlines the sentiment analysis strengths of the four main LLMs.
-
Use three prompts from this guide consistently.
-
Track results for 30 days.
-
Adjust based on what works.
-
Expand gradually.
Common Mistakes
Be cognizant to not:
- Analyze too many stocks at once
- Constantly change prompts
- Ignore when the LLM’s analysis is wrong
- Trade every sentiment shift
- Use only one information source
The best use of LLMs isn’t to replace your analysis; it’s to make you ask better questions. When an LLM flags defensive language in an earnings call, that’s your cue to dig deeper. When it notices management avoiding a topic they used to embrace, that’s worth investigating. Think of it as having a tireless assistant who reads everything and never forgets a pattern.

Related

Related

Stock Strategies
How Conference Calls Can Help Investors Read the Tea Leaves
Discussion
FREE REPORT

Get your free copy of our special
report analyzing the tech stocks
most likely to outperform the
market.
BARRY J from TX posted about 1 year ago:
BARRY J from TX posted about 1 year ago:
Wayne T from IL posted about 1 year ago:
BARRY J from TX posted about 1 year ago:
BARRY J from TX posted about 1 year ago:
BARRY J from TX posted about 1 year ago:
BARRY J from TX posted about 1 year ago:
You need to log in as a registered AAII user before commenting.
Log InCreate an account