


This week, we use AAII’s A+ Investor Stock Grades to provide insight into three stocks in the commercial services and supplies industry. With the industry shifting into a new age of technology, should you consider the stocks of Interface Inc.  (TILE), Openlane Inc. (OPLN) and The GEO Group Inc. (GEO)?
Commercial Services and Supplies Stocks Recent News
Digital transformation is the defining force reshaping the commercial services and supplies industry’s trajectory through 2030. As The Business Research Company reported in its 2026 Commercial Services Market Report, this year is expected to build on years of steady outsourcing-led growth. With artificial intelligence (AI), cloud platforms and 5G Internet of Things (IoT) connectivity now widely penetrating the sector, the nature of services delivery itself is changing. Analysts project the market to surge 9.5% over the next five years—from $7.19 trillion in 2026 to $10.32 trillion by 2030—driven not just by more demand, but by smarter, more scalable demand. According to the report, major companies are already introducing commercial services built on 5G IoT satellite technology, while digital platforms, automated workflows and AI-driven tools are quickly becoming baseline client expectations rather than premium add-ons.
As the report makes clear, the shift is also restructuring competitive advantage across the industry. The dominant trends shaping the forecast period are increasing demand for business support outsourcing, growing adoption of digital commercial service platforms and rising focus on enhancing customer experience efficiency. Clients are no longer looking to hand off tasks, instead they want flexible, technology-enabled partners who can scale with them.
Given this outlook for the commercial services and supplies industry, might companies such as Interface, Openlane and GEO Group benefit?
Sign Up to Receive a Free Special Report That Shows How A+ Investor Grades Can Help You Make Investment Decisions
Grading Commercial Services and Supplies Stocks With AAII’s A+ Stock Grades
When analyzing a company, it is helpful to have an objective framework that allows you to compare companies in the same way. This is why AAII created the A+ Stock Grades, which evaluate companies across five factors that research and real-world investment results indicate to identify market-beating stocks in the long run: value, growth, momentum, earnings estimate revisions (and surprises) and quality.
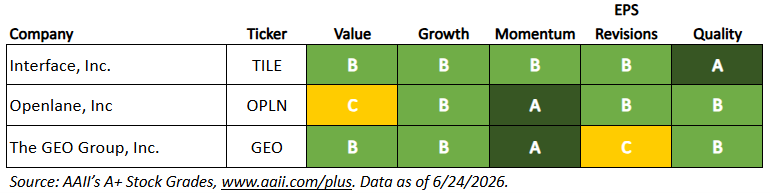
Using AAII’s A+ Stock Grades, the following table summarizes the attractiveness of three commercial services and supplies stocks—Interface, Openlane and GEO Group—based on their fundamentals.
AAII’s A+ Stock Grade Summary for Three Commercial Services and Supplies Stocks
What the A+ Stock Grades Reveal
Interface Inc. (TILE) is a global commercial flooring company operating in the U.S., Europe, Asia-Pacific and beyond. It offers modular carpet tiles, luxury vinyl tiles and other flooring solutions for commercial, institutional and residential markets. The company operates through two segments: Americas and Europe, Africa & Middle East. Interface produces a broad range of modular flooring products, including carpet tiles, resilient flooring and rubber flooring, serving customers in corporate offices, healthcare facilities, education, hospitality and retail environments. It also provides sustainability-focused flooring solutions, with a long-standing commitment to environmental responsibility through its Climate Take Back mission and carbon-neutral product offerings. The company was founded in 1973 and is headquartered in Atlanta, Georgia.
The company has a Value Grade of B, based on its Value Score of 64, which is good value. The Value Grade is the percentile rank of the average of the percentile ranks of the price-to-sales (P/S) ratio, price-earnings (P/E) ratio, price-to-book-value (P/B) ratio, price-to-free-cash-flow (P/FCF) ratio, shareholder yield and the ratio of enterprise value to earnings before interest, taxes, depreciation and amortization (EBITDA).
A lower rank on valuation metrics is more attractive. Among all U.S.-listed stocks, Interface ranks in the 36th percentile for its shareholder yield and in the 38th percentile for both its price-earnings ratio and its price-to-sales ratio. The company has a shareholder yield of 1.0%, a price-earnings ratio of 15.1 and a price-to-sales ratio of 1.33.
Earnings estimate revisions indicate how analysts view a firm’s short-term prospects. Interface has an Earnings Estimate Revisions Grade of B, based on a score of 73, which is positive. The grade is based on the statistical significance of its latest two quarterly earnings surprises and the percentage change in its consensus estimate for the current fiscal year over the past month and past three months. Interface reported a positive earnings surprise of 24.2% for the first quarter of 2026, and in the prior quarter reported a positive earnings surprise of 21.6%. Over the last month, the consensus earnings estimate for the second quarter of 2026 is unchanged at $0.635 per share. Over the last month, the earnings estimate for full-year 2026 has risen from $2.130 to $2.133 per share, based on one upward revision.
Openlane Inc. (OPLN) is a global digital automotive marketplace company operating in the U.S., Canada, Europe and beyond. It offers digital auction and remarketing solutions for buying and selling used vehicles, serving dealers, financial institutions, fleet operators and commercial consignors. The company operates through two segments: marketplace and finance. Openlane provides a broad range of vehicle remarketing services, including online auctions, inspection and transportation services, title management, and dealer financing solutions. It also offers data analytics, valuation tools and inventory management technology, connecting buyers and sellers across its digital wholesale vehicle marketplace platform. The company was founded in 1994 and is headquartered in Carmel, Indiana.
Openlane has a Quality Grade of B, with a score of 79, which is strong. Higher-quality stocks possess traits associated with upside potential and reduced downside risk. The Quality Grade is the percentile rank of the average of the percentile ranks of return on assets (ROA), return on invested capital (ROIC), gross profit to assets, buyback yield, change in total liabilities to assets, accruals to assets, Z double prime bankruptcy risk (Z) score and F-Score. To be assigned a Quality Score, though, stocks must have a valid (non-null) measure and corresponding ranking for at least four of the eight quality measures.
The company has a strong return on invested capital of 59.1%, which ranks in the 89th percentile. It also ranks strongly in terms of its return on assets of 3.9% (66th percentile) and F-Score of 8 (94th percentile). The F-Score is a number between 0 and 9 that assesses the strength of a company’s financial position based on its profitability, leverage, liquidity and operating efficiency.
Openlane has a Momentum Grade of A, based on its Momentum Score of 84. This means that the stock’s momentum is very strong in terms of its weighted relative strength over the last four quarters. The weighted four-quarter relative strength rank is the relative price change for each of the past four quarters, with the most recent quarterly price change given a weight of 40% and each of the three previous quarters given a weight of 20%. The ranks are 88, 38, 66 and 78, sequentially from the most recent quarter. The weighted four-quarter relative price strength is 12.7%.
Openlane has a Growth Grade of B, which is strong. The components of the Growth Composite Score consider a company’s success in growing sales on a year-over-year and long-term annualized basis and its ability to consistently generate positive cash from its core operations. The company has increased sales for the past five consecutive years and has a strong five-year annual sales growth rate of 7.8%.
Don’t Miss Your Free Report — Sign Up Here!
The GEO Group Inc. (GEO) is a global diversified government services company operating in the U.S., Australia, South Africa and beyond. It offers secure facility management, community reentry services and electronic monitoring solutions for government agencies at the federal, state and local levels. The company operates through four segments: secure services, electronic monitoring and supervision services, reentry services, and international services. GEO Group manages and operates correctional and detention facilities, residential reentry centers, and youth services programs, providing secure and nonsecure housing for government clients. It also provides offender monitoring technologies, including radio frequency and GPS tracking, as well as rehabilitation and reentry programming designed to reduce recidivism. The company was founded in 1984 and is headquartered in Boca Raton, Florida.
GEO Group has a Quality Grade of B, with a score of 73, which is strong. The company ranks strongly in terms of its buyback yield and return on assets. Its buyback yield of 3.3% ranks in the 86th percentile, and its return on assets of 7.3% ranks in the 80th percentile.
The company has a Momentum Grade of A, based on its Momentum Score of 87. This means that the stock’s momentum is very strong in terms of its weighted relative price strength over the last four quarters. The ranks are 95, 69, 18 and 21, sequentially from the most recent quarter. The weighted four-quarter relative price strength is 16.1%.
The company has a Value Grade of B, based on its Value Score of 63, which is good value. Its shareholder yield of 3.3% surpasses the industry median of 0.0%.
GEO Group has a Growth Grade of B, which is strong. The company has generated positive annual cash from operations in the past five consecutive years and has a five-year annualized sales growth rate of 2.3%.
 Included With AAII Platinum
Yield Screen: 8.7% Compared to S&P 500
at only 6.9%
Since Inception. Data as of 12/31/2024.

769.3% Stock Superstars Portfolio Total Return Since Inception

U.S. Index ETF (IYY)
SSR Group 3 O'Shaughnessy portfolio has a 411.2% gain since inception performance compared to IYY at only 119.1%% Performance as of 11/29/24.


FREE REPORT

BECOME A MEMBER FOR ONLY $2
Get access to powerful investment discovery tools and a wealth of investment education to help you achieve your financial goals.