

Stock Market Returns Following Streaks of Double-Digit Gains
by Charles Rotblut | January 15, 2026
Large-cap stocks realized double-digit gains for a third consecutive year in 2025. This was just the eighth streak of at least three years to occur since 1926.
What does the past tell us about what to expect for the S&P 500 index in 2026? Curious myself, I looked at the data while preparing my slides for the AAII Dividend Investing (DI) presentation I gave last week.
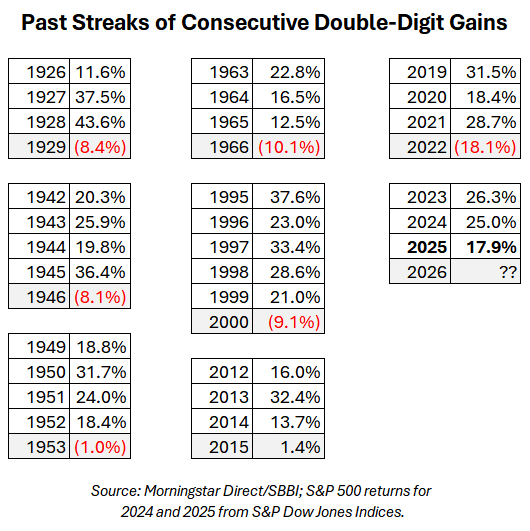 Let’s look at what happened after each of those occurrences. Stocks, Bonds, Bills and Inflation (SBBI) large-company data is used for all periods prior to 2023 because the S&P 500 was not created until 1957.
- 1926–1929: Large-cap stocks gained 11.6% in 1926, 37.5% in 1927 and 43.6% in 1928. The stock market crashed on October 24, 1929, referred to as Black Thursday, and the Great Depression ensued. Notably, large-cap stocks ended 1929 down just 8.4% for the full calendar year. The losses in 1930 and 1931 were far more substantial.
- 1942–1945: Stocks have tended to do well during times of war, and World War II was no exception. The demands of battle boosted economic production, and stock prices reacted accordingly. Large-cap stocks gained 20.3% in 1942, 25.9% in 1943, 19.8% in 1944 and 36.4% in 1945. The streak ended in 1946 as inflation shot up in response to postwar demand for goods rising faster than supplies.
- 1949–1952: The U.S. economy was still experiencing a post–World War II expansion when the Korean War broke out. In response to the new war, government spending increased. At the same time, President Harry Truman instituted price controls in response to inflationary pressures and raised taxes to cover the higher fiscal spending. Large-company stocks rose 18.8% in 1949, 31.7% in 1950, 24.0% in 1951 and 18.4% in 1952. They then fell a very modest 1.0% in 1953 as fighting stopped in what has become a multidecade truce.
- 1963–1965: Large-cap stocks followed a 22.8% jump in 1963 with 16.5% and 12.5% gains in 1964 and 1965, respectively. A combination of events led to these good returns. The Kennedy Slide of 1962 lowered valuations. The Go-Go years followed with renewed interest in stocks and growth in mutual funds. Technology stocks caught the eye of investors. Then, a 1966 bear market caused by high inflation, tightening monetary policy and the then-escalating Vietnam War ended the streak.
- 1995–1999: This was the only five-consecutive-year streak of double-digit gains for large-cap stocks since 1926. Gains of 37.6% in 1995, 23.0% in 1996, 33.4% in 1997, 28.6% in 1998 and 21.0% in 1999 were realized. The dot-com bubble that formed over this period was caused by the release of web browsers, the launch of Yahoo’s search engine and rising sales of personal computers. The bubble peaked in early 2000, followed by both a bear market and a recession.
- 2012–2014: Following the market’s 2011 jitters over the Greek debt crisis, large-cap stocks rose as the economy grew, interest rates remained low and the housing market continued to recover from the global financial crisis. Large-cap stocks reflected the improving environment by rising 16.0% in 2012, 32.4% in 2013 and 13.7% in 2014. A crash in Chinese stocks along with Greek defaulting helped lead to a flat stock market in 2015.
- 2019–2021: Other than the very short bear market of February and March 2020, the coronavirus pandemic did not stop large-cap stocks from following 2019’s 31.5% rise with an 18.4% gain in 2020 and a 28.7% jump in 2021. Interest rates were low, and the economy was growing in 2019. Both monetary and fiscal stimulus combined with the quick development and release of vaccines helped extend the good returns during the pandemic. Rising inflation led to the 2022 bear market.
- 2023–2025: The inflation pullback, loosening monetary policy and the rapid growth of artificial intelligence (AI) are responsible for the current streak of double-digit gains. Last year’s 17.9% rise was preceded by gains of 26.3% in 2023 and 25.0% in 2024.
As you can see, five of the seven prior streaks of double-digit gains ended after three years. The 1949–1952 streak lasted four years, while the dot-com bubble streak lasted five years.
Notably, though losses were realized in six of the seven years following those streaks, most of those calendar-year losses were modest.
When looking at the data, it is important to understand that bull markets don’t die of old age. Rather, an event or combination of events occurs to end them. We can say the same about streaks of double-digit gains. The good run for stocks will continue until something disrupts it. The uncertainty of what that will be and when it will occur is part of the embedded risk of investing.

-
Stock Market Retreats and Recoveries
Only six months, on average, have separated the end of one decline and the start of the next one, but recoveries have been quick. -
The Danger of Getting Out of Stocks During Bear Markets
Panicking and pulling out of stocks during turbulent market conditions can have a significant and lasting negative impact on your wealth. -
2025 Review of AAII Stock Screens: Wanger’s Zebras Break From the Herd
The January AAII Journal reports that 78% of the stock screens AAII tracks posted gains during 2025, with an average gain of 14.7%.
AAII Sentiment Survey
Optimism among individual investors about the short-term outlook for stocks increased in the latest AAII Sentiment Survey. Meanwhile, both neutral sentiment and pessimism decreased.
Bullish sentiment, expectations that stock prices will rise over the next six months, increased 7.0 percentage points to 49.5%. Bullish sentiment is unusually high and is above its historical average of 37.5% for the seventh time in 10 weeks. Optimism was last higher on November 14, 2024 (49.8%).
Neutral sentiment, expectations that stock prices will stay essentially unchanged over the next six months, decreased 5.2 percentage points to 22.3%. Neutral sentiment is unusually low and is below its historical average of 31.5% for the 78th time in 80 weeks.
Bearish sentiment, expectations that stock prices will fall over the next six months, decreased 1.8 percentage points to 28.2%. Bearish sentiment is below its historical average of 31.0% for the fifth time in seven weeks.
The bull-bear spread (bullish minus bearish sentiment) increased 8.8 percentage points to 21.3%. The bull-bear spread is above its historical average of 6.5% for the 11th time in 50 weeks.
This week’s special question asked AAII members how their portfolio performed in 2025 relative to their expectations.
Here is how they responded:
- Much better than I expected: 21.3%
- Better than I expected: 46.6%
- Close to how I expected: 20.2%
- Worse than I expected: 9.1%
- Much worse than I expected: 2.0%
Bullish: 49.5%, up 7.0 points
Neutral: 22.3%, down 5.2 points
Bearish: 28.2%, down 1.8 points
Bullish: 37.5%
Neutral: 31.5%
Bearish: 31.0%
See more Sentiment Survey results.

January 8, 2026 The New Features in Our Rebuilt My Portfolio
January 1, 2026 2025's Most-Read Investor Updates: The New Tax Law, Buffett and More
December 18, 2025 December Charts of Interest: Changes Among the Interest-Rate Setters
December 11, 2025 S&P 500 Stocks With the Potential to Outperform in 2026

Discussion
Barry from TX posted 8 months ago:
Charles, you concluded, “bull markets don’t die of old age. Rather, an event or combination of events occurs to end them. We can say the same about streaks of double-digit gains. The good run for stocks will continue until something disrupts it. The uncertainty of what that will be and when it will occur is part of the embedded risk of investing.’ Charles, can we call this “The Hemingway Effect?” This is essentially the same principle Hemingway derived about the fate of bulls the bull-fighting process in his magnum opus, “Death in the Afternoon” -- the bulls die for the process to end, AND, it was the final realization about the movable feasts of Lost Generation lovers, Brett and Jake, in “The Sun Also Rises,” when in the taxi, Brett says to Jake, "It isn't all that you know" and Jake replies, "No, but it always gets to be."
Rob from NC posted 8 months ago:
I would change that last sentence, deleting "part of the embedded risk" and replacing it with "a mere facet." That is, I do not regard uncertainty about the future as a "risk." It is merely a facet of life and of investing. It's just a part of the game. Uncertainty and changing circumstances merely present new opportunities. New events nobody's ever seen before happen all the time. Maybe this time we'll see a seven-year double-digit gain. Or maybe it will be 1929 again. Either way, I'm going to stay the course with my 100% equities. If it turns out to be 1929 again, I'll use the opportunity for reallocation. If the rocket keeps going up, I'll just enjoy the ride.
Barry from TX posted 8 months ago:
#1 In every random series of data -- such as a series of market outcomes measured over regular time periods -- you should expect to see a series of "runs" where performance levels are similar, i.e., positive or negative. In fact, if this did not occur, you should be suspicious that the data series is real. Backtesting introduces the temptation to choose favorable starting and end-points for the range and an easy measurement to document. #2 Persistent (YOY in this case) performance is difficult to sustain because there are many interacting, opposing factors moving in opposing directions that impact performance at opposing levels (amounts) and trajectories (direction). #3 Charles Dow, founder of the WSJ and DJIA, compared these effects to repetitive patterns created by ocean waves washing up on a beach, but his theory went underappreciated. #4 Similar effects have been observed in the persistence of active mutual fund manager performance. Unlike AMFs, ETF FMs measure their performance versus a market index (like Dow's DJIA) and thus do not try to outperform their benchmark index but try to manage ETF performance as close as possible to the reference index performance using tracking error. Thus EFT FMs achieve much better fund management performance pesistence, although it ususally below but very near the BM.
You need to log in as a registered AAII user before commenting.
Create an account