

December Charts of Interest: Changes Among the Interest-Rate Setters
by Charles Rotblut | December 18, 2025
Featured Tickers: ALB
JBHT
LUV
ALB
JBHT
LUV
The future direction of monetary policy headlines this year’s final charts of interest. I look at the latest policy projections as well as the upcoming changes in who gets to vote on Federal Open Market Committee (FOMC) decisions. I then turn to the subjects of how consumers are feeling about holiday shopping, the stocks analysts think will have the biggest price increases and decreases, and the traits investors seek in exchange-traded funds (ETFs). And since it is the holiday season, I end with this year’s cost of Christmas.
Just One Interest Rate Cut Next Year?
The FOMC’s latest projections call for just one quarter-point (0.25%) interest rate cut next year. There is dispersion among those projections, as the dot plot below shows. The bottom dot is once again attributable to Federal Reserve governor Stephen Miran.
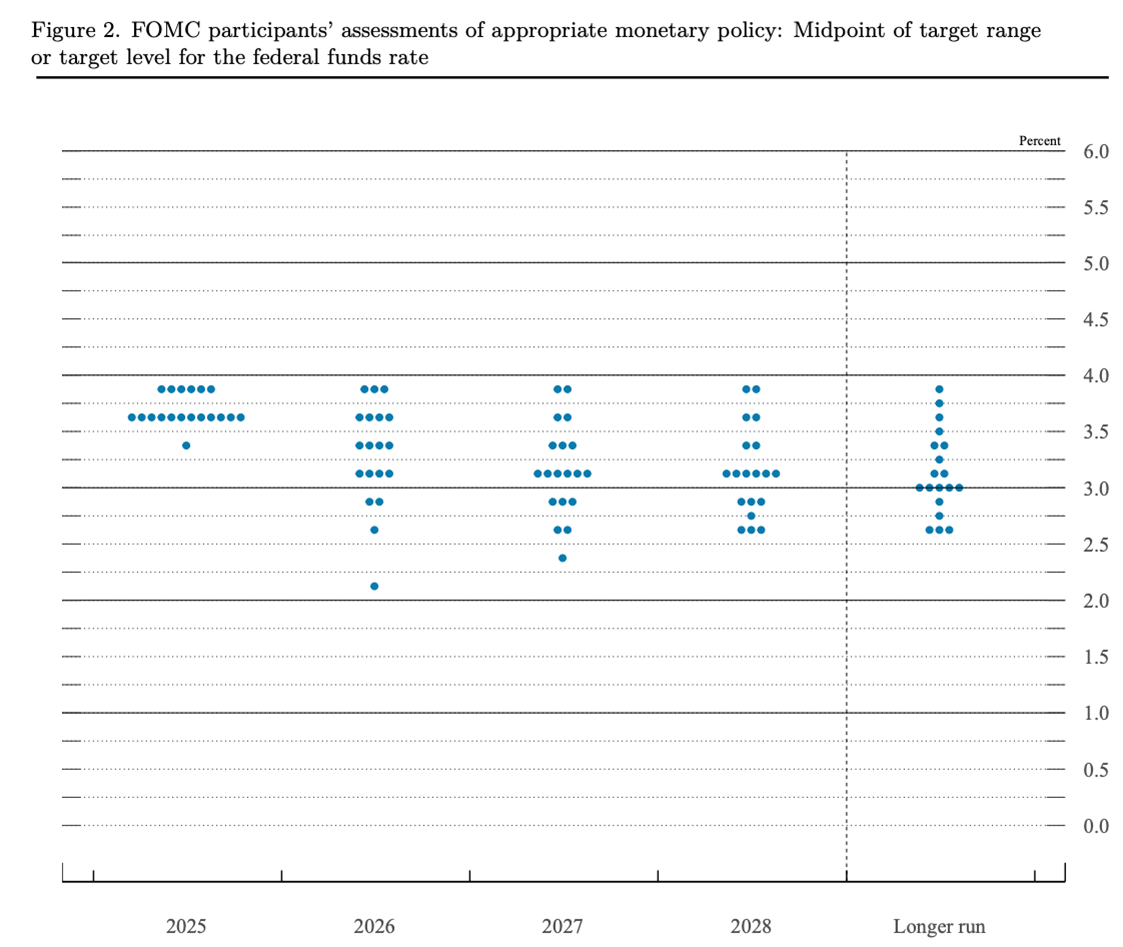
Source: Federal Open Market Committee.
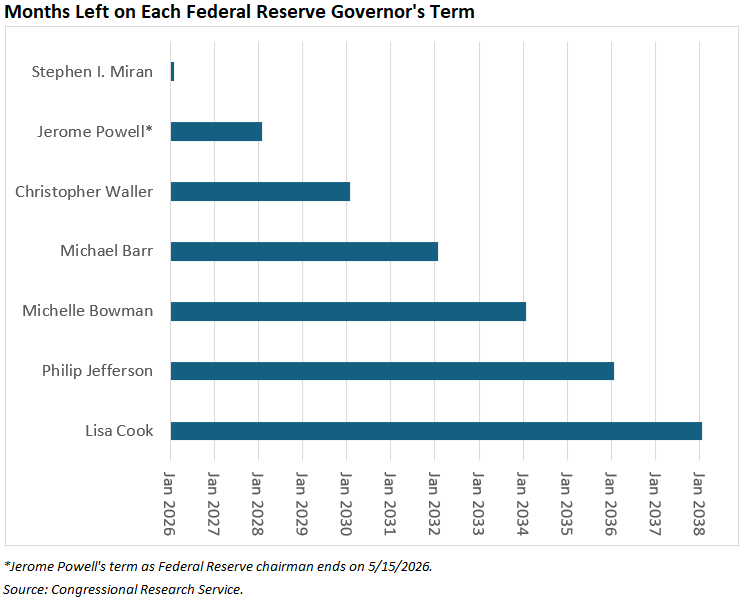
How much the FOMC cuts interest rates next year will depend in part on who President Donald Trump appoints. Miran’s term as a Fed governor will expire at the end of January 2026. Jerome Powell’s term as Fed chairman expires in May 2026, but his term as a Fed governor does not expire until 2028. Powell has not said whether he intends to complete his term as governor.
Atlanta Federal Reserve president Raphael Bostic will retire in February 2026. His replacement, who will be selected by a group of the regional bank’s directors, will not serve as a voting member of the FOMC until 2027. The Cleveland, Philadelphia, Dallas and Minneapolis bank presidents will rotate in as voting members in 2026. The Wall Street Journal describes three of these regional bank presidents as having recently made hawkish comments.
Consumers Are Feeling Bah Humbug
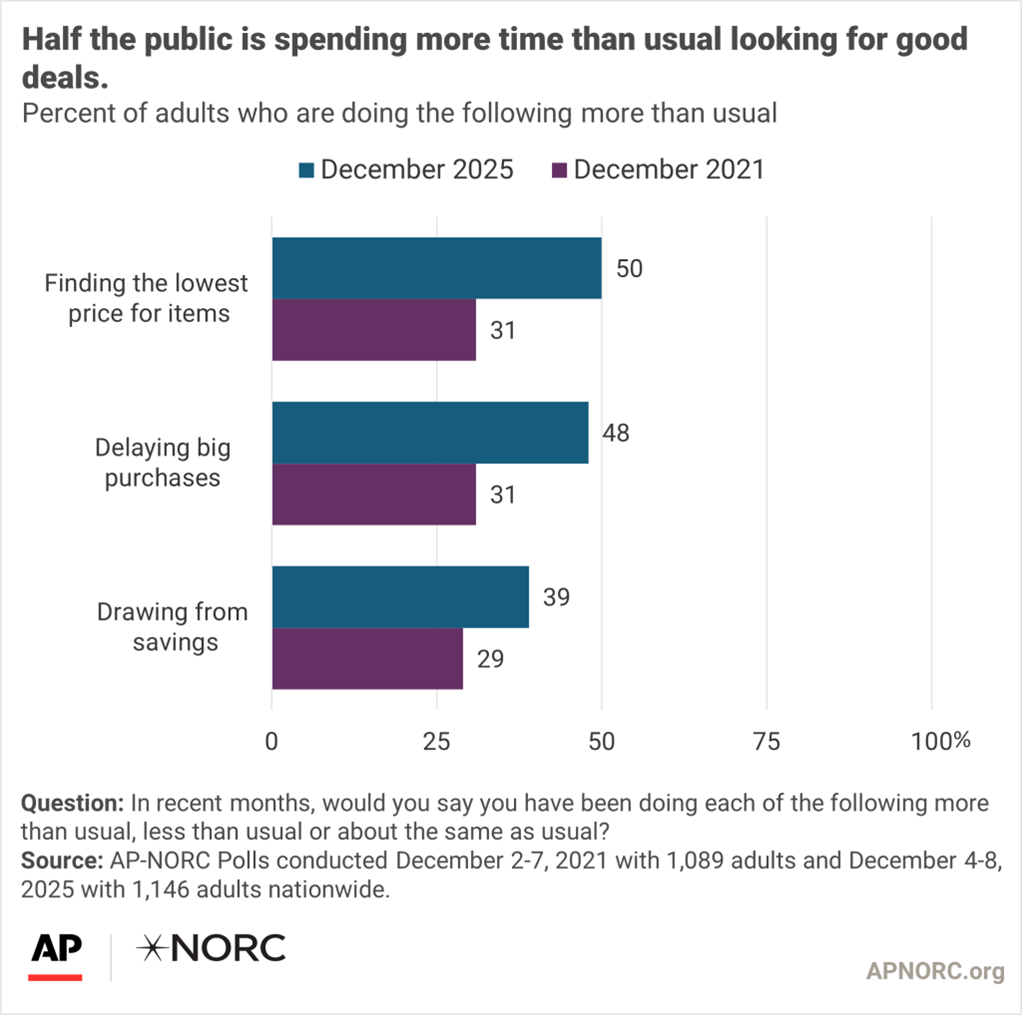
A poll from the Associated Press and NORC found that “More Americans are tightening their belts this holiday season compared with the last time this question was asked in December 2021 as inflation was starting to climb.” Lower- and middle-income adults in particular are finding it harder to afford the gifts they want to give.
Analysts’ Biggest Winners and Losers for 2026
FactSet listed the S&P 500 index stocks that analysts expect to see the largest share price increases and decreases in 2026. Both the gains and losses were calculated as the difference between the median of analysts’ 2026 price targets and each stock’s closing price as of Thursday, December 11, 2025.
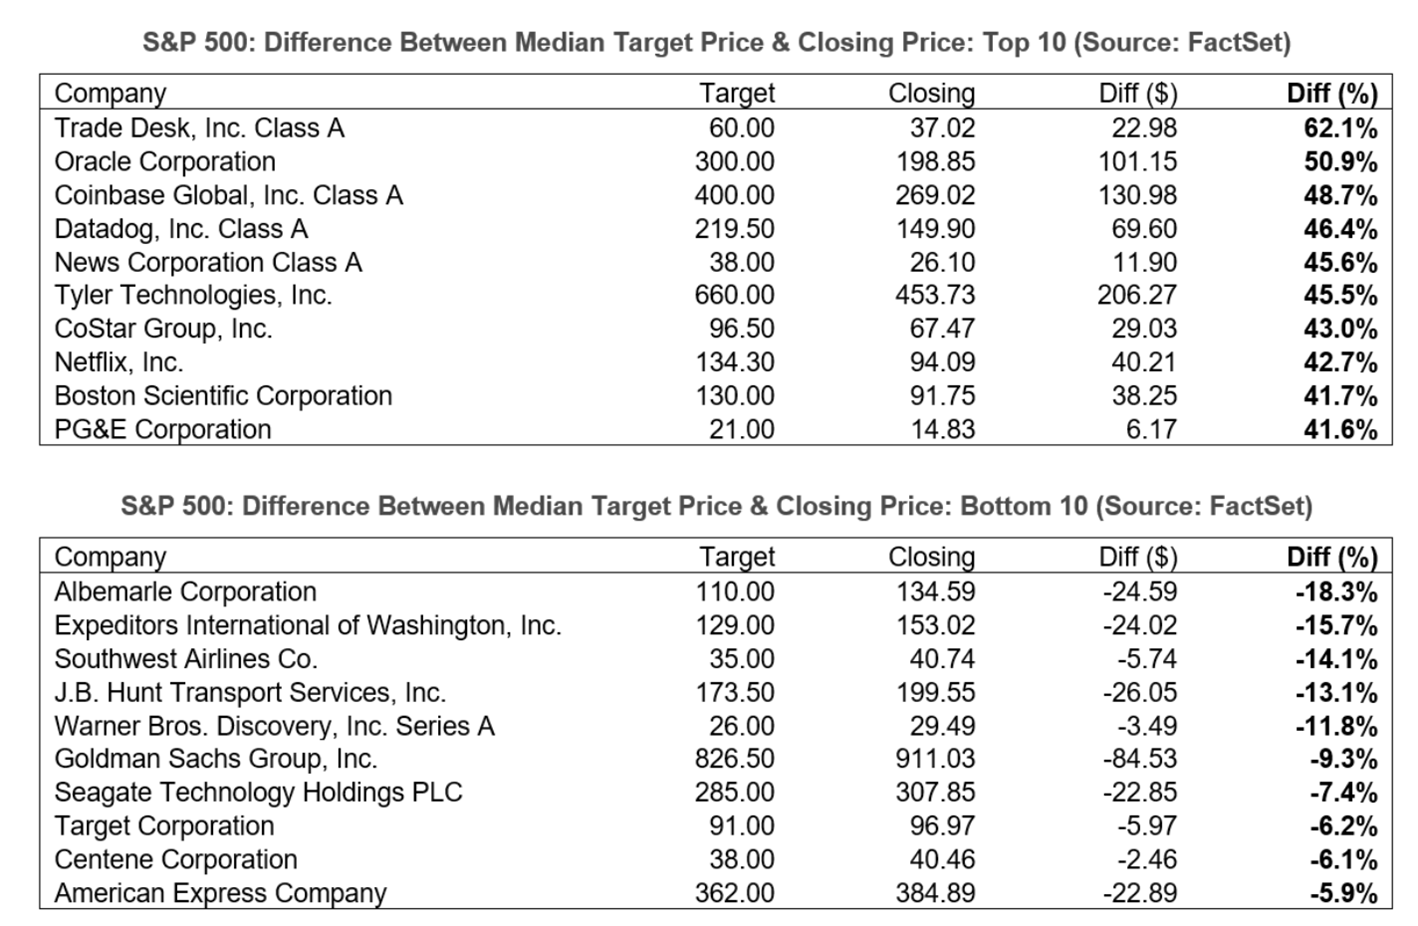
Contrarians may want to note the presence of Albemarle Corp.  (ALB), Southwest Airlines Co. (LUV) and J.B. Hunt Transport Services Inc. (JBHT) in the Bottom 10 chart. These three companies were all on the list of stocks with the potential to outperform that I shared in last week’s Investor Update.
The high level of dispersion among analysts’ earnings expectations for these three stocks increases the likelihood of the current price targets being way off. We just don’t know whether the price targets will end up being too pessimistic or too optimistic.
Investors Focus on Cost When Selecting an ETF
Total cost remains the top factor investors consider when selecting an exchange-traded fund (ETF), according to Charles Schwab’s 2025 ETFs and Beyond Study. However, the discount broker did not define total cost. I point this out because low expense ratios ranked sixth in terms of the most important factors picked.
We define the total cost of an ETF as including the expense ratio, tax cost, difference between the bid and ask prices and tracking error—that is, the difference between the ETF’s net asset value (NAV) and its trading price. The expense ratio, tax cost ratio and tracking error can all be found on an ETF’s Evaluator page on AAII.com. Just type the ETF’s name or ticker symbol into the search box located at the top of any page on our website.
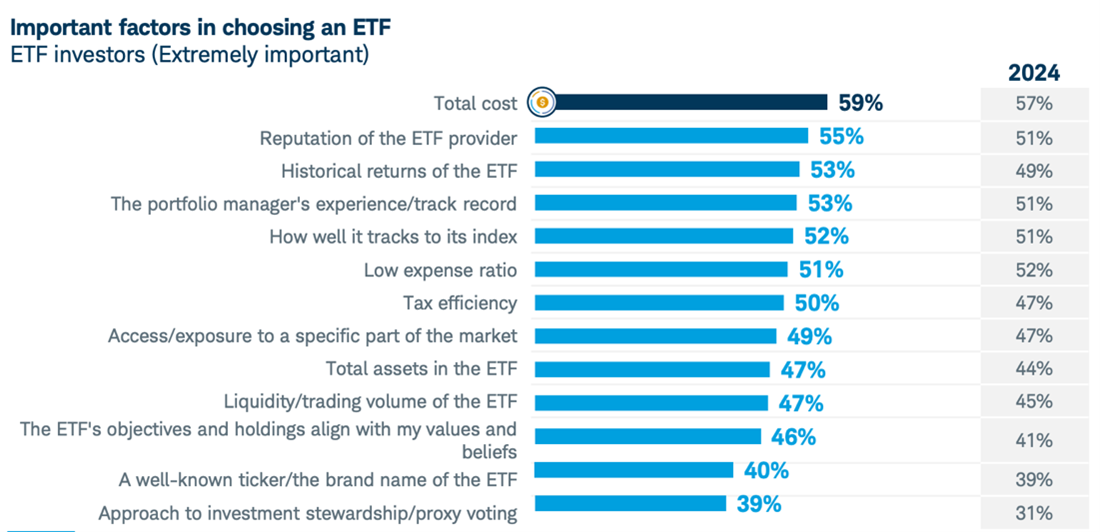
Source: Charles Schwab Asset Management.
Christmas Will Cost 4.5% More This Year
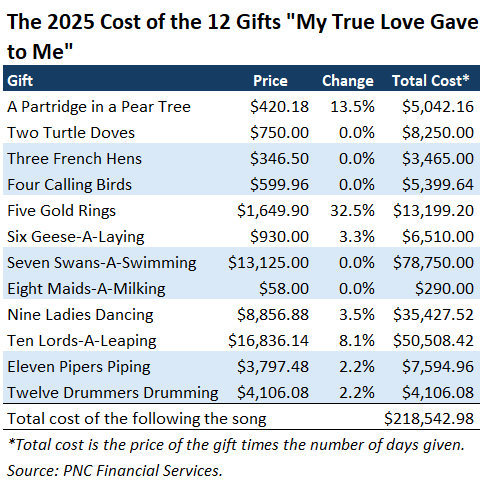
PNC Financial Services’ latest Christmas Price Index reveals that the cost of buying all 12 gifts from the song “The Twelve Days of Christmas” is 4.5% higher relative to one year ago. Buying all the gifts just once will cost you $51,476.12. If you want to truly treat your true love by following all of the song’s verses, you will need to spend $218,542.98 (and have a pool large enough for all those swans to swim in).
Gold rings were the biggest contributor to the increased cost, jumping 32.5%. Partridges in a pear tree were more expensive because higher lumber costs increased the price of trees. The lords-a-leaping will charge you 8.1% more because of the higher aggregate cost of performers.
PNC Financial Services chief investment officer Amanda Agati said tariffs did not impact the cost of Christmas. Why? “Because True Love’s shopping list only includes domestically produced goods and services.”

-
Fed Signals That Investors Should Watch and What They Mean
Incorporating Federal Reserve policy shifts into an investing model rooted in 12 market anomalies. -
Why ETFs Can Trade at Premiums and Discounts to Their Net Asset Value
ETFs trade at prices either above or below their net asset value due to supply and demand imbalances that are influenced by a variety of factors. -
AAII 2025–2026 Tax Guide: Specific Tax Guidelines for Individual Investors
The December 2025 AAII Journal covers how investment decisions, retirement withdrawals, charitable donations, RMDs, home sales and new OBBBA provisions affect your taxes—plus strategies to reduce liability.
AAII Sentiment Survey
Pessimism among individual investors about the short-term outlook for stocks increased in the latest AAII Sentiment Survey. Meanwhile, optimism and neutral sentiment decreased.
Bullish sentiment, expectations that stock prices will rise over the next six months, decreased 0.4 percentage points to 44.1%. Bullish sentiment is above its historical average of 37.5% for the third time in six weeks.
Neutral sentiment, expectations that stock prices will stay essentially unchanged over the next six months, decreased 2.2 percentage points to 22.7%. Neutral sentiment is below its historical average of 31.5% for the 74th time in 76 weeks.
Bearish sentiment, expectations that stock prices will fall over the next six months, increased 2.6 percentage points to 33.2%. Bearish sentiment is above its historical average of 31.0% for the 45th time in 47 weeks.
The bull-bear spread (bullish minus bearish sentiment) decreased 3.1 percentage points to 10.9%. The bull-bear spread is above its historical average of 6.5% for the seventh time in 46 weeks.
This week’s special question asked AAII members how the rise of passive investing (index funds/ETFs) affected their investing strategy.
Here is how they responded:
- I use a mix of investments and haven’t changed my approach: 34.7%
- I’ve moved more money into passive investments: 29.2%
- It hasn’t affected my strategy at all: 26.9%
- I’ve moved more money into active investments to differentiate: 5.6%
- Not sure/no opinion: 2.8%
Bullish: 44.1%, down 0.4 points
Neutral: 22.7%, down 2.2 points
Bearish: 33.2%, up 2.6 points
Bullish: 37.5%
Neutral: 31.5%
Bearish: 31.0%
See more Sentiment Survey results.

December 11, 2025 S&P 500 Stocks With the Potential to Outperform in 2026
December 4, 2025 Don't Judge a Stock by Its High or Low Share Price
November 27, 2025 Important Family Conversations for Thanksgiving Weekend
November 20, 2025 November Charts of Interest: The S&P 500 Tends to Finish Strong

Discussion
Barry from TX posted 9 months ago:
Charles, thanks for the excellent Christmas present. This COI balances the Janus need to be reflective and prospective as doors close and open from Christmas to Epiphany. (1) The FOMC shuffle shifts about half of the 11 voting FOMC to Midwest hawks. That one-off FFR increase in 2026 may change. (2) STL Fed’s Charles S. Gascon surveyed several reliable sources on their estimates for 4 key economic indicator estimates for 2026 -- Real GDP Growth, CPI Inflation Rate, Unemployment Rate, and 10-Year Treasury Yield – all important to FOMC decision-making and AAII investor planning. Available @ https://www.stlouisfed.org/on-the-economy/2025/dec/professional-forecasters-past-performance-outlook-2026. Good data for portfolio planning and demystifying the fog of the FOMC. (3) I have found the surveys contractor Logical Research conducts for SCHW to be very superficial because they are based on very weak surveying protocols (i. e, internet only, and skewed demographics designed to serve the SCHW RIA base, not IIs. Demographics on page 48 are misaligned with AAII membership base profiles inthe recent question cited above. (4) Wikipedia says “The 12 Days” poem originated in England around 1780. Several academic researchers have extended the origins of market prices back to around 1800. Thus, we have “reconstructed data” to compare the wisdom of investing in the “12 days” versus investing in stock markets. I’m betting markets were a better choice then and now. (5) PNC Financial Services saying tariffs did not impact the cost of Christmas “because True Love’s shopping list only includes domestically produced goods and services” is cheery, but wrong. Data from GS, MS, and investment houses say domestic prices are up about 5% versus 10%-15% for ex-US imports subject to tariffs. Bah Humbug.
Barry from TX posted 9 months ago:
Charles, in chart 1, the FOMC FFR rate dot plot, do the dots in the "Longer Term" projection look like a hypodermic needle? Is that a potential "booster shot" if the prior FFR cuts don't "move the needle"?
Charles Rotblut from IL posted 9 months ago:
Barry,
Now that you pointed it out, I may never stop noticing it. :)
Merry Christmas.
You need to log in as a registered AAII user before commenting.
Create an account