


Related

AAII Sentiment Investing
Incorporating Federal Reserve policy shifts into an investing model rooted in 12 market anomalies.
Charles Rotblut leads a class in AAII's new Essential Investing Video Course. Go to https://www.aaii.com/ves for more information and to subscribe.
Robert R. “Bob” Johnson, Ph.D., CFA, CAIA, is the chairman and CEO of Economic Index Associates and a professor of finance at Creighton University’s Heider College of Business. Gerald R. “Gerry” Jensen, Ph.D., CFA, is a director and the chief investment officer (CIO) at Economic Index Associates. Economic Index Associates provides the underlying index for the exchange-traded note ETRACS IFED Invest with the Fed TR Index ETN  (IFED). Cynthia McLaughlin and I spoke to them about how monetary policy impacts stock prices.
—Charles Rotblut, CFA
Charles Rotblut (CR): Could you explain the link you found between changes in the monetary environment and the returns of stocks?
Robert Johnson (RJ): Gerry and I started by empirically documenting the idea that when the Federal Reserve changed policy, markets reacted. Specifically, we found that when the Fed changed the discount rate (the rate the central bank charges to banks needing to borrow money), markets reacted. The short explanation is, when the discount rate went up, equity prices went down, and when the discount rate went down, equity prices went up.
We quickly moved from event studies of very short-term returns in the market to looking to see if there were long-term patterns. We found that there were long-term relationships not just in the stock market, but in several markets that were related to Fed monetary policy.
With respect to equities, we found that when the Fed’s monetary policy was expansive, the equity markets did very well overall. It was the opposite for restrictive monetary policy. Returns for equities were lower.
Gerald Jensen (GJ): I think a lot of people want to narrowly define our research and assume that all we’re looking at is monetary conditions. We use Fed policy signals as an indicator of economic conditions because you can’t really separate monetary and economic conditions. The Fed makes policy changes based on both current economic conditions and what it forecasts in the future. So, we say that our strategy basically captures a change in economic conditions.
A change by the Fed signals that it believes that current conditions warrant a preemptive shift to either an expansive policy or a restrictive policy. We believe that this shift then introduces a period in which investors change their pricing decisions and firms change their operating decisions.
Certain types of companies prosper under different conditions. The Fed looks at two major factors: price stability (or inflation) and economic activity (which translates into employment). When the Fed signals that it sees problems with inflation, we believe the types of firms that prosper are very different from those that prosper when the Fed signals that its biggest concern is unemployment or economic conditions.
We have 12 firm-specific characteristics that we use to identify those companies that are likely to prosper when the Fed signals that economic conditions are its biggest concern, as well as those that will likely prosper when the Fed signals that inflation is its biggest concern (see the box below for the list).
The 12 firm-specific characteristics below are used to identify companies that are expected to prosper when the Federal Reserve signals that economic conditions are its biggest concern. They are also used to identify companies that are expected to prosper when the Fed signals that inflation, or price stability, is its biggest concern. As you can see from the list of characteristics, the strategy favors stocks with financial strength and stability.
Source: Economic Index Associates, IFED Methodology.
I think a lot of investing strategies make the mistake of focusing on whatever is most recent. Those tend to be fleeting patterns. In our research, which goes back to the 1960s, we ferreted out those patterns that were fleeting from those that were systemic. There certainly are periods of time where our strategy underperforms, but ultimately, those long-term, systemic patterns tend to prevail.
RJ: I should point out just how we got to where we are. We founded a firm called Economic Index Associates in 2018. We didn’t set off to form a firm that developed a money management strategy. Gerry and I were finance academics, and we did research because that’s what you do.
To give you an example of what, to me, was a big finding, we published an article in the Financial Analysts Journal showing that the well-known small firm effect was basically only present in expansive Fed monetary periods. That is, there was a small firm effect in expansive periods, but there was no discernible small firm effect in indeterminate or restrictive periods. The only time the small firm effect showed up was when the Fed was pursuing an easy money policy.
We looked at many different characteristics, such as dividend yield and momentum, and, lo and behold, there were patterns in all of them. So, we published the findings in our book “Invest with the Fed: Maximizing Portfolio Performance by Following Federal Reserve Policy” (McGraw-Hill, 2015).
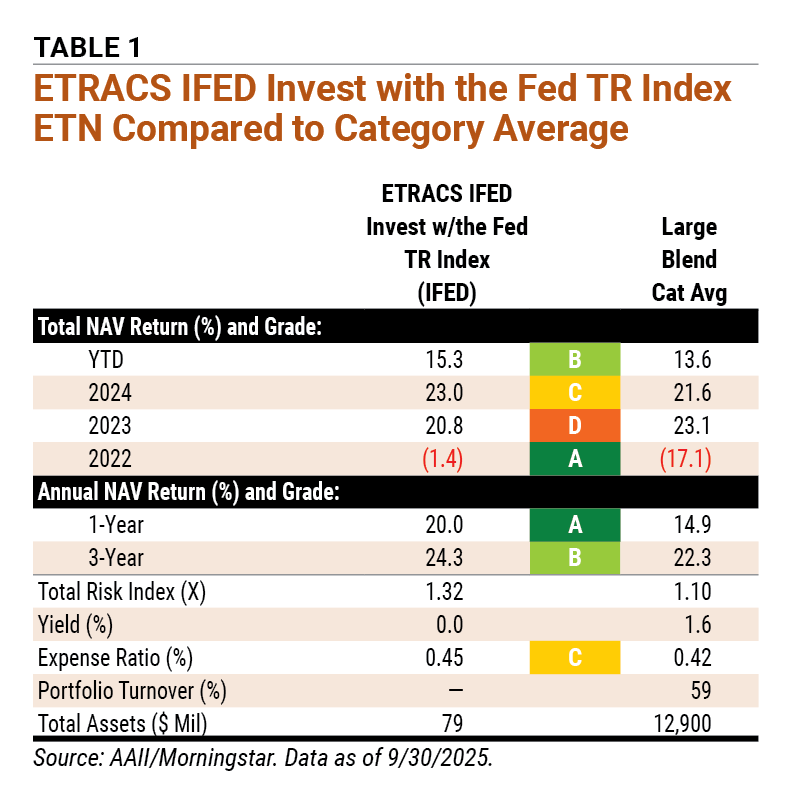
I did a lot of interviews regarding the book, and the question I would get peppered with was, “How can I invest according to these findings?” Gerry and I also presented the book at several industry conferences, and we kept getting asked the question, “How can we invest?” So, we decided to found Economic Index Associates. We license our “Invest with the Fed,” or IFED, strategy through the firm, and currently, over $600 million is managed according to our large-cap strategy. [Table 1 shows performance and risk statistics for the ETRACS IFED Invest with the Fed TR Index ETN.]
GJ: To provide an overall view of how our strategy works, I like to highlight that, to some extent, each of the 12 different metrics we use aligns with a market anomaly. Other academics identified the 12 market anomalies; we showed that each of those anomalies differs substantially across the market environments based on Fed policy.
For example, as Bob pointed out, we found that the small firm effect is very pronounced in expansive periods and nonexistent in other periods. There’s also a cash effect, which we found is very prominent in restrictive periods and nonexistent in other periods. So, you have these big swings. In 2020, the value premium was –47%, and in 2023, the momentum premium was –25%.
Investors have asked, “Wouldn’t it be nice if there was a strategy that would avoid those particular stocks leading up to these big negative effects and promote the big positive effects?” That’s basically what our strategy does: It avoids the big out-of-favor observations or events. We do that not with just one or two anomalies; we focus on 12 different anomalies.
None of those anomalies are unique. As I mentioned, other academics identified and promoted them. We just applied our methodology to them and found out that the return patterns differed based on the market environment.
CR: The media focuses on the direction of interest rate cuts, but you’re saying that investors should really pay more attention to the discount rate than the federal funds rate, correct?
RJ: We care more about what the Fed does than what it says.
GJ: To some extent, we believe that changes to the primary credit rate, also referred to as the discount rate, signal the Fed’s long-term intentions—what it plans to do looking forward for the next several months. We then look at the average monthly effective federal funds rate as an indicator of what the Fed is actually doing in the short-term market.
Occasionally, the Fed will signal that it’s going to either loosen or tighten, but if you look at what it does in the short-term market, it doesn’t actually carry through. Sometimes the Fed signals a policy change but doesn’t follow through in practice.
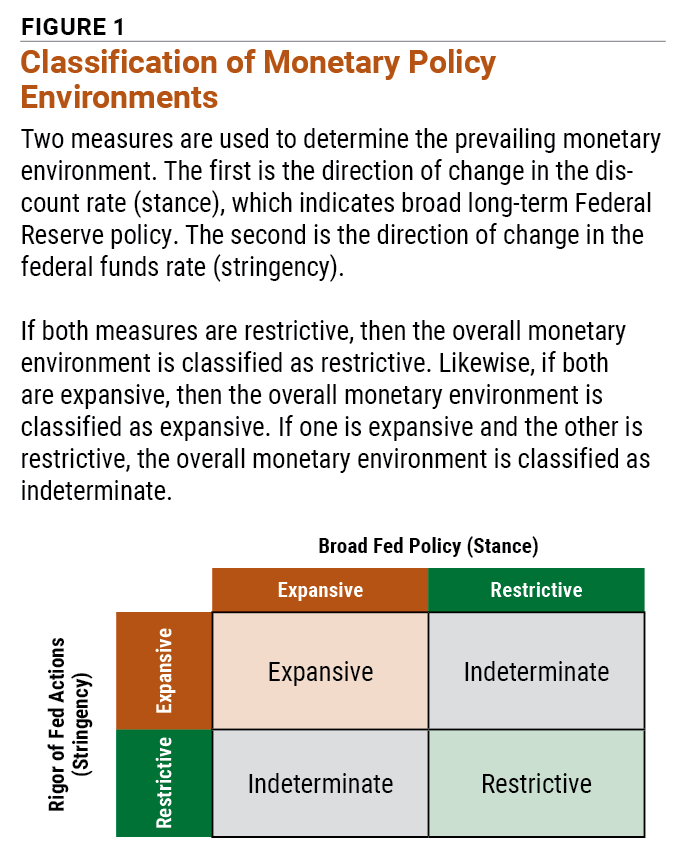
So, we monitor those two different rates in order to see if the Fed is carrying through with what it signaled. If the primary credit rate and the average federal funds rate match up, then we get either an expansive or a restrictive market environment. If they contradict each other, we end up with a mixed, or indeterminate, market environment (Figure 1).
RJ: One of the most consistent findings in all our research is that it’s not the level of interest rates that matters, it’s the direction of change in interest rates—the delta. When Gerry says that we look at the Fed’s effective federal funds rate for short-term movements and its primary credit rate for long-term strategy, he’s specifically referring to the direction of change.
For example, an expansive period is when the change in both of those rates has been a decrease. So, if the last change in both the primary credit rate and the monthly effective funds rate was a decrease, we say that monetary conditions are expansive. If the last change in both rates was an increase, we say that monetary policy is restrictive. If the rates are moving in opposite directions, with one increasing and one decreasing, we say that monetary conditions are indeterminate.
GJ: When the rates indicate expansive monetary conditions, we would further say that the Fed is signaling that its primary concern is economic conditions, or the unemployment rate. If we’re in a restrictive environment—meaning that both rates have increased—the Fed is signaling that its primary concern is price stability, or inflation. It’s not that the Fed is dismissing the other concerns completely; rather, it’s saying that its primary focus has shifted.
The Fed has a dual mandate: maintain price stability and work toward full employment. Those two goals tend to be somewhat contradictory, in that if you’re focusing too much on economic conditions, inflation might get out of control, and vice versa.
CR: How do you view the current environment as we speak in September 2025?
RJ: Right now, it is expansive. That is contradictory to what many analysts think. But again, we base our perspective on what the Fed does, not what the Fed or anybody else says.
GJ: We don’t have a lot of changes in our rebalance points because the Fed doesn’t shift policy all that often. Since we emphasize the primary credit rate, we’re basing our strategy on the Fed’s signal of its intentions and broad policy for the long term. For the Fed to reverse course, it would have to really blow it. It seldom does that.
When the Fed signals a long-term policy, it tends to extend for at least 12 months. For a significant percentage of our rebalances, we’re just updating the accounting and return metrics. The Fed hasn’t shifted its policy, but firms’ financial metrics have changed, so we update our metrics and holdings accordingly. Our objective is to identify firms with holdings that will allow them to prosper in the market environment the Fed is currently signaling.
One way our holdings could become misaligned is if the Fed changes its signal. The other way is if firm metrics change—for example, a company’s price increases substantially, and it goes from being a value stock to a growth stock. Our methodology tends to favor value stocks over growth stocks.
RJ: We undertake a rebalance based on refreshed metrics in June because the metrics for firms from annual report data are refreshed in the first half of the year. But we only rebalance in June if a prior rebalance due to a market environment change hasn’t occurred.
Cynthia McLaughlin (CM): Do investors attempting to implement your approach need to act quickly if there is a change in the market’s environment, or could they wait a month or so to make any portfolio changes?
GJ: Our strategy isn’t based on a short-term event. We tend to find that you don’t have to react quickly. Sometimes the pattern shows up fairly soon, but in other cases, it will lag considerably. So, we don’t advocate this as a short-term trading strategy. It’s a long-term approach.
CR: You mentioned that your follow-up research continues to confirm your findings. Has anything changed since you published your book in 2015?
RJ: No. People always ask questions like, “How do you take Brexit into account?” or “How do you take the Greek debt crisis into account?” There’s always a reason the market isn’t the same. There are always going to be these idiosyncratic factors that pop up, but it seems like there are some consistent things that remain embedded throughout the markets.
I didn’t think our idea was that outstanding, but when we overlaid Fed policy on all these anomalies—the small firm effect, the dividend yield effect, the value effect, etc.—we found many systemic patterns.
CM: Could this strategy be adapted to other assets?
RJ: Absolutely, if the data is available. We’ve found that the patterns we’ve identified also exist in commodities markets. Since the U.S. is the largest market, the Fed also has a tremendous influence in international markets.
So far, people have been most interested in applying our strategy to large-cap stocks, but it applies to all types of assets. The strategy has done exceedingly well over the last 10 years when applied to a small-cap universe. As was stated earlier, small-cap stocks tend to prosper when the Fed is in an expansive mode.
CR: Is there something we didn’t ask you that we should have?
GJ: There are other models that try to adjust the portfolio based on economic conditions. We’ve looked at some different alternatives, and we keep coming back to our belief that the Fed gives us the best insight. There are reasons for that. First, as I pointed out before, the Fed does not adjust based on the past. It looks at the past and present, but it’s probably most concerned about the future. So, when the Fed shifts policy, which is what we look for, it bases the change on its biggest concern going forward. We believe that our incorporation of Fed policy shifts is an advantage of our model.
Secondly, who has more power than the Fed to influence the market? It significantly influences the amount of funding in the economy, so not only does it look forward and signal what it’s going to do, it also has an extremely powerful tool. Money drives the market, and since the Fed controls the amount of money in the economy, we believe that relying on the Fed gives us an upper hand over a lot of these other models that look at economic data. This is certainly not a new idea. Renowned investor Martin Zweig famously said in the late 1970 or early 1980s, “In the stock market, as with horse racing, money makes the mare go.”
Obviously, there have been numerous alternatives proposed, but we’ve shown that our system of separating the economic environments into these three different categories can accurately predict changes in a number of underlying economic variables—for example, borrowed reserves, adjusted monetary base and total reserves. All of those things tend to track our environment so that we see significant differences in fund availability.
AAII Sentiment Investing

Portfolio Strategies


BARRY J from TX posted 11 months ago:
BARRY J from TX posted 11 months ago:
BARRY J from TX posted 10 months ago:
You need to log in as a registered AAII user before commenting.
Log InCreate an account