


Related

Stock Strategies
Comparing changes in given metrics and their relative performance allows us to assess if economic activity is accelerating or decelerating and adjust our portfolio allocations if desired.

Just as weather forecasts are used by prudent sailors before setting out from port and by mountaineers attempting a summit, measures of economic activity offer insight into future business and stock performance.
The Federal Reserve looks at slack or idle resources to gauge the health of the economy and set monetary policy. Statistics on unemployment and average hourly wages, factory capacity utilization and oil prices provide insight into how much economic activity is currently taking place. It also shows if the economy is increasing or decreasing, and whether in the near term there is likely to be upward pressure on wages and commodity prices with a corresponding decrease in margins and corporate profits.
Financial analysts use these measures to derive forecasts of future cash flows and interest rates, and asset managers use them to determine their asset allocations. Investors also pay careful attention to economic forecasts. If inflation is expected to increase, for example, bond investors will demand higher yields, while equity investors are likely to avoid firms that they consider unable to pass on increased costs to their customers.
Because so much attention is paid to key economic reports, their release can lead to significant swings in the market. This is due to the interpretation of the data by market players who use it to make inferences about the current and future states of the economy.
Investors often set their expectations for stocks and bonds using a wide variety of economic indicators. If they expect the U.S. dollar to rise, they might anticipate reduced corporate profits for multinational firms. A decrease in commodity prices or an increase in yields on high-yield bonds might suggest an economic downturn. Some investors monitor oil prices, buying stocks when oil prices rise and exiting when oil retreats. In recessions, investors might expect that cash-rich firms and those with stable cash flows and low debt burdens will have better odds of outperforming on a relative basis.
Changes in gasoline prices will affect the disposable income available to consumers and provide insight into future consumer spending and gross domestic product (GDP) growth. According to the U.S. Energy Information Administration (EIA), in 2019 the U.S. used about 390 million gallons of gas per day. If the average price per gallon increased by 50 cents, that would translate into an additional daily expense of $195 million, with a concomitant reduction in other spending or investment.
Auto sales can shed light on consumer optimism. Someone who is confident enough to purchase a big-ticket item such as a car likely does not anticipate being laid off in the near future and is likely to also spend on other items. Given that auto sales are predominantly on credit, an uptick in car sales suggests that consumer lending may be improving, which is typically a bullish sign for the economy.
Even the level of the stock market itself reflects how optimistic or pessimistic investors are concerning future prospects for company earnings and the economy.
Economic indicators are updated periodically, typically monthly, some by the government and others by third parties such as the Conference Board. They fall into three categories.
By comparing year-over-year changes in given metrics, and by the relative performance of leading indicators and coincident ones, we can assess if economic activity is accelerating or decelerating.
Some indicators, such as those published by the Institute for Supply Management (ISM) are diffusion indexes that show a rate of change. A level above 50 signals improvement. Others show an absolute level, such as GDP. Some are adjusted to remove the effect of seasonal factors. Employment reports are calculated in this way because construction and agriculture employment often decline in winter months.
When using an indicator, investors should seek to understand its nature, the time lag between the collection of the data and its publication, any changes in index composition and calculation methodology and data measurement errors such as survivorship bias and smoothing.
All of the economic data discussed in this article are available for free. Here are the websites where you can find the actual reports from their source. Reports are released monthly unless otherwise indicated. The St. Louis Federal Reserve Board maintains a calendar of economic report releases at https://fred.stlouisfed.org/releases/calendar.
A key focus for investors is GDP, released quarterly, which measures the absolute level of goods and services produced in the country. An increase is welcomed by equity investors, while fixed-income investors often respond favorably to a decrease, as it may augur lower inflation. Indeed, it is not unusual for the bond and equity markets to respond differently to the release of a given indicator.
In recent years, approximately 70% of U.S. GDP relates to personal consumption. About 10% of that is represented by purchases of durable goods (those that have an expected life of three years or more), 30% is represented by nondurables and about 60% by services such as housing, medical expenses, education and recreation. Since consumers account for such a large component of GDP, investors monitor consumer optimism by watching the Conference Board’s consumer confidence index and the University of Michigan’s consumer sentiment survey.
Retail sales reports offer insight into consumer spending on goods, although not on services. One widely watched report is retail sales less autos. While there are several measures of retail sales, the one excluding autos is probably the most popular, since car sales can be volatile depending on manufacturer and other incentives.
A disadvantage of the retail sales survey is that it is subject to revision. The “advance” number is published first, followed in subsequent months by an adjusted number. As with all reports, it is how the published number compares to expectations, rather than its absolute level, that tends to drive markets.
Two widely watched measures of inflation are the consumer price index (CPI), which measures the change in the price paid by consumers for a basket of specific goods and services over time, and the producer price index (PPI), which measures prices received by producers. Each has a core measure that excludes volatile food and energy prices.
Both indicators are important, since an uptick in inflation will often be followed by an increase in interest rates.
Corporate executives often assess the state of the economy more accurately than consumers. The ISM’s U.S. manufacturing index is usually closely correlated with U.S. GDP. An index level below 50 indicates a contraction in manufacturing, while a level above 50 reflects increased activity. It’s not a definite sign of a recession, and this index has been below 50 several times since the 2009 recovery. When depressed for multiple months in a row, however, it can signal an economic downturn. Over the last 30 years, job growth declined the following year each time the ISM’s manufacturing index was below 50 for four or more months in a row (as it was between August and December 2019).
The ISM non-manufacturing index is a better predictor. (It covers more of the economy, about 90%.) This index broke below 50 in April 2001, when a recession began, and in 2003 when the U.S. invaded Iraq. It fell below 50 during 2008 and 2009 but has been positive since, other than the coronavirus-related drop in April and May of this year (as I write this in early October 2020).
Both ISM indexes are available on a monthly basis, in advance of the quarterly GDP number, and are used by analysts to provide an early estimate of GDP.
The employment situation report, or the “jobs number,” details unemployment, nonfarm payrolls and average wages. It is often used to anticipate actions by the Federal Reserve. Stocks often sell off on weak jobs numbers. The Federal Reserve strives for full employment and 2% inflation, and it typically adjusts interest rates as it seeks to achieve these goals.
When the Fed has an accommodative policy, stocks may shrug off poor jobs numbers. (While the jobs report is one of the most eagerly anticipated economic releases, the numbers are based on a survey; they are subject to a wide margin of error and may be subsequently revised. For example, if the number of nonfarm jobs added in a given month is 50,000, the 90% confidence interval can be plus/minus 110,000, so the number in reality could range between 60,000 jobs lost and 160,000 jobs added.)
Other information in the report, such as the average number of hours worked, can serve as a leading indicator of future manufacturing activity and employment levels. The ADP Employment Report is published a few days in advance of the employment situation report and is used as a proxy to estimate the level of the latter.
Durable goods orders reflect the willingness of consumers and companies to purchase appliances and machinery, with a decrease often being a harbinger of an imminent economic downturn.
The “headline” number refers to total orders and includes aircraft orders, which are volatile. Observers often look at the “core” number, which is known as nondefense capital goods excluding aircraft. The core number excludes aircraft and defense spending. The core number is a good proxy for business investment and signals when firms are confident about future economic conditions; when it is depressed, future economic growth is less likely.
Although manufacturing is a less important segment of the economy now than in the past, it still accounts for 11% of GDP. Consecutive periods of declining industrial output, as reflected in the industrial production number, presaged the 2000 and 2008 equity market declines.
A related metric, capacity utilization, measures the percentage of productive capacity being used to produce goods and services. It will drop in a recession; when it is high, inflation often follows.
Measures of business inventories also provide insights, although they tend to be lagging indicators. For example, manufacturing and trade inventories and sales indicates if inventories are increasing or decreasing. An increase in inventories can indicate that firms may be overproducing, which can be a bearish indicator. On the other hand, firms tend to increase production when emerging from a recession, in anticipation of future sales, and so can be a bullish signal.
As discussed above, consumers tend to be reluctant to make expensive purchases if they believe the economy is headed for a significant slowdown, so motor vehicle sales can be a useful leading indicator.
However, we should note that demographic and market shifts can reduce or increase the significance of traditional metrics. For example, it appears that younger consumers are more likely to use ridesharing services and are less likely to own a car than their parents. Keeping track of related indicators such as the average age at which individuals apply for a driving license, as well as Uber and Lyft ridership, can shed light on these evolutions.
Pending home sales is another useful barometer, since house purchases reflect the availability of credit and positive consumer sentiment and typically result in significant additional consumer spending as buyers furnish their new homes.
An increase in new home construction, as measured by housing starts, will result in an increase in demand for manufactured goods, as well as boosting demand for transportation services. Construction activity is a key driver for the heavy equipment and trucking industries.
Despite representing only 10% of total sales, new home sales can be a useful leading indicator, since those sales are recorded when a contract is signed, rather than at the sale closing, as with existing homes.
Commodity prices directly affect costs in various sectors. For example, the industrial sector is strongly influenced by the cost of fuel and accounts for 54% of global energy usage.
The EIA petroleum status report shows the supply of, and demand for, oil, and can be used to gauge pressures on oil and energy prices, and their subsequent influence on business profits and the economy.
Similarly, corn futures prices can be used to anticipate farm profits and, consequently, demand for agricultural equipment, while margins for soda and beer companies, for example, can be impacted by aluminum and sugar prices.
As noted, a strong U.S. dollar has negative consequences for U.S. multinationals that sell overseas: If priced in U.S. dollars, their products will appear more expensive to foreign customers, which will result in decreasing sales; if priced in a foreign currency, the proceeds will be reduced when converted into U.S. dollars. Although about half of revenues for companies in the S&P 500 index come from outside the U.S., some firms earn disproportionately more abroad and so are more susceptible to currency swings. Smaller firms tend to be less reliant on foreign revenues than their larger peers, and therefore are less negatively impacted by a rising dollar—although, conversely, they tend to be more adversely affected when interest rates rise.
The Conference Board’s Leading Economic Index provides a composite view of the economy by incorporating factors such as manufacturing hours worked, unemployment claims, building permits, etc.
An inverted yield curve signals that the market is expecting interest rates to drop. It is often a consequence of the Fed’s response to the end of a bull market and the onset of a recession, as we saw in the interview with Campbell Harvey (“Bond Yields’ Role as a Recession Warning Signal,” May 2019 AAII Journal). Bond investors also can be predictors of recessions, with credit spreads on corporate and, notably, high-yield bonds widening out when economic conditions deteriorate.
There are many useful market technical indicators, such as the advance/decline line, a measure of market breadth, reflecting how many stocks are driving the market higher. As investors become pickier, there will be fewer stocks making new highs and more declining, boding poorly for continued stock market appreciation (see the Markets area of AAII.com). Other measures of sentiment—such as the AAII Sentiment Survey—can offer insights to contrarians; at market tops the number of bulls tends to exceed the number of bears. For example, at the peak of the market in March 2000, 66% of respondents were bullish.
Specialized indexes can also be employed in an effort to predict the future. For example, the National Association of Home Builders/Wells Fargo housing market index peaked in 1999, and again in 2005, perhaps anticipating the subsequent market crashes. Similarly, the S&P Homebuilders Select Industry Index peaked in July 2005, before declining in advance of the collapse in home prices and the subsequent subprime-driven credit crisis.
There are a wide variety of additional indicators to explore, and you will find that many have particular relevance to an individual sector. For example, hotel occupancy rates are relevant to the hospitality sector, railroad freight and waste indexes offer insights into industrial manufacturing and container traffic offers insights into imports and exports.
The average investor is rightly earnestly advised not to time the market, as it is next to impossible to do so consistently, but should instead invest on a regular basis. However, an investor who pays attention to the state of the economy can profit from adjusting their asset allocation strategy to current circumstances.
Suppose, for example, that new home sales this month were significantly higher than in prior periods. We could draw several conclusions. First, it would suggest that consumers are sanguine about their continued future income. Second, that they prefer to buy rather than rent, perhaps because they are bullish about housing prices. Third, and perhaps most significantly, we could anticipate increased future economic activity. When someone moves into a new home, they need to furnish it. We could reasonably infer, therefore, that over the next several months they will purchase beds and bedding, kitchen utensils, household appliances and all the sundry accoutrements and furnishings common in a home. Such a jump in new home sales might bode well, therefore, for consumer stocks.
Consider companies that make consumer products. Some products consumers will buy repeatedly and regularly, irrespective of the state of the economy, such as toothpaste, food and alcohol; consumers will continue to purchase them even if they fear they may lose their jobs. Firms that make these products fall into the consumer staples sector.
Consumers tend to be more cautious, on the other hand, when purchasing other types of products, including durable goods (those expected to last three or more years) like home appliances and autos, and luxury goods. If sanguine about their job prospects they may make the purchase, but if not then they may defer the purchase. Firms that make these products fall into the consumer discretionary sector.
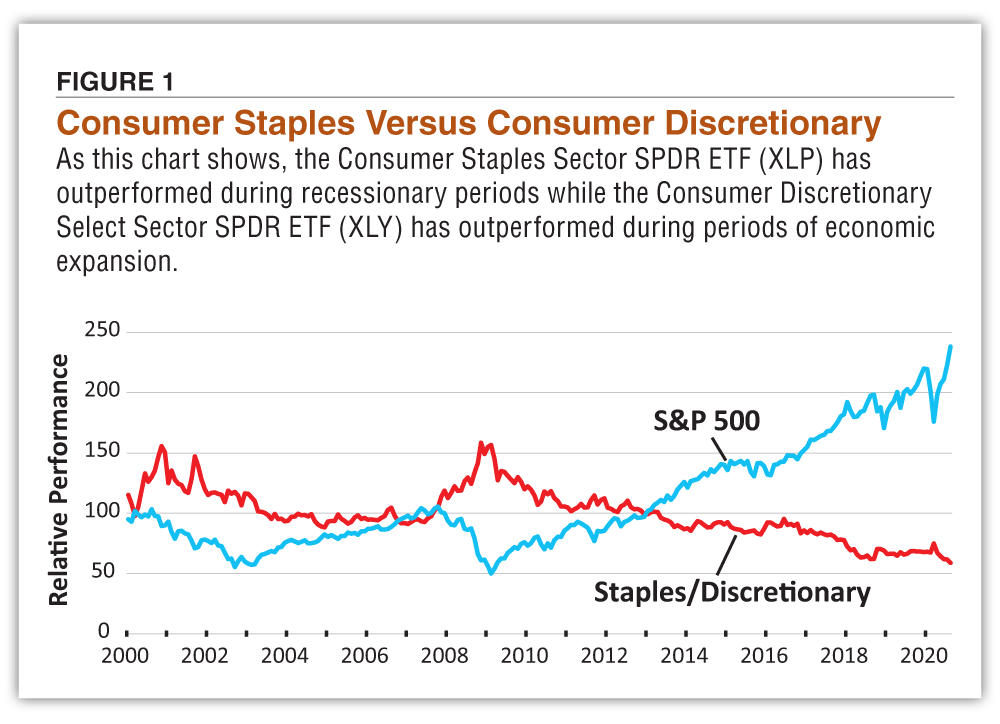
Not surprisingly, the profits of consumer discretionary firms are often cyclical, tending to ebb and flow with the economy—peaking in expansionary periods and collapsing in recessions—and their stock prices tend to move in a related fashion. In contrast, the modest performance of consumer staples firms during expansions pales in comparison, but their steady performance is attractive in recessions.
Figure 1 shows the performance of the Consumer Staples Select Sector SPDR ETF  (XLP) relative to the Consumer Discretionary Select Sector SPDR ETF (XLY) over the last two decades; note the outperformance of staples during the collapse of the dot-com bubble in 2000 to 2003 and during the subprime crisis in 2007 to 2009.
If an investor who overlays a tactical approach to their allocation strategy expects that a recession is imminent, it might make sense for them to tilt their portfolio toward consumer staples stocks and companies in other sectors such as utilities, health care and communications services that also tend to be somewhat insensitive to the broader economy. Collectively, these sectors are referred to as defensive. One can infer from a rally in these sectors that market participants anticipate an economic slowdown.
Conversely, if such an investor expects the economy to begin or continue to expand, then they might wish to remain in or move to discretionary stocks. This would include firms in the industrial, financial and other cyclical sectors, so called because these sectors’ fortunes are tied to the ebbs and flows of the economic cycle. ?
Stock Strategies

Editor's Note


STEVEN L from WA posted over 5 years ago:
R B from OH posted over 5 years ago:
Patricia C from TN posted over 5 years ago:
BRIAN H from NY posted over 5 years ago:
EDWARD K from NC posted over 5 years ago:
You need to log in as a registered AAII user before commenting.
Log InCreate an account