


Related

PRISM Wealth-Building Process
There are about five to six factors that academics generally agree can explain most of the cross section of stock returns.
by Jack Vogel | August 2021

Jack Vogel is co-CIO, CFO and a managing member of Alpha Architect, a quantitative asset management and consulting firm. We discussed what factors are designed to do and how individual investors can use factors in their own portfolios.
—Charles Rotblut, CFA
For those AAII members who aren’t fully familiar with what factors are, could you provide an explanation?
Academics try to understand why certain stocks may do better and others may do worse. They came up with what we call factors to try to describe the cross section of these returns.
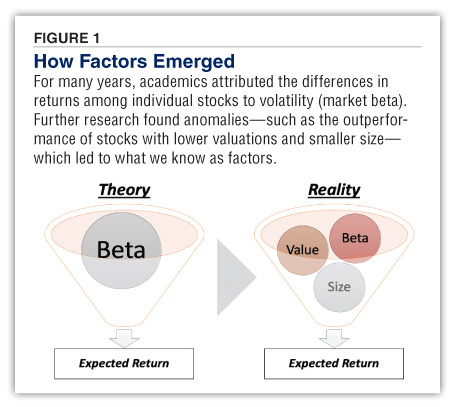
So, let me start with the most basic factor that probably all of your members are aware of, which is the market or the beta factor. Originally academics thought that the majority of returns for stocks should be described and explained by market beta (measure of a stock’s risk relative to the market). When only one factor was used to describe all stock returns, academics noticed that there were anomalies.
In 1993, Eugene Fama and Kenneth French noticed that there were two specific additional factors at play: value and size.
The value factor is created by looking at the return of cheap stocks minus the return of expensive stocks using book to market (book value divided by market capitalization). Similarly, Fama and French looked at the returns of the size factor, which is the return differential of small-cap stocks minus large-cap stocks. What they found was if you take the one-factor model, which is just the market beta, and add two additional factors, the explanatory power of the model goes up to a little bit over 90% (Figure 1).
Since then, academics have added other factors such as momentum, which is that winning stocks do better than losing stocks, and quality, which is that profitable stocks do better than less profitable stocks. There are now about five to six factors that academics generally agree can explain most of the cross section of stock returns. What that means again is that when you run a regression, they can explain around 96% or more of stock returns.
A study you referenced (“Replicating Anomalies,” in The Review of Financial Studies) identified 452 observed factors. Could you shed some light on why a lot of these factors failed, meaning they just weren’t really associated with long-term outperformance?
There are two things about that paper that are kind of interesting. The first is the impact that small-cap stocks can have in a study. Some of the original studies included all stocks, but as author Lou Zhang and his colleagues highlight in their paper, 60% of the observations are small- or micro-cap stocks. These stocks only represent 3% of the stock market’s total capitalization. So, he adjusts for that.
The second thing is Zhang finds that a lot of factors kind of fail out of the sample. The main factors do work, such as value, momentum and quality. But he also finds that many types of factors don’t work. Among them are trading anomaly factors.
A simplistic example was a paper talking about customer supplier relationships. At some past point, Callaway Golf Co. (ELY) had an earnings call and talked about how demand was down. So, Callaway’s stock price dropped, but the stock of a supplier to Callaway didn’t drop. We call these types of events trading friction or arbitrage factors because one would expect both stocks to fall and they didn’t.
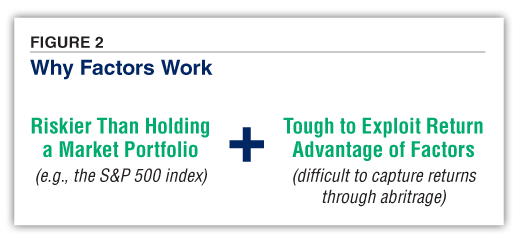
In contrast, it’s really hard to arbitrage the long-term factors like value. If you tried to arbitrage value investing the past five years, you would have been long value (e.g., owning value stocks) and short growth (e.g., short-selling growth stocks), which meant you would have lost a lot of money as value underperformed the large growth stocks. The specific factors that academics still believe in we think are expected to work long term, but part of it is that they can’t work all the time (Figure 2).
What are the factors that academics think will work over the long term?
The most important obviously is always the market beta. The other factors are size, value, momentum and quality. Those are the five I would stick with.
Regarding quality, there does not seem to be a consensus definition as to what quality is when one looks across the universe of exchange-traded funds (ETFs). Is there any common ground?
Unfortunately not. Some people view quality as operating profitability. How much operating profits does a company have relative to its assets? Some people will measure quality via balance sheet methods—how much cash is there relative to debt? There are a ton of measures one can use to measure quality. Unfortunately, there isn’t a universal acceptance of what that is.
The same thing actually happens with value investing. Fama and French originally used book to market. But there are a lot of firms that would prefer to use an earnings-based metric, like the price-earnings (P/E) ratio. We use enterprise multiples, which are EBIT (earnings before interest and taxes) relative to the total enterprise value (equity and debt).
There are different definitions. It’s important to note that a lot of the quality measures still do capture related ideas with the quality measure that Fama and French use in their new model being operating profitability.
I haven’t seen dividends defined as a factor. Why not?
The main reason why they’re not a factor is due to the fact that not all firms pay dividends. So, for example, if we look at the Russell 3000 index, maybe only a third or half of them—I don’t know the exact number—don’t pay a dividend.
What happens is that if you’re an academic trying to create these things called factors, you need to have dispersion in the measures. If I use price-earnings multiples, every single firm has an E (earnings) and a P (price). So, you’re going to get a dispersion of measure. Same thing with momentum. Momentum is what the stock’s return over the past 12 months was. Every firm has that number.
For dividends, if we wanted to try to use it as a factor, half of the sample is going to have the same value: zero. So that’s the main reason academics don’t use dividends.
Dividends do project information about a company. We know that CEOs are only going to start dividends if they believe they have recurring cash flows that they will be able to pay out of year after year.
We think you’d like this related webinar! Individual Investor Show: Vice Stocks, Money Transfer Apps, Factor Investing
The study you referenced before about replicating anomalies defined micro-cap stocks as being the bottom 20% of all NYSE-listed stocks. Is this a sign that some of these factors seem to work in micro caps, but not so much in larger-cap stocks?
I would say it is true that a lot of factors tend to do better within small caps. But the important thing is they tend to do better in a long/short context. I think sometimes that’s lost a little bit because long/short portfolios in micro caps are really hard to run.
So, for example, if we look simply at value in small caps versus value in large caps, it is true that value from a long/short perspective does better in small caps. But the main reason is because small-cap growth stocks are probably the worst stocks you could ever own, whereas large-cap growth stocks include some pretty good companies.
So, when you look at long/short portfolios, value does better in small relative to large. When you look at long-only—which is how most AAII members likely invest—I would say the long-only performance of value in small versus mid and large is actually somewhat similar.
Then you also have to account for the fact that it is harder to trade smaller-cap stocks. I wouldn’t say you should exclude small-cap stocks from your portfolio but for someone who wants to be a value investor, they can get access to value through both small and mid/large stocks. You don’t have to necessarily just focus on one segment. You can get some free diversification.
One question I get asked a lot whenever discussing factors centers around the long-term nature of the data. French, depending on the factor, has data going back many decades in his online data library. How do investors know that these trends are still relevant today?
This is what academics have been arguing about and talking about since the mid-1990s. There are two ways to look at it. First, one thing that should not be overlooked is that Fama and French say the higher returns from value and size as well as our other factors are due to additional risk.
And why does that matter? Because sometimes people say wait a minute, Jack, we were taught that markets are efficient. How are you telling me that there are these things called factors that have extra returns? In a perfectly efficient market, shouldn’t there just be one factor, the market?
The answer is no, because what Fama and French showed is that value stocks move together, and smaller stocks move together. So, what they would say is there basically must be some unknown risk factor inherent in these types of stocks. Even from an efficient market standpoint, you can say that value stocks would work in the future if they’re riskier.
In theory, if markets are efficient and you happen to find stocks that are riskier than just buying the overall market, you should be compensated for your risk. If you believe that a factor is due to risk, you should expect it to continue to work in the future.
Alternatively, some in the academic community believe factors exist due to behavioral biases. If it’s due to behavioral biases, you have to identify what the bias is. So, for value investing, it’s generally what’s called overreaction to long-term trends.
A 1997 study by Patricia Dechow and Richard Sloan (“Returns to Contrarian Investments: Tests of the Naive Expectations Hypothesis”), found that growth stocks had the highest prior earnings growth rates and value stocks had the worst. But then in the future, both revert toward the average. Growth stocks don’t perform as good as they did in the past because competitors see an opportunity to take profits away. With value investing, whoever survives is going to see their earnings improve.
So, behavioral finance people would say value is driven by overreaction. Why would it not work in the future? It will not work in the future if you believe that it could be what’s called arbitraged away. And arbitraged away means that essentially someone’s going to put on a trade with enough capital to make the premium disappear.
For value investing, that would have been a very difficult arbitrage position to put on. During the past five years, I think growth beat value by 70% or more. So, if you were long value and short growth, you would have been down 70%. This is not something that you can easily arbitrage away.
This is why we think certain factors such as value and momentum will survive over the long run. Plus, the fact that value and momentum work in different countries, in different time periods, in different asset classes, gives us a little more hope that it will work in the future as well.
It also gets into the aspect of career risk for portfolio managers who cannot stick to a factor that’s underperforming for too long.
Yes. One of the interesting things about factor investing is, in general, depending on which type of factor you use, it will underperform. That’s why for a lot of investors who decide to use factors, they have to be aware of that going in.
You can minimize your tracking error risk by using different factors. [Editor’s note: Tracking error incurs returns different than those of a benchmark, such as the market.] During the past five years, value has underperformed, but momentum has done well. So, if you had momentum and value, you would have offset some of your risk by minimizing the extent of underperformance.
That leads to my next question. On the Alpha Architect blog, you wrote about combining the value and momentum factors in a portfolio (“Value and Momentum Investing: Combine or Separate?”). It seemed like combining two separate portfolios, one value and one momentum, worked better than trying to find stocks with good value and favorable momentum characteristics. Is that a fair assessment?
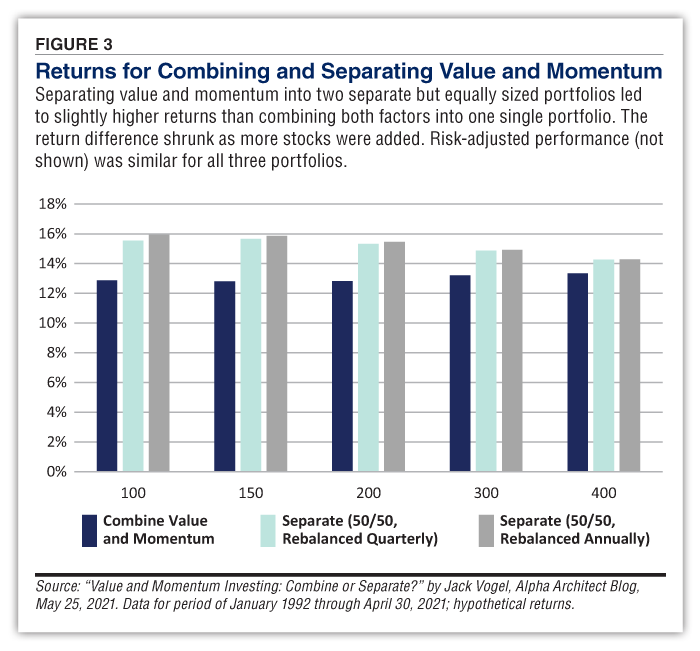
Yes, that’s true from a compound annualized growth rate (CAGR) perspective. On a risk-adjusted basis, they were similar. In general, I think over the long term, combining factors or separating them in two separate portfolios will lead to similar returns.
One of the things that we like about separating the factors is that you more easily understand what’s going on in your portfolio. Is value doing bad or is momentum doing great? It’s easier to understand what is driving returns. Secondarily, if you are an investor who really likes value but just want a little bit of momentum, you can do so by separating the portfolios. So, perhaps you do a 75% weighting in value and a 25% weighting in momentum.
I found, in general, that the returns were slightly higher when the value portfolio was kept separate from momentum than when combining them 50/50 (Figure 3). But I wouldn’t say that combining value and momentum in one screen is bad. It’s just that separating them was slightly better.
An important thing all investors should be aware of is how to go about doing this and what the tax implications are. In my study, specifically, I rebalanced the portfolios every three months.
Value is an interesting factor. If an individual wanted value stocks without using an ETF or a tax-efficient account, they could just rebalance annually. This would create the ability to defer capital gains, whereas with momentum, they would need to rebalance more often.
In terms of allocation, any comments on tilting a portfolio versus fully favoring factors?
The first place you should start is with a market portfolio. You can use an index fund like the ones offered by Vanguard and get the market at a very low cost.
From there, you can tilt your portfolio toward specific factors that you like. I think it’s important to pick factors that you like and that you think are going to work in the future. For example, there are a lot of people who read Benjamin Graham and prefer value investing. So, for them, tilting toward value is probably a better bet than doing value and momentum.
Now, I’ve talked to a lot of people who love the idea of momentum investing. They’re like, “That makes total sense. I’m just trying to buy the winning stocks and I’m going to continuously do this.”
So, I think you should start with the market and then tilt away to the extent you think a factor is going to do well. In doing so, make sure you understand that the more you tilt away from the market, the more your returns are going to differ from the market.
Tracking error is not bad. There are a lot of people, including myself, who are all-in on factors. But for some people, if at the end of the year, the market’s up 10% and they are up 2% because value underperformed, then they probably should just buy the market.
Quantitative Momentum: A Systematic Process to Identify High Momentum Stocks
PRISM Wealth-Building Process

Portfolio Strategies

Value Investing

BARRY J from TX posted over 5 years ago:
You need to log in as a registered AAII user before commenting.
Log InCreate an account