


Related

ETFs and Mutual Funds
ETFs trade at prices either above or below their net asset value due to supply and demand imbalances that are influenced by a variety of factors.

Since the launch of the first exchange-traded fund (ETF) in 1993, investors have benefited from having an investment option with similarities to both stocks and mutual funds. The chief difference between ETFs and mutual funds is how investors buy and sell them: ETF shares trade like shares of stock. They are bought and sold by investors through brokerage account orders and re-traded on exchanges such as the New York Stock Exchange (NYSE) or the Nasdaq. Like stocks, because investors are buying and selling ETF shares with other investors, they receive the price available when the trade is executed.
In contrast, orders to trade mutual funds are executed once a day after the financial markets have closed and the updated net asset value (NAV) has been calculated. NAV is the assets of a fund minus its liabilities. It is listed on a per-share basis. All investors receive the same price for the mutual fund shares purchased or sold (redeemed) on that day. In addition, mutual fund shares are bought from and sold to the mutual fund instead of other investors, as is the case with ETFs. Mutual funds are characterized as open-ended funds, meaning they do not have a limit on the number of shares that can be issued as long as the fund remains open to new investment and/or reinvestment. Mutual funds continuously offer new shares to incoming investors and redeem shares from existing investors.
ETFs differ. When investors buy or sell them on an exchange, the dollars flow to and from another investor instead of the fund. The only investors who transact directly with the ETF’s sponsor are authorized participants (who are often referred to as APs). Authorized participants are large institutional investors, such as trading firms, that purchase or redeem ETF shares from the funds’ providers in large, predefined blocks (typically 50,000 or 100,000 shares). These blocks of shares are called creation and redemption units. During the creation process, the authorized participant delivers a basket of securities held in the ETF’s portfolio, and/or cash, to the ETF provider in exchange for a creation unit of the ETF. These creation units are then broken up and sold on the market to investors as ETF shares. The same process occurs in reverse when authorized participants want to sell or redeem shares: The authorized participants accumulate large blocks of ETF shares and sell (redeem) the creation units to the ETF provider in exchange for a basket of the underlying securities and/or cash.
The price of an ETF can tick up or down throughout the day based on supply and demand. Because of this, imbalances between buy and sell orders can cause the price of the ETF to diverge from its NAV. The NAV is calculated once per day after the markets close for mutual funds, as previously stated, but is frequently updated during the trading day for ETFs. Since ETFs trade separately from the creation and redemption process, it is possible for the ETF to trade at a price different from the value of its underlying portfolio assets. It may also be easier to trade the ETF than the underlying assets that the fund holds.
If an ETF is trading at a price above its NAV, the ETF is trading at a “premium.” Conversely, if the price is below its NAV, the ETF is trading at a “discount.” Why do these differences occur? An ETF’s price return can deviate from its NAV return for several reasons. Within a given day, investors express their sentiments on individual stocks, sectors, investment strategies or even commodities. Investor sentiments can have bullish and bearish implications on an ETF’s price, even though the underlying NAV has not changed or caught up yet. Lower levels of trading volume for an ETF and/or less frequently traded underlying assets can also lead to differences between the market price of an exchange-traded fund and its NAV.
Another plausible reason is that the ETF and its underlying securities trade on exchanges in different time zones. In this case, the NAV may be stale. For example, if an ETF holding Japanese stocks is traded during U.S. market hours, the fund is trading while Japanese equity markets are closed. The ETF price may reflect real-time changes in U.S. investor sentiment for Japanese stocks. When this happens, ETF experts refer to the ETF as being a “price discovery” vehicle. Discounts and premiums of this nature may narrow substantially once both exchanges are simultaneously open.
Fixed-income ETFs can be especially prone to premiums and discounts from their calculated NAV. Bond ETFs trade on exchanges while many fixed-income securities trade off exchanges and/or trade infrequently. This causes an information mismatch because the trade data is not always available to price bond ETF shares like it is for equity ETFs. This situation creates challenges for capturing an accurate daily valuation. That uncertainty is reflected as a premium or discount. The NAV can also be inaccurate. For example, during the 2008 financial crisis, junk bonds effectively stopped trading. Exacerbating this is bond market hours. Bond markets close earlier than the stock exchanges that ETFs are traded on, so the closing price for bond ETFs is set after NAVs for the underlying bonds have been determined.
Accurate NAVs in futures-based specialty ETFs such as those focusing on commodities and currencies are dependent on accurate settlement prices in underlying futures contracts. At times, disruptions in futures markets may cause settlement prices to be unavailable or not representative of daily value. In those cases, futures-based ETFs may trade at a significant premium or discount to quoted NAVs. A commodity ETF based on a diversified commodity index may have an NAV that is based on that index’s current level and not on the ETF’s underlying securities that typically make up the NAV.
So-called plain vanilla U.S. equity ETFs that trade during the same hours as the securities in the portfolio typically trade very closely to their NAVs. This is because both the ETFs and their portfolio holdings trade frequently. These include ETFs that track securities in well-known indexes with widely held constituents such as the S&P 500 index.
Bond ETFs may have structural premiums to NAV because the price used for NAV is based on the bid price, which is the highest going price that someone would pay for the bond when the trade data was captured. The midpoint between the last bid and offer price or the lowest price the seller will accept is used to calculate the ETF’s closing price.
The example previously mentioned about Japanese equities not trading at NAV may in fact be a fair representation of where Japanese equity markets will open in the morning. Most ETF companies provide extensive historical information about their funds’ NAVs, making it easy to see if a premium or discount exists and if it has narrowed or widened over time.
Authorized participants work to eliminate premiums and discounts by buying and selling the ETF and the underlying securities in the ETF. The ability of authorized participants to increase or decrease ETF shares is key to reducing these differences.
To shed light on premiums and discounts, we screened for funds with five-year price returns to limit the universe to only those funds that have been in existence for at least five years. We next calculated the difference between each ETF’s price return and NAV return as of the close on July 31, 2023, for the year-to-date, three-year and five-year periods to determine premiums and discounts.
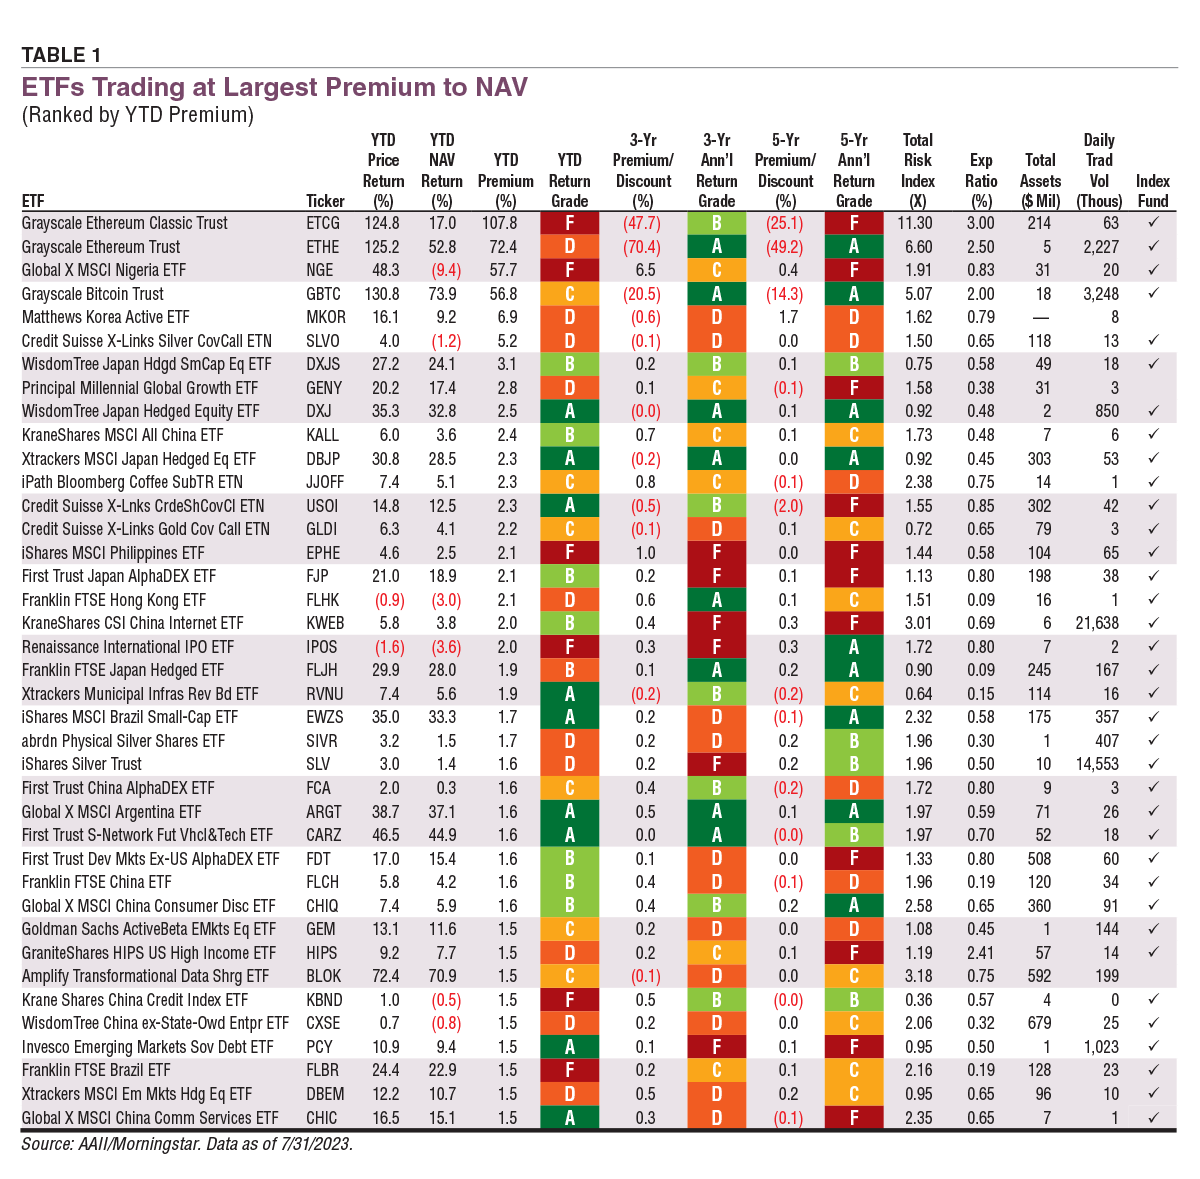
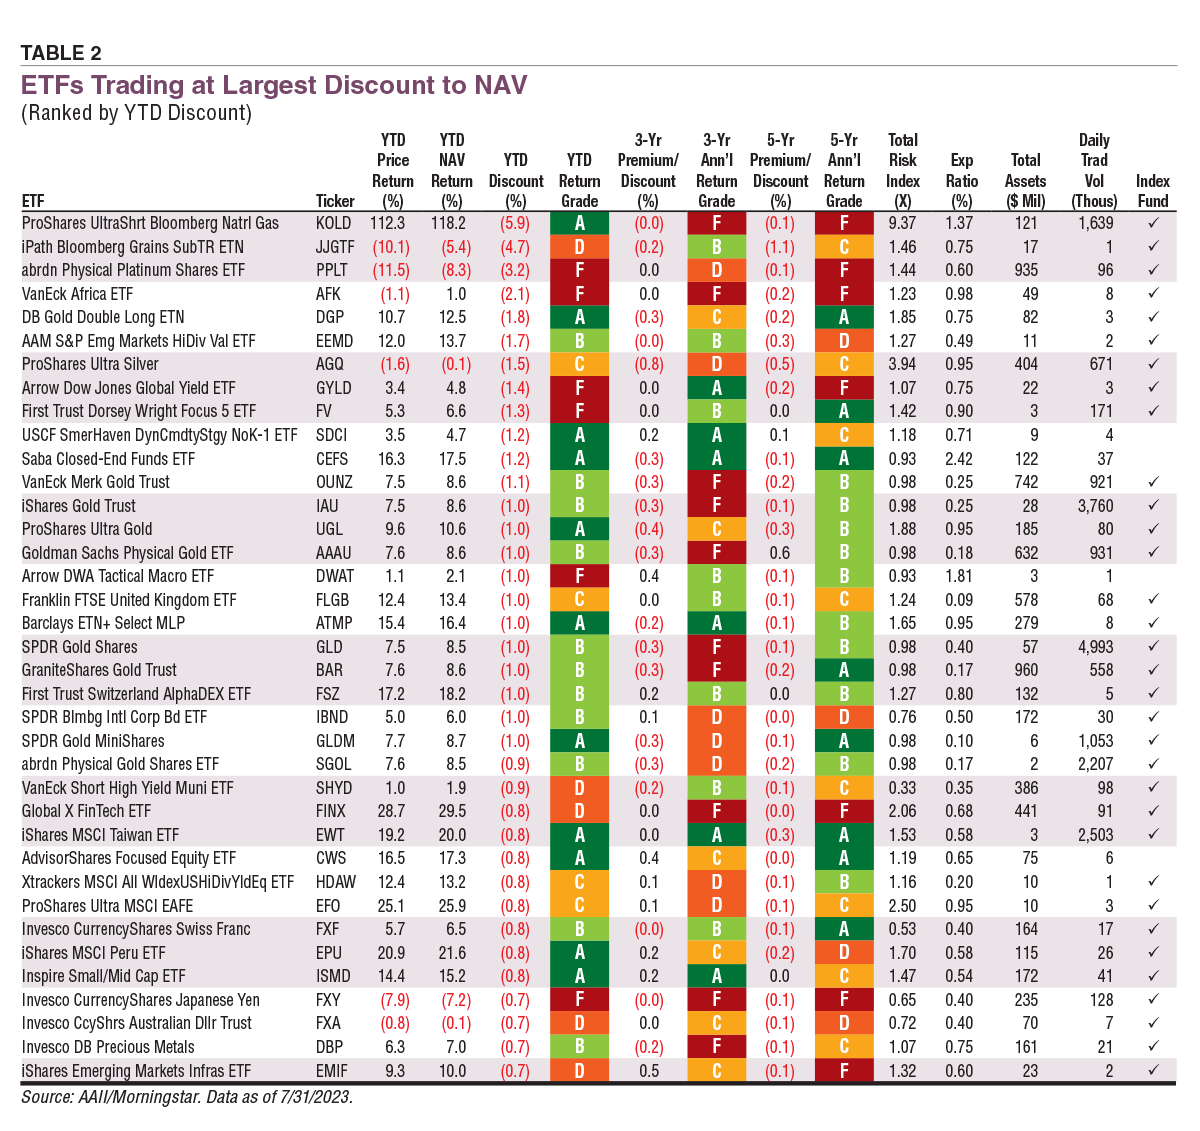
Table 1 shows the ETFs with the largest year-to-date premiums, meaning those whose price returns are greater than their NAV returns by the biggest margins. Table 2 does the opposite. It shows the ETFs with the largest year-to-date discounts. The price returns of these funds have underperformed their NAV returns by the biggest margins.
Download the Excel spreadsheet of Table 1.
We included several additional metrics to help you form a more complete picture. The A+ Investor AAII Grades show how these ETFs performed relative to their category peers for each time frame depicted. The total risk index shows how volatile each ETF has been relative to all ETFs in our database—bond, stock, domestic, international, allocation, commodities and alternative. The average risk index is 1.00. A value below 1.00 indicates lower risk relative to the overall universe. Three years of monthly returns are required to calculate this number. Because premiums and discounts can be influenced by liquidity and trading volume, average daily trading volume is included.
We did not include ETFs or exchange-traded notes (ETNs) whose trading has been halted by the exchanges. For example, a handful of ETFs focused on Russian securities with substantial premiums or discounts had trading of their shares halted or were partially liquidated by their ETF providers.
The Grayscale Ethereum Classic Trust  (ETCG) has the largest premium year to date of 107.8%. This ETF is one of the few ways to gain exposure to cryptocurrency aside from holding cryptocurrency directly or trading futures contracts. This exchange-traded vehicle invests in a trust that holds ethereum instead of directly investing in the cryptocurrency.
Launching ETFs that directly invest in cryptocurrency like bitcoin and ethereum has been on the wish list of many issuers but has been rejected by the U.S. Securities Exchange Commission (SEC) over concerns of volatility and manipulation. A spot bitcoin ETF would be one that directly holds the actual cryptocurrency. Earlier in the summer, BlackRock, followed by other ETF providers, submitted applications to sell U.S. spot bitcoin ETFs. Investors interpreted the BlackRock filing as a signal that the SEC was close to pivoting and dropping its opposition. This in turn led to speculation that exchange-traded trusts like Grayscale Ethereum would be able to convert to spot ETFs. This speculation is potentially a reason for the large premium. Second on Table 1 is Grayscale Ethereum (ETHE), which has a 72.4% year-to-date premium. The Grayscale Bitcoin Trust (GBTC) ranks fourth with a year-to-date premium of 56.8%.
ETNs trade on exchanges like ETFs but are unsecured debt securities. They receive a return based on the benchmark index they track. They are included in Morningstar’s ETF data, so they were included in our screen. The results of sorting by premiums and discounts identified several ETNs with large premiums and discounts. Many have average daily trading volume of less than 1,000 shares, while some have not traded at all recently.
The ETNs included in Tables 1 and 2 have both recently traded and have an average daily trading volume greater than 1,000 shares. (To lend comparison, we typically screen for ETFs that have an average daily trading volume of greater than 5,000 shares.) For example, the iPath GEMS ETN (JEMTF) last traded on February 21, 2023, and had a premium of 59.9%. It focuses on taxable bonds in emerging markets that are denominated in local currencies. Its underlying index is designed to provide exposure to the total return on local currencies in specified emerging markets. Certainly, this is a rare case but a good illustration of how a large premium to NAV can prevail.
An extreme example of an ETF deviating from NAV due to foreign securities trading infrequently is the Global X MSCI Nigeria ETF (NGE). As can be seen in Table 1, it has a year-to-date premium of 57.7%. A more average example is the KraneShares CSI China Internet ETF (KWEB). Its 2.0% year-to-date premium has widened over the past five years. Its average daily trading volume is the highest in Table 1. Most ETFs exhibiting large premiums have global holdings, use leverage or are tied to commodities or currencies.
Like the ETFs with large premiums, many with large discounts in Table 2 target commodities, metals or global holdings. Top of the list is the ProShares UltraShort Bloomberg Natural Gas ETF with the catchy ticker, KOLD. It seeks a return that is two times the opposite of the underlying benchmark for a single day. The fund’s benchmark is an index of natural gas futures contracts and is not intended to track the performance of the spot (market) price of natural gas. This type of ETF is intended to be used as a short-term investment. The inverse multiple and volatile benchmark contribute to the discount from NAV. Holding periods of greater than one day can result in returns that are significantly different than the benchmark for leveraged and inverse ETFs.
Download the Excel spreadsheet of Table 2.
Going back to trusts, VanEck Merk Gold Trust (OUNZ) and the iShares Gold Trust (IAU) have year-to-date discounts of 1.1% and 1.0%, respectively. Each invests in trusts that hold physical gold as opposed to investing in the precious metal itself. These discounts are somewhat smaller than the 1.8% year-to-date discount to NAV for the DB Gold Double Long ETN (DGP). The difference shows how leverage and being an exchange-traded note can lead to a larger relative discount or premium.
The SPDR S&P 500 ETF Trust (SPY) is a widely held and popular equity ETF. Over all periods depicted, its price was in lockstep with its NAV. High average daily trading volume along with both the ETF and the underlying securities trading during the same market hours facilitate this. Equities that are part of the S&P 500 generally have high liquidity. Since it has no premium or discount, SPDR S&P 500 is not included in either table.
Premiums and discounts to net asset value are not unusual for ETFs, but many are small or negligible. More than 1,100 ETFs have differences between their price and NAV of 0.2% or less. Due to differences in price movements between the underlying assets and the creation and redemption process, ETF prices and their NAVs do not always line up.
Over longer periods of time, premiums and discounts tend to shrink or be structural and explainable. Using limit orders to buy or sell ETFs can help with situations where ETFs are experiencing temporary volatility, or the ETF’s underlying assets are infrequently traded. This is especially important when buying or selling ETFs that have long-term premiums or discounts due to holdings in the fixed-income, international or specialty markets. A limit order can also help with orders placed at the opening or closing of markets, which may have greater price volatility. (We suggest to avoid trading during the first and last half hour of the market day when possible because of the greater volatility.) If you are investing in the types of securities we have outlined as having large premiums or discounts, checking the last trade date and the average daily trading volume should provide further insights into the nature of the discrepancies.
ETFs and Mutual Funds

Investor Professor

Alternative Investments

ROBERT A from NC posted over 3 years ago:
CHARLES R from IL posted over 3 years ago:
SESHADRI N from NJ posted over 2 years ago:
Cynthia M from IL posted over 2 years ago:
You need to log in as a registered AAII user before commenting.
Log InCreate an account