

November Charts of Interest: The S&P 500 Tends to Finish Strong
by Charles Rotblut | November 20, 2025
December is right around the corner, and it has historically been a good month for stocks. This month’s charts of interest looks at the presents the stock market has given investors, before turning toward valuations. We then pivot to the bond market and the heavy borrowing and spending by technology companies. Since Thanksgiving is next week, we talk some turkey (prices) too.
December Has Been Good for Stocks
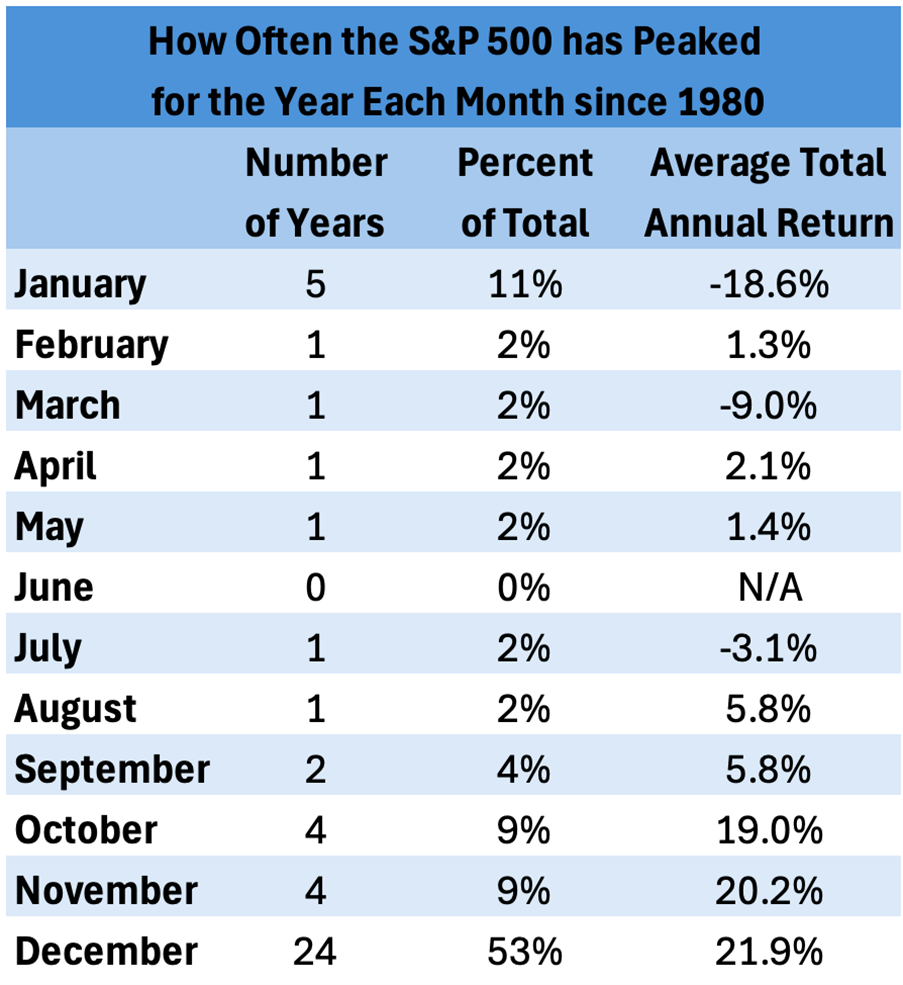
December has done more than bring gifts to the good boys and girls; it has also tended to grow investors’ wealth. According to DataTrek, the S&P 500 index “has peaked for the year in December over half the time back to 1980 (53%, 24 out of 45 years). The average annual return during the years when the S&P 500 peaked in December was 21.9%.”
The last month of the year has historically been among the better months in terms of average returns and frequency of advances. Still, there is no guarantee of whether returns will be positive or negative next month.
What I can tell you with certainty is that the S&P 500 would need a big year-end run to hit that 21.9% mark. As of yesterday, the index’s year-to-date return was a still-good 12.9%.
Source: DataTrek.
Foreign Stocks Are Cheap, Especially Foreign Value Stocks
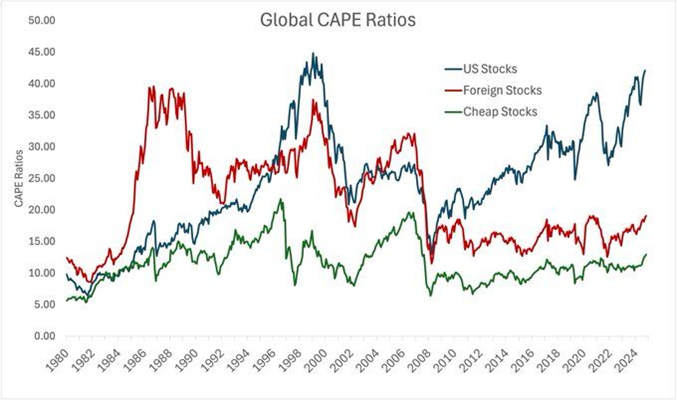
The valuation spread between U.S. stocks and foreign stocks remains very wide. Investors who like deep value may want to look at foreign value stocks, which trade at an even bigger discount. Cambria Investments’ Meb Faber recently posted that these stocks, designated by the green line in the chart below, are trading at a cyclically adjusted price-earnings (CAPE) ratio of just 13.
Source: Meb Faber.
The Yield Spread Is Historically Low
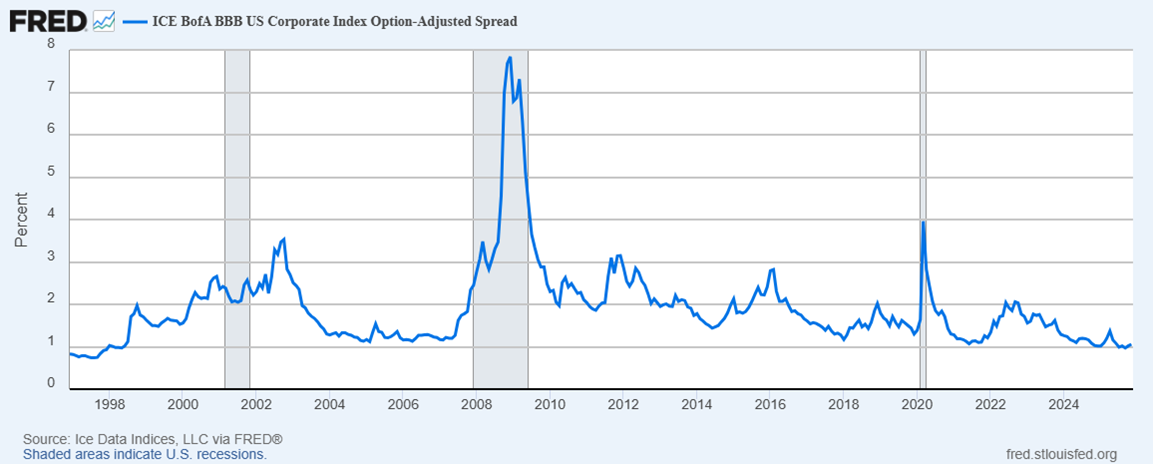
The spread (difference) between the higher yields paid on investment-grade corporate bonds and U.S. government bonds was just 1.06 percentage points on Monday. This is among the tightest spreads seen since the late 1990s. According to The Wall Street Journal, demand from insurers for corporate debt is among the factors playing a role.
The Tech Giants Have Become Big Borrowers
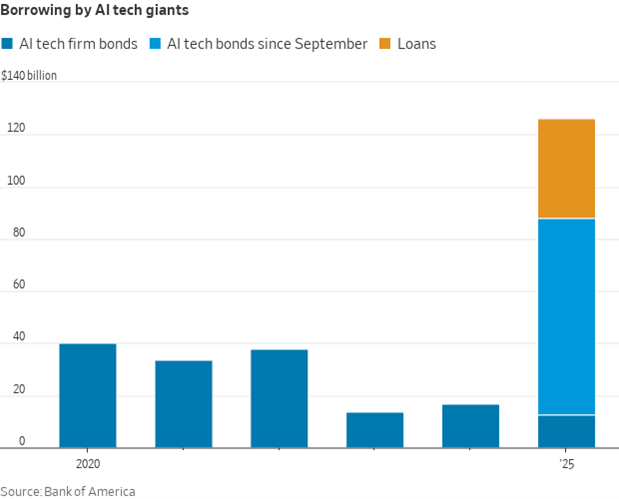
Artificial intelligence (AI) does not come cheap, and the largest technology companies have been turning to the bond markets to help finance it. The Wall Street Journal’s Jason Zweig noted in his Intelligent Investor column that “between September 1 and November 13—less than three months—big tech companies issued more bonds than they had in the previous three calendar years combined.”
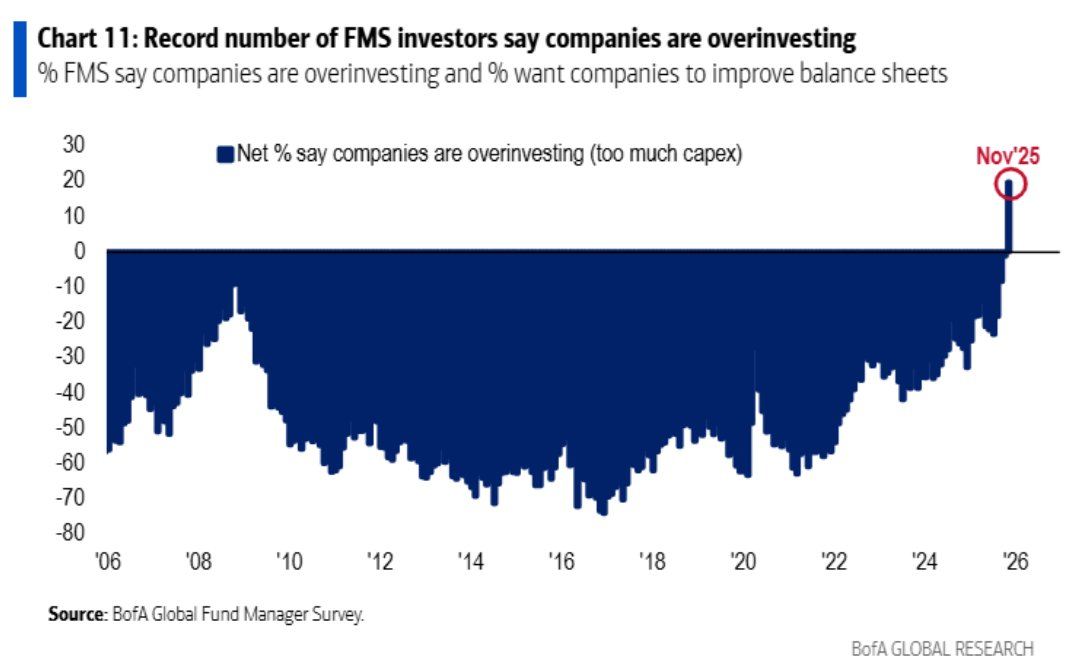
Fund Managers Think Tech Companies Are Overinvesting
This borrowing binge hasn’t gone unnoticed. A recent BofA Global Research chart tweeted by Barchart shows a net positive amount of fund managers saying that technology companies are overinvesting.
“As God Is My Witness, I Thought Turkeys Could Fly”
Turkeys aren’t known for their ability to fly (which made for a very funny episode of “WKRP in Cincinnati”), but their prices have taken flight. “Wholesale turkey prices have surged 75% since October 2024, reaching $1.71 per pound in October 2025,” wrote Caitlinn Hubbell and Elijah Bryant of Purdue University’s College of Agriculture. Avian flu is mainly to blame.
Depending on where you shop, the price increase may not show at the register. This is due to the willingness of some stores to use turkey as a loss leader to attract shoppers.
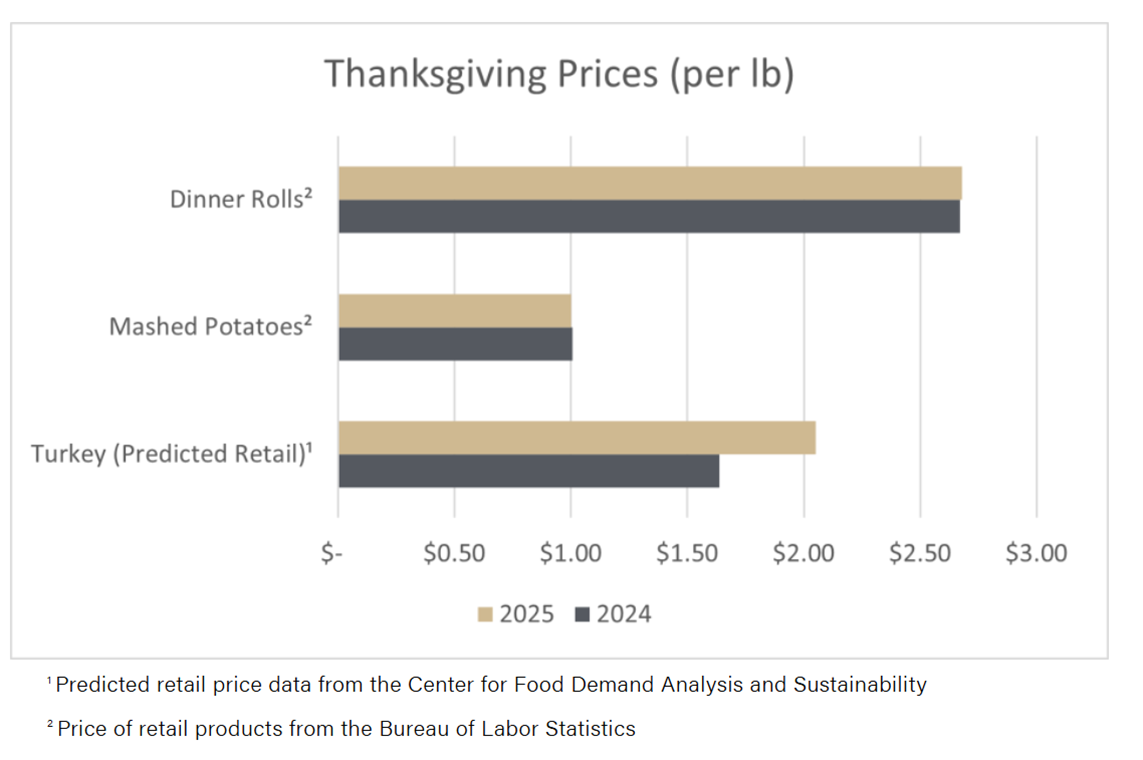
Source: Purdue University, Center for Food Demand Analysis & Sustainability blog, 10/29/2025.

-
Navigating Market Cycles With Shiller’s CAPE Ratio
The CAPE ratio empowers long-term investors to navigate volatile markets, forecast returns and make smarter decisions grounded in historical valuation trends. -
Balance Sheet Basics: Demystifying What a Company Owns & Owes
Studying assets, liabilities and equity can give individual investors an advantage in judging whether a company might be a strong or weak portfolio addition. -
Fed Signals That Investors Should Watch and What They Mean
The November 2025 AAII Journal discusses a strategy that incorporate Federal Reserve policy shifts into an investing model rooted in 12 market anomalies.
AAII Sentiment Survey
Pessimism among individual investors about the short-term outlook for stocks decreased in the latest AAII Sentiment Survey. Meanwhile, optimism and neutral sentiment increased.
Bullish sentiment, expectations that stock prices will rise over the next six months, increased 1.0 percentage points to 32.6%. Bullish sentiment is below its historical average of 37.5% for the fourth time in six weeks.
Neutral sentiment, expectations that stock prices will stay essentially unchanged over the next six months, increased 4.6 percentage points to 23.9%. Neutral sentiment is below its historical average of 31.5% for the 70th time in 72 weeks.
Bearish sentiment, expectations that stock prices will fall over the next six months, decreased 5.6 percentage points to 43.6%. Bearish sentiment is unusually high and is above its historical average of 31.0% for the 51st time in 53 weeks.
The bull-bear spread (bullish minus bearish sentiment) increased 6.5 percentage points to –11.0%. The bull-bear spread is below its historical average of 6.5% for the 38th time in 42 weeks.
This week’s special question asked AAII members how they view the current level of market concentration in mega-cap technology stocks.
Here is how they responded:
- It’s a major risk that concerns me: 37.5%
- It’s somewhat concerning, but manageable: 33.2%
- It’s a natural result of strong business fundamentals: 13.6%
- It creates good opportunities in other sectors: 13.2%
- Not sure/no opinion: 2.1%
Bullish: 32.6%, up 1.0 points
Neutral: 23.9%, up 4.6 points
Bearish: 43.6%, down 5.6 points
Bullish: 37.5%
Neutral: 31.5%
Bearish: 31.0%
See more Sentiment Survey results.

November 13, 2025 I Rebalanced for the First Time Since 2021
November 6, 2025 Single-Stock ETFs Underperform the Stocks They Track
October 30, 2025 Shut Up, Brain: Why Investing Is a Marathon, Not a Sprint
October 23, 2025 October Charts of Interest: Happy Birthday, Bull Market!

Discussion
Barry from TX posted 10 months ago:
Charles, thanks for this panoramic perspective on prices. (1) Dec market prices expected UP 53% x 21.9% = “expected ROI” = 11.6% vs. 12.9 avg LT base rate. (2) Tech prices UP “over the moon” ... and may be stranded like Apollo 13. (3) Turkey prices are LOW (because they can’t fly or flee … like the B&H crowd?) (4) Ex-US stock prices LOW @ 13 CAPE vs US. (EU “turkeys” are cheap too ... for the same reasons?) (5) UST yield spreads LOW vs HY corp bonds … fixed income investors can’t fly or flee either?) (5) Our friend Jason Zweig points out that cash-heavy big techs are financing – fattening up -- their turkeys for their 2026 reckoning. (6) Zweig also pointed out that "Big tech companies are expected to spend nearly $3T on AI through 2028 but only generate enough cash to cover half that tab." I guess these "fat turkey Techs" will need to either (a) UP revenues 100%, (b) borrow 100% more, or (c) fold their hands. (7) Turkeys that “can’t fly” and techs that “don’t fly” face similar fates by Thanksgiving 2026. (8) Charles, you did not mention a related theme: turkeys might have a better chance to “fly” to Grandma’s house than a Boeing this year. (9) I recommend readers follow the link Charles provided to see the “WKRP Turkey Drop.” Happy, Turkey Day.
Barry from TX posted 10 months ago:
Two interesting factoids I found through Reuters that put the relative dominance of AI-related returns in perspective. (1) Pzena IM says small caps represent just 1.2% of total US market cap, less than its 3.6% HA and close to a 100Y all-time LOW. (2) By contrast, JPMorgan Chase says AI-linked LG TECHs have driven 75% of SPX returns since 11/30/22 through 09/30/25 when OpenAI launched ChatGPT.
Barry from TX posted 10 months ago:
This Saturday, 11/22, I was doing my weekly update for the AAII Sentiment-Market data from AAII, and the sentence below caught my attention. Although some AAIiers don't subscribe to this premium offering, I thought fellow AAIIers would like to see this data and the conclusions. "At 0.748, the Bull/Bear ratio remains deeply bearish-skewed versus the historical median of 1.230, while the neutral camp sits 7.2 percentage points below its 31.1% historical average. This configuration suggests not tentative optimism but rather defensive repositioning—bears retreating to the sidelines rather than bulls advancing with conviction.
Tom from MN posted 10 months ago:
The conclusion that Dec is a relatively strong month is a little misleading from this table at the top. While it is true that Dec is likely to contain the peak of the calendar year, that is mostly (all?) due to the fact that the stock market generally goes up over time. Consequently, if you include twelve months (which Dec does), odds are that the number will be most positive. Conversely, if you only include one month (i.e. Jan), the odds are much lower to have it be the highest close of the year. This can be seen in the table, that the odds of being the peak increase over the year. A better comparison would be whether any given month increased from the previous month. I don't know the answer, but I suspect that Dec might not be the leader in that case.
You need to log in as a registered AAII user before commenting.
Create an account