


Related

Financial Statements
Studying assets, liabilities and equity can give individual investors an advantage in judging whether a company might be a strong or weak portfolio addition.
by Jack Gilleland | July 2024

Overview of balance sheet components: assets, liabilities, equity
Key areas to focus on when analyzing a balance sheet
Importance of balance sheet in assessing company’s financial health and stability
A company’s balance sheet offers a snapshot of its financial health, providing critical insights into its assets, liabilities and equity—essential information for judging how fiscally stable it is.
The balance sheet shows a company’s short- and long-term assets as well as short- and long-term liabilities. Each sheds light on a company’s value and strength. In this article, we show you how to analyze a balance sheet. You learn the various components and what key areas to focus on.
The balance sheet is designed to communicate a company’s accounting-based equity value, aka its book value. Unlike the income statement, which details a firm’s earnings and expenses over a three- or 12-month period, the balance sheet lists all of a company’s assets and liabilities as of a single date (e.g., the end of a fiscal quarter or year). It represents the total impact of the income, expenses and cash flow that come into and leave a firm.
The balance sheet provides information on what a company owns (assets) and owes (liabilities) as well as shareholder ownership interest (equity). A company’s assets must equal a company’s liabilities and equity. The simple mnemonic device ALOE will help you remember the key equation underlying the balance sheet: assets equal liabilities plus owner’s equity. Owner’s equity, stockholder’s equity and shareholder’s equity are interchangeable terms; owner’s equity fits best into the mnemonic.
Assets are items that the company owns and uses to conduct business. Liabilities are what the company owes to others. Shareholder’s equity is essentially what is left over—a company’s “net worth.”
A simple way to understand the balance sheet is to use your own finances as an example. You may have checking accounts, cars, properties and retirement savings. Some of these are short-term in nature, such as cash, and others are longer-term, such as a car, furniture or investments. You may also have liabilities such as a cellphone bill or a mortgage. Like assets, some of these liabilities are short-term (e.g., utility bills) and others are long-term (e.g., the portion of your mortgage not due over the next 12 months). The difference between your assets and liabilities is your net worth. Your net worth is equivalent to a company’s equity.
Assets and liabilities are altered by business transactions. For example, a company may issue debt to expand its business by building a distribution facility. This transaction adds to both the assets (the cash needed to construct the facility and purchase its equipment) and liabilities (the debt needed to be paid back) sections of the balance sheet.
Analyzing the balance sheet can help individual investors determine whether a company might be a strong or weak portfolio addition.
Continuing with Alphabet Inc.  (GOOGL) in this article series, its balance sheet is presented in Figure 1. Different companies will report different line items on their balance sheets. Notes providing details about what is included in the financial statements can be found in the company’s U.S. Securities and Exchange Commission (SEC) filings, particularly the quarterly Form 10-Q and annual Form 10-K. Most companies report their total current assets and liabilities on the balance sheet; these figures are commonly used in ratio analysis.
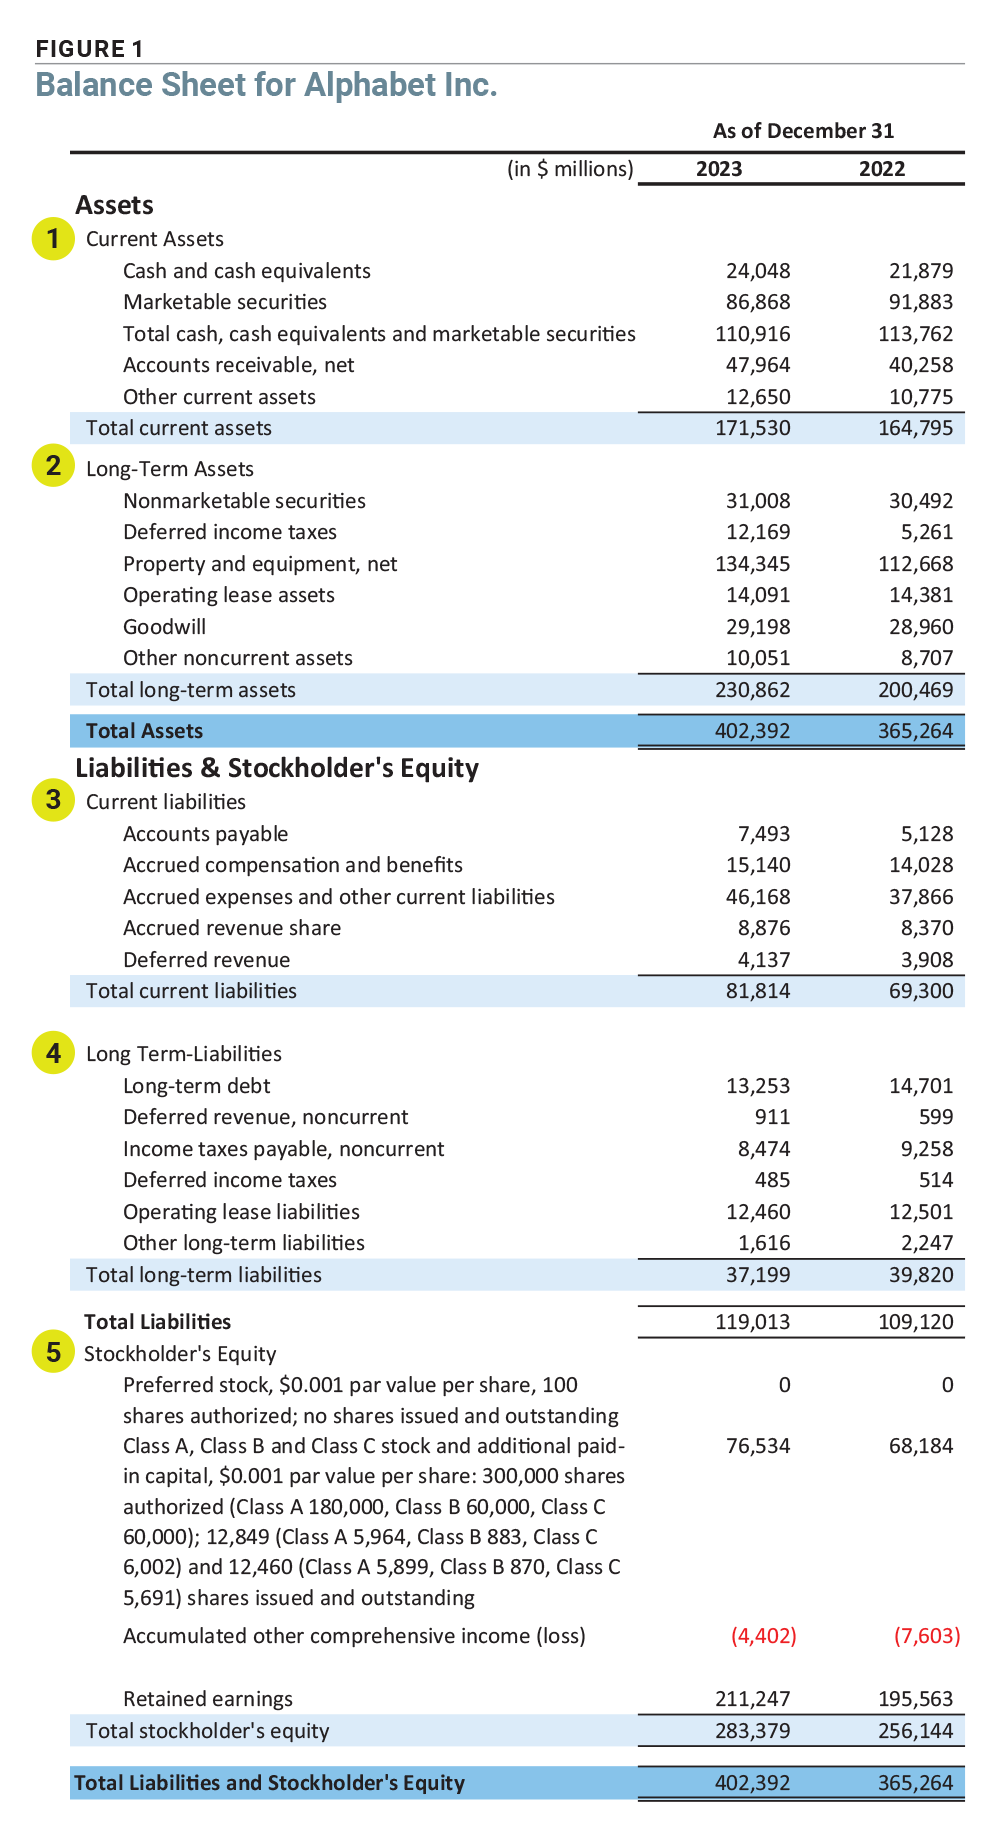
The majority of balance sheets look similar, showing major asset classes such as cash and equivalents and accounts receivable, with liabilities such as accounts payable and deferred (unearned) revenue. The balance sheets of financial institutions, such as banks, are noticeably different, due to their distinctive business nature. Financial institutions may list securities purchased for resale, net loans, deposits and securities sold on their balance sheets.
Assets are resources controlled by a company from which the firm expects aid in generating future benefits. Simply put, these balance sheet items represent what a firm owns. There are two types of assets on the balance sheet: current and long-term assets.
An asset is classified based on the length of time before it is expected to be consumed or converted into cash. The current assets on balance sheets are those with the most liquidity. They are also intended to be used over the next 12 months or during the current business cycle, whichever is longer. Current assets on balance sheets are typically listed in order of liquidity.
Cash and cash equivalents are listed first on most companies’ balance sheets, including Alphabet’s. Cash equivalents are money market funds as well as short-term government bills or high-quality corporate equivalents. Companies will use cash equivalents to earn a higher level of return on excess cash. As of December 31, 2023, Alphabet had total cash equivalents and marketable securities of $110.9 billion.
Cash balances vary depending on the company’s industry. Certain industries, like manufacturing, need more cash on hand than others, such as technology. When analyzing cash, evaluate the proportionate level against competitors and industry norms.
Holding too little cash could be a red flag, potentially impacting a company’s ability to maintain daily operations and pay obligations. Too much cash may be problematic as it can reduce the earnings potential of a firm. The return earned on excess cash may be well below the return the company could earn by investing in projects to expand the business. Plus, the availability of too much cash may spur management to make poor decisions instead of making prudent investments or returning value to shareholders.
Marketable securities often immediately follow in terms of order since they can be quickly converted into cash at stated prices. Marketable securities can include stocks, corporate debt, mortgage-backed and asset-backed securities, as well as options or futures contracts.
Accounts receivable are created when customers’ purchases of products or services are recognized but not paid for. They are amounts owed to the company from its customers. The level of accounts receivable varies not only by industry but also by the mix of customers a company works with.
A relatively low accounts receivable figure may mean that a company is efficient in collecting its payments, that credit standards are strict (which can discourage sales), or that a company operates in a payment-on-demand business (e.g., restaurants). A high accounts receivable figure may mean a company has difficulty collecting payments or that credit standards are too loose.
A better understanding of a firm’s accounts receivable figure can come from analyzing trends over several years, often by looking at accounts receivable as a percentage of sales. A substantially faster increase in accounts receivable relative to the growth rate in overall sales is a potential red flag, signaling that the firm may be relaxing credit standards to boost sales. It can also mean that customers are having problems paying their bills, a troubling sign for future revenues and profits.
Accounts receivable turnover, calculated as net revenue divided by average accounts receivable, is another helpful metric. A declining turnover ratio or one below that of industry peers can signal that a company’s customers are struggling to pay their bills.
Companies may maintain a reserve against potentially uncollectible accounts receivable, titled “allowance for doubtful accounts.” This contra-asset account represents management’s estimate of the dollar amount that will be uncollected because of customer defaults.
Inventory consists of products, parts, raw materials and related materials to be sold to customers either directly or as part of finished goods. Companies that provide services instead of tangible products may not list any inventory.
For firms that realize revenues from the sale of tangible goods, a certain amount of inventory is needed to meet demand and not lose sales opportunities. Companies must be careful not to carry so much inventory that it will be difficult to sell all of it at profitable prices. This balance is especially important in industries with constant product innovation and regular product obsolescence.
For example, Alphabet must weigh the number of Pixel smartphones it has for sale as existing models must be retired on a regular basis to keep up with competitors’ newest smartphones. (Alphabet does not break out its inventory separately on its balance sheet; rather, it is included in other current assets.) Inventories should grow at roughly the same rate as sales over time.
Other current assets can be short-term loans or restricted cash that is not directly applicable to the previously listed line items. If a firm’s inventory and/or prepaid assets are too small to list as separate line items, they will be included in other assets.
Most firms provide a total for current assets on the balance sheet. This amount is useful to compare against total current liabilities. The ratios, at a minimum, should be above 1.0.
Long-term assets on the balance sheet are assets that are not intended for use within 12 months or within the current business cycle.
Long-term investments include equity (stock) in other companies, debt, royalties or non-marketable securities a company intends to hold for a prolonged period. (Alphabet, notably, reports a large amount of nonmarketable securities.)
Plant, property and equipment (PPE) consists of fixed assets that a company acquires to maintain operations. Fixed assets are for long-term use and are not intended to be sold or quickly consumed. They generally consist of buildings, machinery and computers listed at their cost basis. The reported value of a fixed asset is depreciated each year over the estimated useful life of the asset. Depreciation is a noncash expense that appears on the income statement.
Certain fixed assets depreciate faster than others. Alphabet, for instance, depreciates buildings over periods of seven to 25 years and information technology (IT) assets like servers and network equipment generally over a period of six years. The shorter period reflects the quicker obsolescence of IT equipment.
Assets may still hold some value even after they are fully depreciated and are no longer accounted for on the balance sheet. You can find information related to the depreciation schedule of property and equipment in the notes accompanying the financial statements. For example, Alphabet made a change to its useful life assessment for its servers in January 2023. The servers’ reported useful life was extended from four years to six years. The effect of this change created a reduction in depreciation expense of $3.9 billion and an increase in net income of $3.0 billion, or $0.24 per diluted share, for the year ended December 31, 2023.
Companies are required to report operating lease assets, also known as right-of-use assets from operating leases, as an asset on their balance sheet as of 2019. Operating leases are contracts that allow for an asset’s use but do not convey ownership. Imagine that a manufacturing company rents its factories rather than building them. While leasing an asset is often cheaper than buying, the company does not receive any ownership of the asset in the process. While this benefit can be recorded as an asset, the asset side of the balance sheet equation must match the liabilities and equity portion. Operating leases are therefore also recorded on the liability side as operating lease liabilities.
Leases are an important part of the balance sheet because they represent significant financial obligations and assets for a business. Alphabet, for example, recorded operating lease assets of $14.1 billion in 2023. While the 2019 rule change merely altered the presentation of operating leases, the impact on financial statements and financial ratios can be significant for industries and individual companies that rely more heavily on leased assets.
Goodwill is the premium paid above the net asset value (NAV) of an acquired company. It represents the added value of a continuing concern (a company’s capacity to continue operating), prospective increases in market share, brands and other intangibles. Premiums are frequently paid to purchase a company whose trademarks or recipes add value. In the event that a company was able to purchase Alphabet, for instance, its online search engine and Gmail email service would be considered in the price an acquirer is willing to pay. This excess valuation would be recorded as goodwill on the balance sheet of the acquiring company.
Companies may overestimate goodwill. An acquiring firm will often pay a premium for a firm, based on expectations of future synergies and market share gains that may or may not be realized. The Financial Accounting Standards Board (FASB) requires companies to test goodwill for impairment at least annually. If the fair value of the goodwill is less than the reported value, the company must recognize the difference. This means reducing the reported value of goodwill and taking a noncash charge on the income statement. It is common for analysts to subtract intangible assets from shareholder’s equity to calculate a tangible net worth. Alphabet had $29.2 billion of goodwill on December 31, 2023.
Intangible assets are other nonphysical assets like trademarks, copyrights and patents. Intangible assets that expire, such as patents and copyrights, lose value as they get closer to their expiration date and therefore must be amortized. Amortization is a noncash expense.
A company may also own other noncurrent assets on the balance sheet, such as restricted cash, overfunded pension benefits and deferred charges.
Liabilities are the obligations a company must meet. They include invoices due, debt borrowings and the dollar amount of contractual obligations for products and services not yet rendered. There are two types of liabilities on the balance sheet: current liabilities and long-term liabilities. Stockholder’s equity is similar to a company’s “net worth” and is added to liabilities to balance it with assets.
Liabilities with a maturity date less than one year or a business cycle away are reported as current liabilities on the balance sheet.
Accounts payable indicates credit extended by suppliers to the company. (It is the opposite of accounts receivable in current assets, which reflects credit provided by the company to its customers and distributors.) On the balance sheet, accounts payable make up a sizable amount of the current liabilities of most businesses. This is a short-term liability as companies frequently pay their vendors within 30 to 90 days.
Accounts payable should vary at a pace similar to sales over time. Slowing rates of payable turnover—the ratio of credit purchases to average accounts payable—may indicate that the business is having financial difficulties paying its suppliers. Similarly, there should be a link between growth of accounts payable and increases in inventory and cost of goods sold.
Accrued expenses are recorded expenses that have not yet been paid. The most common accrued expenses are rent and salaries; however, some companies such as Alphabet include accrued compensation as a separate line item.
Unearned revenue, or deferred revenue, are proceeds of sales for orders that have yet to be fulfilled or services that have yet to be rendered. Because the money has been received and the firm is liable for the product or service within the next 12 months or before the end of the business cycle, these proceeds are shown as a current liability.
Current portion of long-term debt is the amount of outstanding long-term debt that must be paid back within 12 months. Both stock and bond investors pay attention to this figure since a company must have cash to retire this portion of its total debt or the ability to raise new debt to refinance it.
Alphabet does not break out the current portion of long-term debt on its balance sheet. The notes to the financial statements explain that the company includes its current portion of long-term debt in accrued expenses and other current liabilities, which totaled $46.2 billion as of year-end 2023.
Total current liabilities provide an overall picture of what a company is obligated to pay or fulfill within the next 12 months. Firms must have sufficient liquidity to cover current liabilities coming due, or else they may have to incur more debt to cover the upcoming costs. As with total current assets, this figure is used in liquidity ratios.
Liabilities with maturities of more than one year are classified as long-term liabilities on the balance sheet.
Long-term debt, like bonds, is the most recognizable type of a long-term liability. Like other debt, bonds have recurring interest expense payments.
Other types of long-term liabilities include, but are not limited to, pension commitments and deferred income taxes.
A business that manages its long-term debt well may provide value for its investors. The key is whether the proportionate amount of long-term debt is appropriate and what the debt is being used for. For instance, long-term debt can be useful for financing growth projects. It allows companies to take advantage of tax deductions and avoid diluting the ownership interests of current shareholders.
A big drawback is that a business must repay loans with interest. The larger the amount of debt relative to assets, the higher the risk of financial distress. Furthermore, in the case of a liquidation, bondholders take precedence over stockholders. Since companies requiring a lot of capital issue more debt, comparing debt levels among industry peers makes the most sense.
As we mentioned in the first article in this series in the March 2024 AAII Journal, a company may keep two separate sets of books—one for tax purposes and one to report to shareholders. Firms may account for depreciation aggressively when preparing tax filings to report lower profits and thereby lower the amount of taxes due. On the other hand, firms may use less aggressive depreciation methods when reporting to shareholders, resulting in higher profits and income taxes. The difference in the income tax between the two calculations shows up as deferred income tax under long-term liabilities on the balance sheet.
Total liabilities are the sum of short- and long-term liabilities. This figure should not equal (or worse yet, exceed) total assets, as it would imply that shareholders have no net assets to lay claim to.
Stockholder’s equity is the net assets that shareholders can lay claim to. Also referred to as a company’s net worth, it is the balancing amount after liabilities have been subtracted from assets.
Common stock is what most people own when they buy shares of a company. The reported par value of common stock is often just a penny and is simply an accounting value assigned to shares by a corporation.
Additional paid-in capital is the difference between the price at which companies offer shares for sale and the stated par value. Put another way, it is the capital raised by selling shares.
Retained earnings come from business operations. These are net income less any amounts paid out as dividends or spent on share repurchases. As the name implies, these earnings are “retained” and reinvested back into the business. Alphabet has retained earnings of $211.2 billion as of December 31, 2023.
Book value and shareholder’s equity are frequently used interchangeably. Both are calculated as total assets minus total liabilities. There has been a long history of analysts calculating book value as tangible assets minus total liabilities. This amount is the value that shareholders would theoretically receive if the company were to be liquidated. It differs from market value, which includes the value of a going concern. The stockholder’s equity section, nonetheless, tells you how much underlying value a company has from an accounting standpoint.
The balance sheet shows what a company owns and owes as of a specific date. It also shows how much equity shareholders can lay claim to. Analyzing changes in both assets and liabilities provides insights into whether a company is becoming financially stronger or weaker. Such trend comparisons are also useful when comparing a company against its peers.
For many companies, year-over-year comparisons of financial statements are better than quarter-over-quarter comparisons because of seasonal factors. Quarterly filings may be impacted by the timing of large orders, sales or the start of large projects. The balance sheets of businesses’ with seasonal operations can vary significantly in these cases.
Our next financial statement analysis article on the cash flow statement will appear in the September AAII Journal. All articles in this series can be accessed at AAII.com in the AAII Journal article index.
Financial Statements

Financial Statements

MICHAEL D from CA posted over 2 years ago:
ROBERT A from NC posted over 2 years ago:
BARRY J from TX posted over 2 years ago:
BARRY J from TX posted over 2 years ago:
You need to log in as a registered AAII user before commenting.
Log InCreate an account