



Featured Tickers:
- Learn to interpret trends and assess profitability using income statement elements
- Understand how revenue, expenses and profits break down
- Evaluate company performance and valuation using earnings per share
The income statement is arguably the most scrutinized financial statement. Here you will find the revenues, expenses and profits of a company over a given period.
The phrases “top line” and “bottom line,” which are used in a business context, originate from the income statement. Revenue (aka sales) appears at the very top of the income statement. Net income appears at the bottom of the income statement.
Earnings per share, which are derived from net income, provide an ongoing score of a company’s success or failure. They are frequently used to determine how a company is performing relative to expectations. In addition, earnings per share are also used to assess a company’s valuation. A firm’s worth is often dependent on its ability to earn money and use it to generate future cash flow.
In this article, we look at how to read and analyze an income statement. We cover the major elements found in the income statement and discuss how each can be used in analyzing a stock. The first article in this series, “Beyond the Numbers: Getting Started With Financial Statements,” was published in the March 2024 AAII Journal and can be found at AAII.com.
Income Statement Basics
The income statement displays the financial results for a company over a specified period, typically one quarter or one year. The income statement presents the revenue, or sales, generated during the period, along with the expenses incurred and the profit. The basic equation underlying the income statement is:
Revenue – Expenses = Income
Another easy way to remember the income statement is to think about what is shown: profits and losses. This is why the income statement is sometimes referred to as the profit and loss (P&L) statement.
The income statement starts with revenues followed by the cost of goods sold. The difference between them is the gross profit. Selling, general and administrative (SG&A) expenses and other operating costs are then deducted to reach the operating income. Nonoperating income and expenses, or the income and expenses that are not essential to operations, are then deducted to reach net profit. The income statement is meant to be read from top to bottom, from revenue to net income.
Cash Versus Accrual Accounting
Before the income statement can be analyzed, it is crucial to understand the difference between cash and accrual accounting. Cash accounting recognizes transactions at the time money is exchanged. Accrual accounting allows a company to record transactions when its economic benefits become probable.
Public companies are governed by several organizations and sets of standards. In the U.S., the Financial Accounting Standards Board (FASB) establishes and updates the generally accepted accounting principles (GAAP), the framework for financial reporting. All publicly traded companies in the U.S. must follow the comprehensive set of principles, standards and guidelines set forth by GAAP. By creating a baseline set of “rules” that public companies are to abide by, investors can receive a certain level of consistency, transparency and assurance.
Accrual accounting is a GAAP standard that allows companies to record revenues and expenses when they are earned or incurred, regardless of when the actual cash transactions occur. Put another way, regardless of when money is exchanged, the company’s journal records the income received and the costs expended. One advantage of accrual accounting is that it smooths out revenues and expenses instead of exposing both to the volatility of when payments are received or made. Another advantage is that accrual accounting allows revenues and expenses to be spread over a longer period of time instead of during one quarter or year. This allows for better reporting of transactions that will cover several periods, such as a multiyear contract or project.
Reading the footnotes to the financial statements is also important. Here you will be able to find details that contribute to how the income statement was put together. Revenue recognition principles of the company, for example, can be found in the footnotes accompanying the income statement.
Income Statement Elements
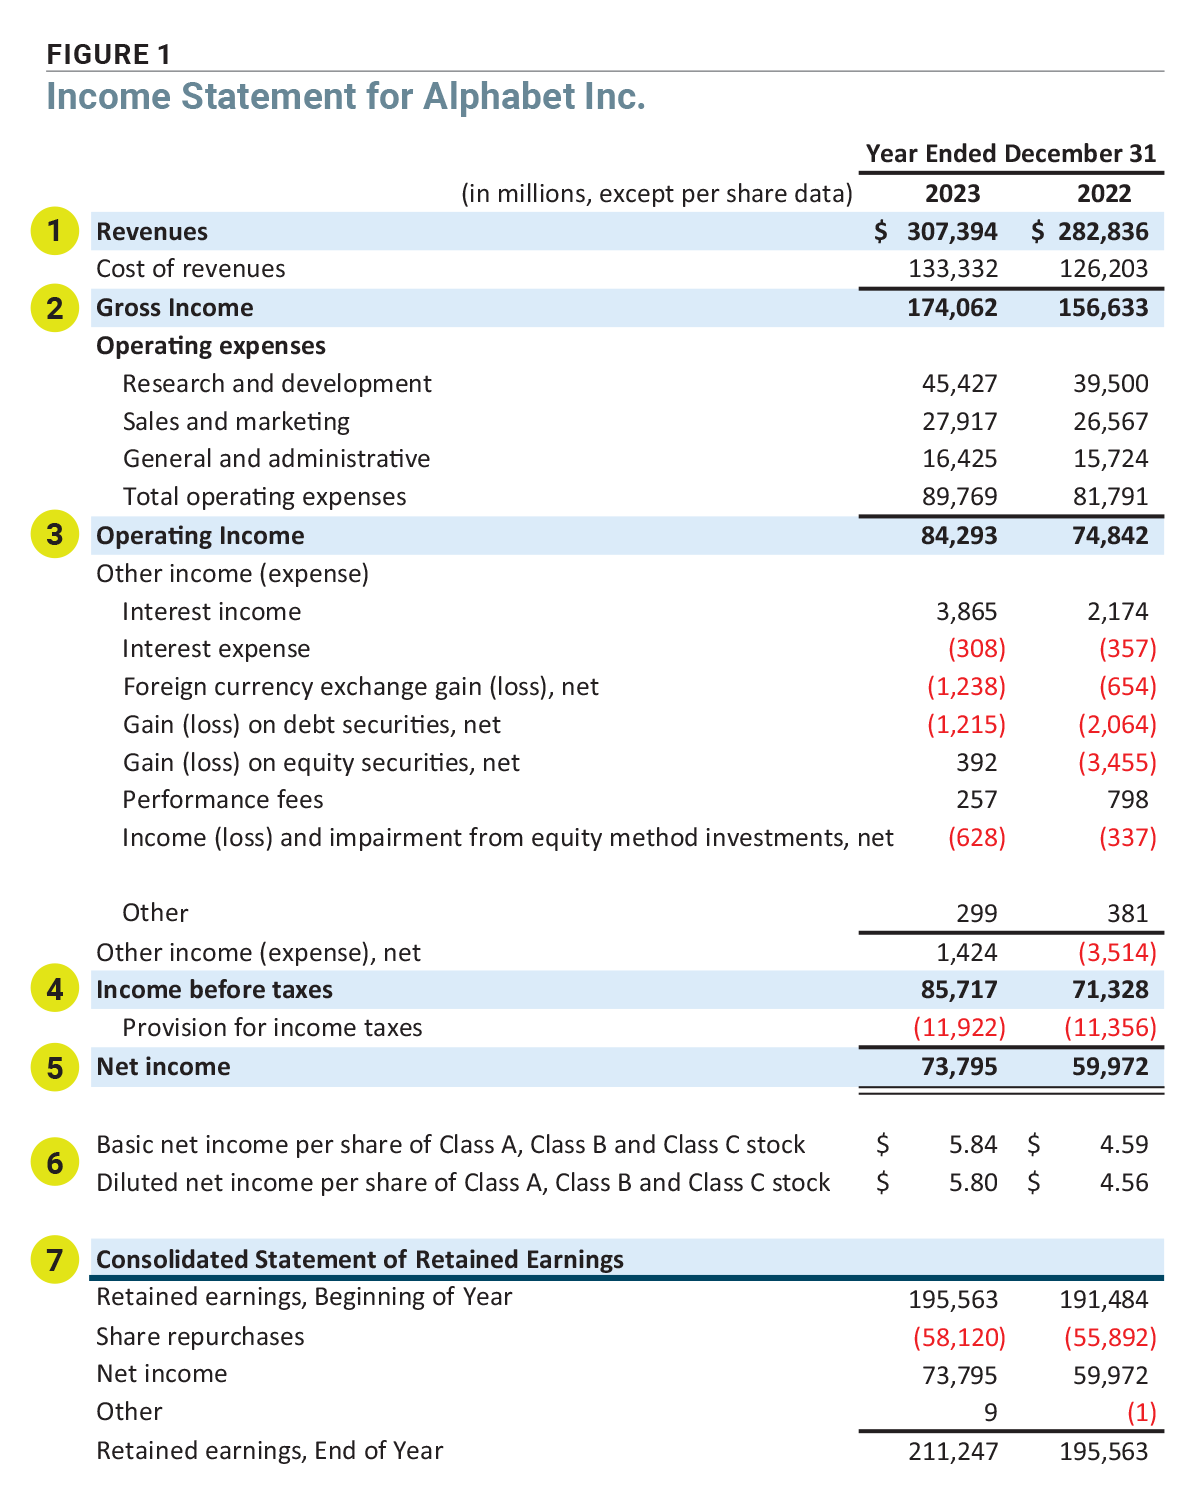
While firms use a variety of income statement formats, the five-step format is useful in breaking down the information found in the statement. Figure 1 displays the income statement for Alphabet Inc.  (GOOGL), divided into five steps: revenues, gross income, operating income, income before taxes and net income. (We added two steps for additional data that can be provided.) While net income as the bottom line is often regarded as the most important element, the entire statement can reveal crucial trends and information. Understanding the steps it took to get to the final number, especially when making comparisons to an industry peer or on a historical basis, can lead to much different conclusions than just the overall net income.
1. Revenues
As explained, revenue appears at the top of the income statement. Revenue is generally recognized and recorded on the income statement when the product has been delivered or the service has been rendered and the seller is reasonably sure that the product will not be returned. Both the risk and the reward of ownership must be transferred from the seller to the buyer for the transaction to be considered final. Companies’ regulatory filings, such as the U.S. Securities and Exchange Commission (SEC) Form 10-K, disclose a company’s revenue recognition policies.
When accrual accounting is used, accounts receivable (listed on the balance sheet) increase when a sale is made and cash is not exchanged, representing the credit that is extended to a customer to purchase goods. This balance sheet item should move in tandem with sales. Accounts receivable increasing at a faster rate than sales could be cause for concern and should be investigated further. This type of trend may be a sign that customers are struggling to pay their bills, or the products are not selling.
Certain revenue may not be recognized for the current reporting period, even if the payment is received in cash. Alphabet is a great example of this, as it engages in contracts, licensing agreements and subscriptions that span long periods. When the company receives a cash payment for a multiyear obligation, it does not recognize the entire sum for the current reporting period since the delivery of the service covers a longer period and expenses related to the sale (e.g., product support) will be incurred in future periods. Alphabet would recognize the revenue associated with the expenses that arise with the current portion of the payment, however. The rest of the revenue is reported in a liability account, titled deferred revenue (unearned revenue is another term used by companies), on the balance sheet.
Deferred revenue or unearned income will also be reported in the footnotes. For example, Alphabet had deferred revenue of $4.1 billion on its balance sheet as of December 31, 2023, meaning the company had received payment but is obliged to provide services and products equivalent to this dollar amount. Alphabet also has a revenue backlog of $74.1 billion listed in its footnotes. Revenue backlog refers to commitments in customer contracts for future services whose economic value has not been recognized as revenue. The key difference between deferred revenue and revenue backlog is that deferred revenues represent dollar amounts that have been received or billed.
2. Gross Income
Gross income is calculated by subtracting the cost of goods sold from revenue and represents the amount of profit a company earns by selling its products or services.
The cost of goods sold—also referred to as cost of sales—is the cost a firm incurs by manufacturing or producing an item, such as material and direct labor costs. The cost can be significant for traditional manufacturers, wholesalers and retailers, so the method used to determine this expense can have a big impact on the bottom line. To calculate cost of goods sold, most companies use either the first-in, first-out (FIFO) or last-in, first-out (LIFO) method for recording the expense of inventory sold, although the average cost method may also be used. Executives do have certain discretion when choosing between accounting assumptions for the cost of goods sold, but any significant change should be disclosed in the supporting footnotes.
Gross income and cost of goods sold are used by analysts to determine trends in production and labor costs. Gross profit margin is gross income divided by revenue and it varies by industry. Gross margin doesn’t appear on the income statement, but it is reported by many data sources along with other profitability ratios. Declining (narrower) gross margins can reflect downward pressure on pricing (because of increased competition or weakening demand), higher raw material and labor costs or a combination of the two. Rising (wider) gross margins can signal that the company has a greater ability to raise prices or that its production costs have decreased. Often, changes in margins are due to a combination of factors.
Alphabet lists its costs of revenues at $133.3 billion for 2023. The footnotes to the financial statements show that the costs are made up of web traffic acquisition costs, content acquisition or licensing, depreciation expense and other costs related to the devices the company sells. Be cognizant of increasing costs, because they will have to be either absorbed by the company, which would hurt profits, or passed on to the consumer, potentially hurting sales. Alphabet’s costs of revenue increased by 5.6% in 2023; however, sales grew 8.7% and gross income widened by 11.1%.
3. Operating Income
Operating income is the income generated by a firm’s regular business operations, before accounting for interest, taxes, nonoperating costs and extraordinary charges. It is arrived at by subtracting total operating expenses from gross income. Total operating expenses are the sum of SG&A expenses, research and development (R&D) expenses and depreciation and amortization expenses.
Generally, the first major expense listed is SG&A expenses, which are overhead costs. These expenses are usually broken down into selling costs (typically marketing and advertising) and general and administrative costs (employee salaries, rent, insurance, electricity, etc.). The difference between cost of goods sold and operating expenses is that the former can be traced back to specific products and services, while operating costs are proportionally allocated to all products.
In some industries, R&D costs may be very high for businesses. Only when a significant amount is spent is it necessary for businesses to disclose R&D costs as a distinct line item. As you can see with Alphabet, $45.4 billion was spent on R&D in 2023, second only to cost of revenues.
Depreciation is used to allocate the cost of capital investments that have long life-spans. This can include, but is not limited to, computers, furniture, machinery and buildings. The goal of depreciation is to spread recognition of the expense over an item’s life-span, as opposed to recording a large, one-time expense when the purchase transaction is first recognized. The choice of depreciation method depends on factors such as the type of asset, its expected pattern of use or obsolescence, financial reporting requirements, tax considerations and management preferences. Different methods can result in varying depreciation expenses and impact financial statements differently. Companies also must disclose depreciation methodologies in the footnotes accompanying the financial statements.
Amortization represents the long-term decline in the value of intangible assets such as patents, copyright protections and other intellectual property. These intangible assets lose value as the rights approach expiration. Both depreciation and amortization are noncash transactions.
Operating income is a crucial line item that reflects organizational productivity before considering how the firm was financed or the contribution of nonbusiness activities. Investors should always closely monitor operating income, as it shows how profitable a company is after all sales and operational costs have been factored in.
Operating margin is another profitability ratio reported by data sources that should be watched. It is calculated by dividing operating income by revenue. It is important to examine a company’s operating margin against those of other firms in the same industry, as certain industries have higher or lower operating margins. Significant shifts and abnormally high or low operating margin should be scrutinized.
EBITDA (pronounced EEE-bit-dah) stands for earnings before interest, taxes, depreciation and amortization and is often used as a proxy for cash flow, or how much cash a company generates. While not a GAAP measure, EBITDA is one of the most widely used valuation tools. Companies can include non-GAAP measures in their financial statements; however, the company must present the most directly comparable GAAP measure with equal or greater prominence. The footnotes, again, are a great resource for understanding what assumptions and calculations were used to create financials.
4. Income Before Taxes
Many companies use debt financing. Interest expense is paid on outstanding long-term loans and is a form of nonoperating expense. The expense is classified as a financing expense, not an operational expense, and is therefore listed under nonoperating expenses for firms in most industries. Alternatively, companies with an abundance of cash may be earning interest. Interest income is also listed in the nonoperating section, with the notable exception of financial companies or companies operating financial divisions.
Nonoperating income or expenses can be listed together or separated out by line item. Other common nonoperating expenses or income can include the gain or loss from the sale of equipment or profits and losses from hedging activities. Alphabet, with its international operations, includes gains and losses on foreign exchange rates.
Adjusting gross income for operating and nonoperating expenses gets you to income before taxes.
5. Net Income
As the last line calculated on the income statement, net income is known as a company’s bottom line. This is the income available to all shareholders after all expenses have been accounted for. The final items to arrive at net income are income taxes and adjustments to income.
Income taxes are paid by companies at the federal and state levels. Income taxes can vary if there is a special situation allowing for a company to pay a lower tax expense or forcing it to pay a higher tax expense. Companies might also be subject to foreign taxes. Effective tax rates are required to be disclosed by the company in the notes supporting the financial statements. Alphabet’s effective tax rate in 2023 was 13.9%.
Companies may also adjust income. These expenses or income are not consistently found from period to period and cannot fall under either operating expenses or nonoperating expenses. Some of the most common adjustments involve an extraordinary gain or loss, a gain or loss on discontinued operations and nonrecurring items and the cumulative effect of change in accounting.
Extraordinary and nonrecurring items are often combined in one line item. These events are unusual and infrequent in nature. The event must be related to the firm’s normal course of business. A gain or loss from discontinued operations is reported when a firm sells a portion of its business or closes down a line of business. Companies may also adopt new accounting policies or fix past accounting mistakes. This can generate a one-time gain or loss that requires an adjustment to income.
Income from subsidiaries and equity in other firms is also listed in this section.
Additional Elements
6. Earnings per Share
Companies also include earnings per share in the income statement, which is computed by simply subtracting any preferred dividend paid from net income and dividing the result by the average number of common shares outstanding. This represents the earnings available per common share. (It’s called basic net income per share on Alphabet’s income statement.)
If a company has convertible bonds or shares, stock options and warrants, diluted earnings per share must also be calculated. Diluted earnings per share represent the earnings available per common share of stock, assuming all convertibles, warrants and options are exercised (called diluted net income per share on Alphabet’s income statement).
7. Statement of Retained Earnings
Companies may also include a short section for retained earnings on their income statement. The statement of retained earnings details the amount of net earnings available to common shareholders that is paid out as dividends or for share repurchases, and the amount that is retained at the firm for future expenditures and expansion.
We’ve added a statement of retained earnings in Figure 1 since Alphabet has significant share repurchases. You can see that Alphabet had $195.6 billion in retained earnings to start 2023 and repurchased $58.1 billion worth of shares during the year. The company had net income of $73.8 billion and a $9 million increase of tax withholding related to vesting of restricted stock units, bringing 2023 year-end retained earnings to $211.2 billion.
How to Use the Income Statement
An income statement’s main objective is to inform stakeholders about the profitability and business operations of the firm; however, it also offers comprehensive insights into the company’s internal operations for cross-industry comparison. An investor can comprehend the factors that contribute to a company’s profitability by examining the revenue and cost components of the statement.
When looking at the income statement, two of the most common analysis styles are vertical and horizontal analysis. Vertical analysis is when you list each item as a percentage of a base within the statement, often revenue. You can observe relative proportions, making it easy to compare financial statements between firms, between industries and across periods. It also aids in the analysis of whether performance measures are getting better (or worse).
With horizontal analysis, a company’s financial statement line items are reviewed and compared across several reporting periods. Although this analysis can be done in percentage terms, it is commonly carried out using absolute comparisons. Horizontal analysis allows you to identify trends and growth patterns, line item by line item, and determine what has been driving an organization’s financial success over time. In the end, horizontal analysis is not used to show the relationships between individual line items but rather to find trends over time for a specific company, such as comparisons between year-end financials.
It is also important to note that growth in earnings per share can be misleading if there have been a number of share buybacks. Earnings per share may look higher simply because there are fewer shares outstanding. Conversely, if a company issues more shares, earnings per share will be reduced. Look at the share count numbers used to calculate earnings per share: Net income should change in the same direction and confirm what the change in earnings per share indicates about the company’s growth rate.
Arguably the most useful information can be found in the notes accompanying a firm’s financial statements. Information not immediately obvious from or not included in the financial statements themselves that is required for a fair portrayal of financial condition and operation results is communicated in the notes to the financial statements.
Uncovering True Earnings Potential
The income statement sheds light on how a company converts sales into net profits. Evaluating the many costs that a company incurs throughout the course of the financial year is crucial. Be sure to notice trends in revenues and expenses. Several years of declining revenues or profits can be a sign that a company is struggling.
Other Articles in This Series
Beyond the Numbers: Getting Started With Financial Statements, March 2024

Related

Investor Professor
Online Exclusive: What Is EBITDA? Calculation and Examples
Related

Financial Statements
Using Accruals to Judge How Persistent Earnings Will Be
Discussion
FREE REPORT

Get your free copy of our special
report analyzing the tech stocks
most likely to outperform the
market.
ROBERT A from NC posted over 2 years ago:
BARRY J from TX posted over 2 years ago:
Keith W from AL posted over 2 years ago:
Dale C from AZ posted over 2 years ago:
You need to log in as a registered AAII user before commenting.
Log InCreate an account