

October Charts of Interest: Happy Birthday, Bull Market!
by Charles Rotblut | October 23, 2025
Featured Tickers: IVV
IWN
IVV
IWN
Last week, the current bull market turned three years old. In this month’s charts of interest, I show you how the market’s current rally compares to past bull markets and share a few reasons to remain allocated to stocks. I then look at a few market trends that are occurring below the surface, before ending with a preview of the holiday shopping season. Yes, that time of year is coming.
The Bull Market Is Above Average
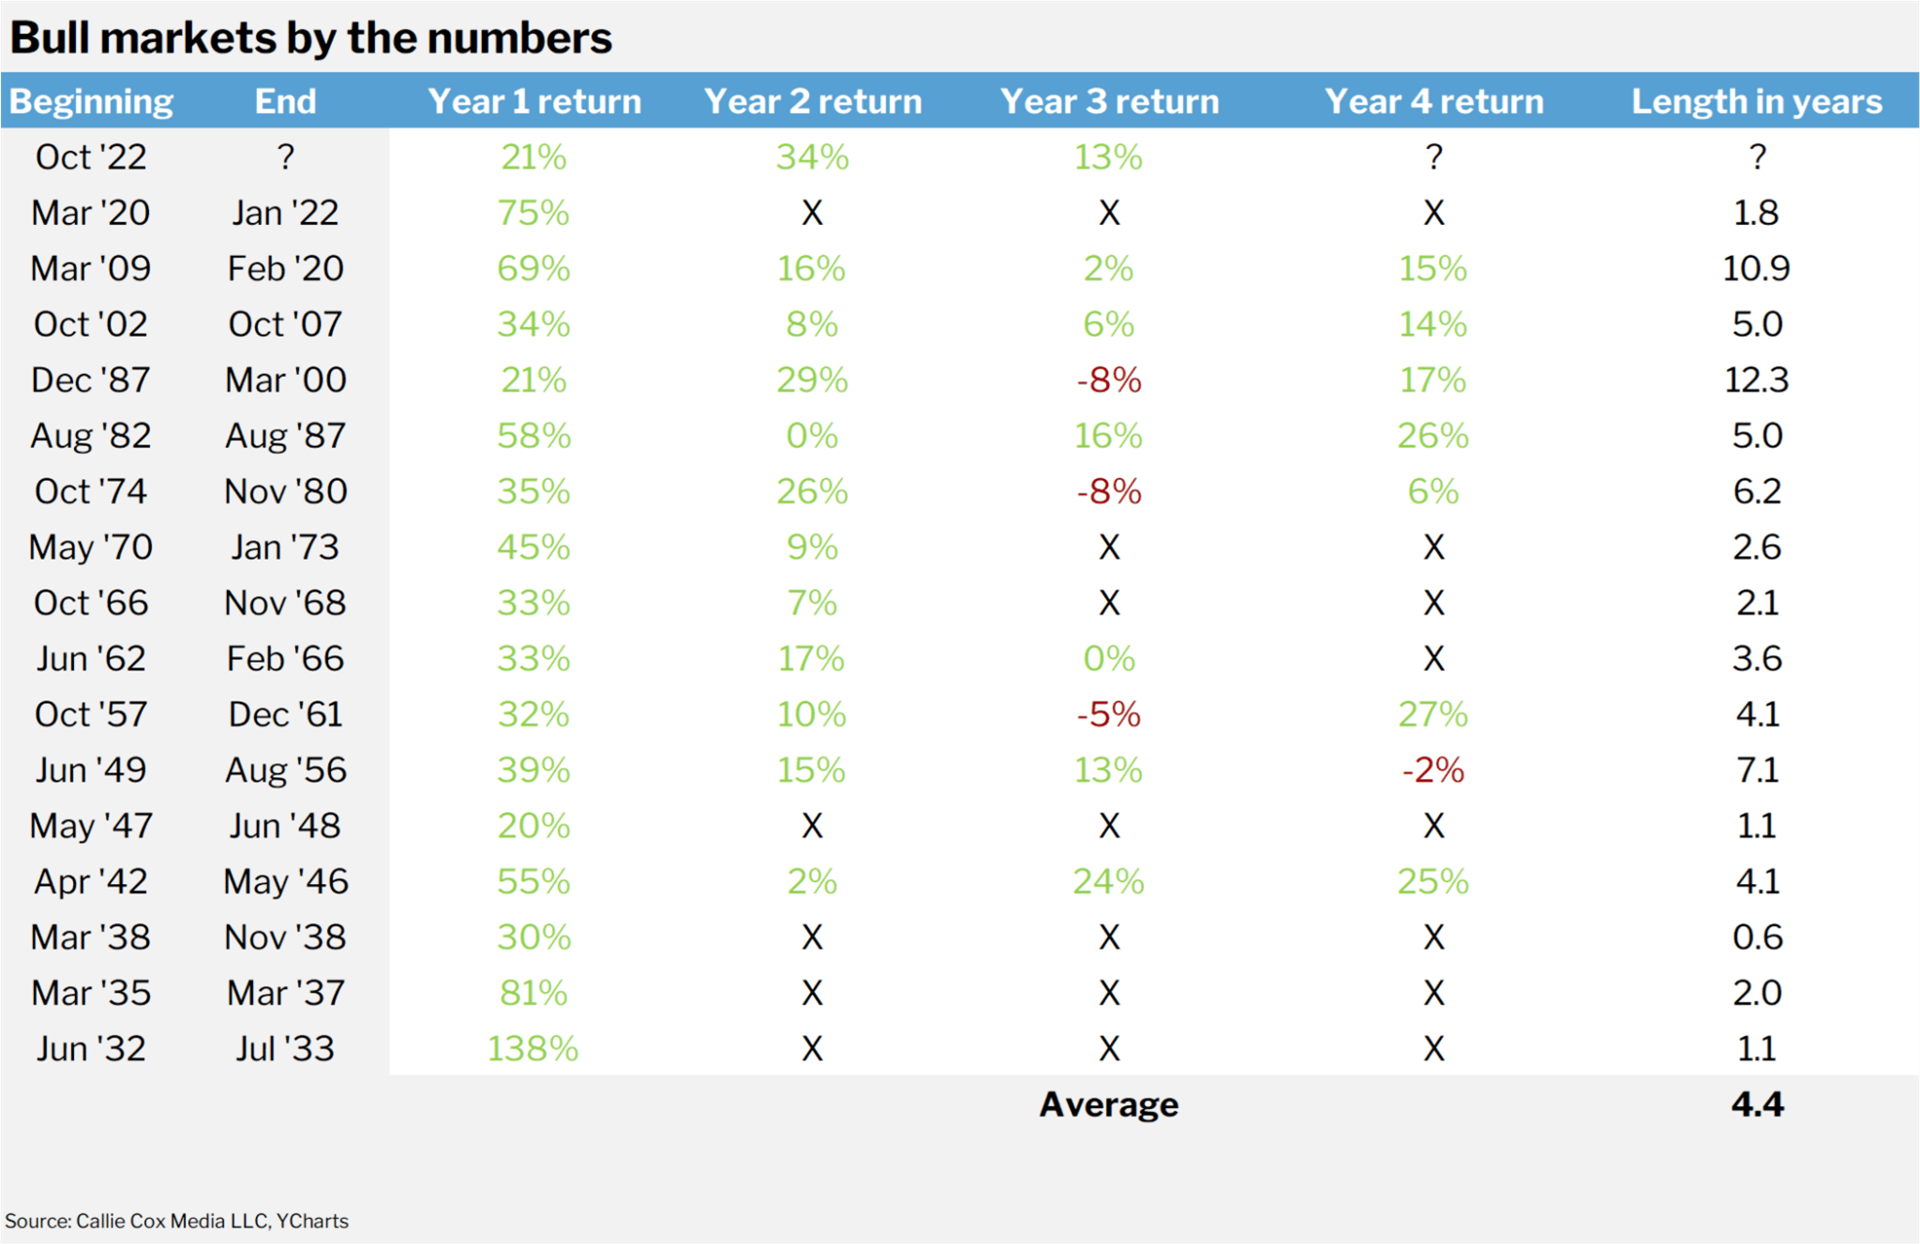
The S&P 500 index’s 87% gain since October 2022 is above average relative to all bull markets since 1970. However, it is hardly top tier, as this chart from Callie Cox shows.
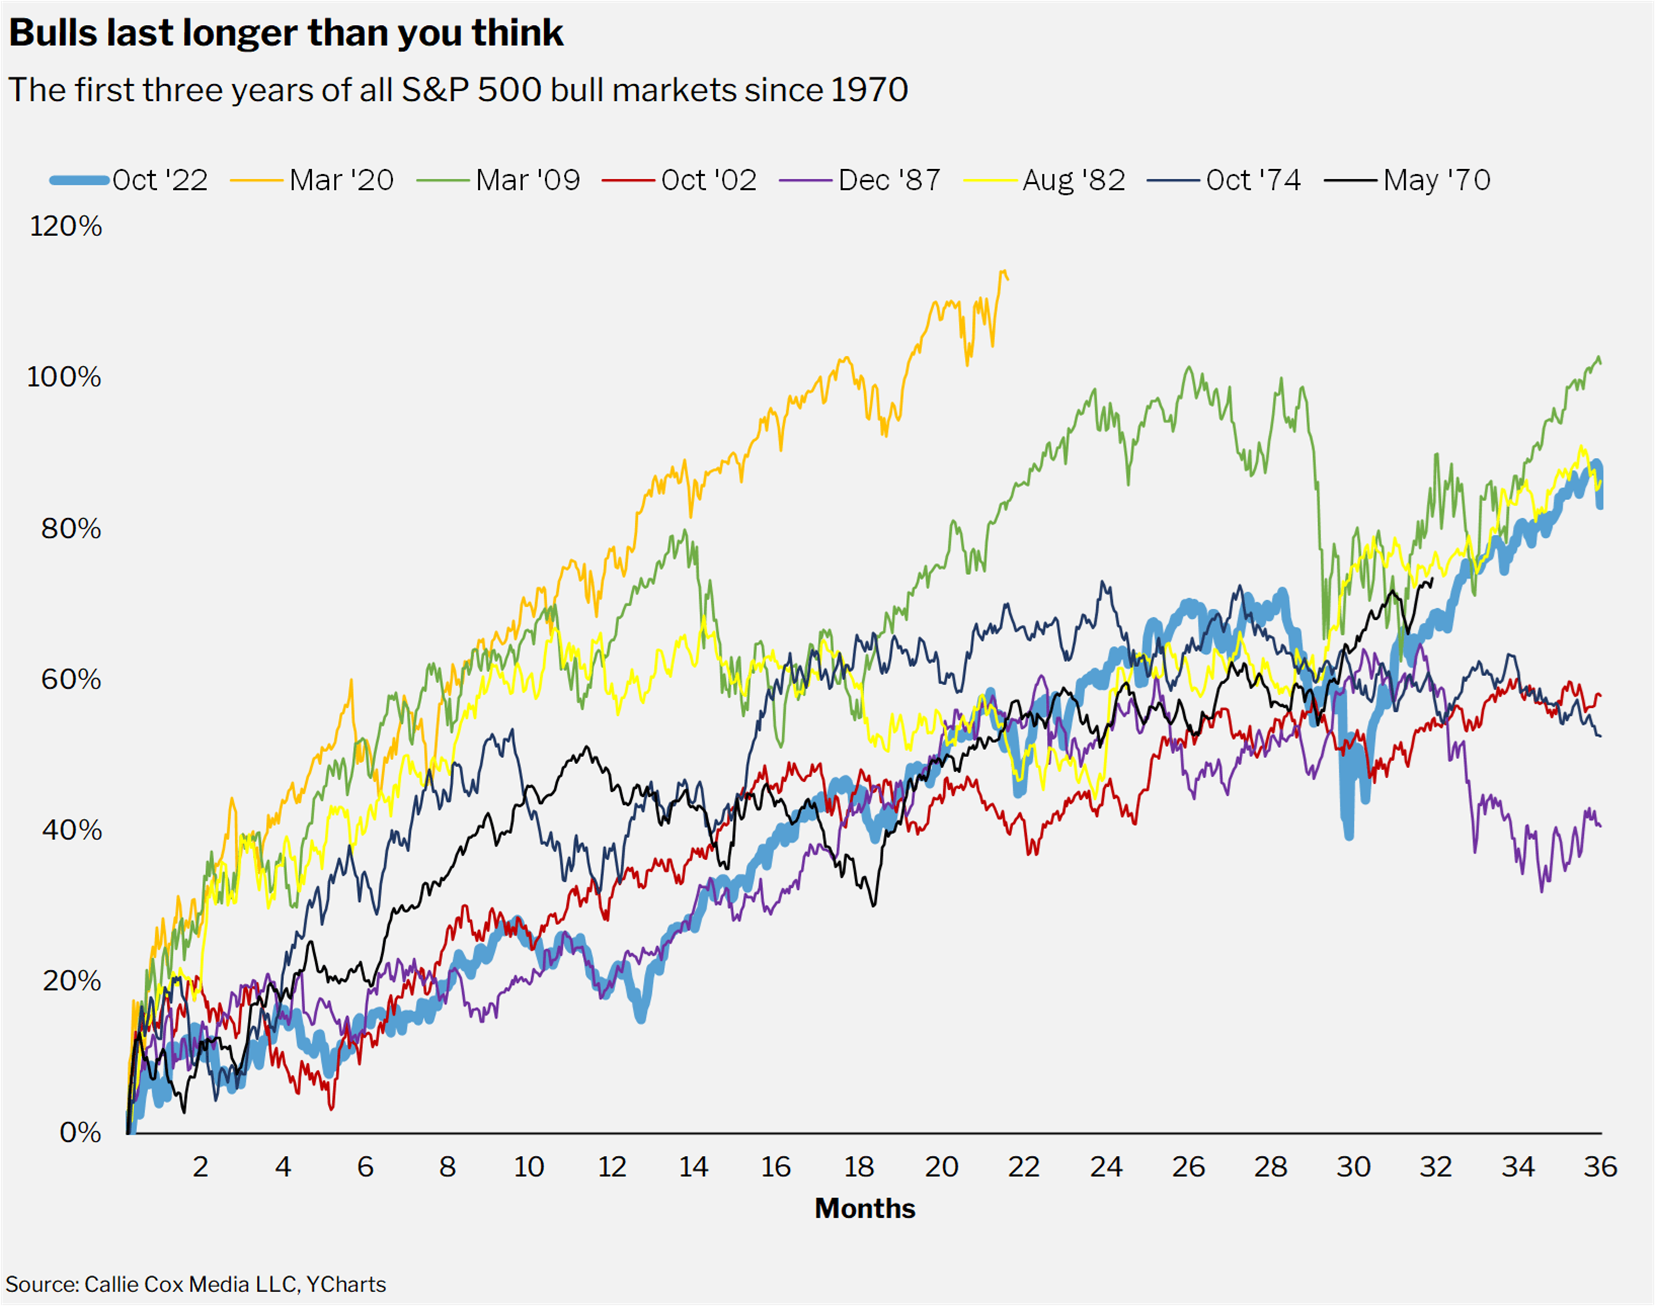
Notably, most bull markets that have made it to year three have celebrated their fourth birthday. Past performance is no guarantee of future returns, but the Federal Reserve is in an accommodative stance. Who knows? Maybe we’ll even get a trade deal with China. (Yes, the key word is “maybe.”)
Economic News Sentiment Could Favor the Bulls
A high frequency measure of economic sentiment—the San Francisco Federal Reserve’s Daily News Sentiment Index (DNSI)—is currently lower than 81% of all readings since 1980. “When pessimism about the economy gets as sour as it is today, usually the stock market has performed remarkably well,” wrote retired market strategist Jim Paulsen on his Substack.
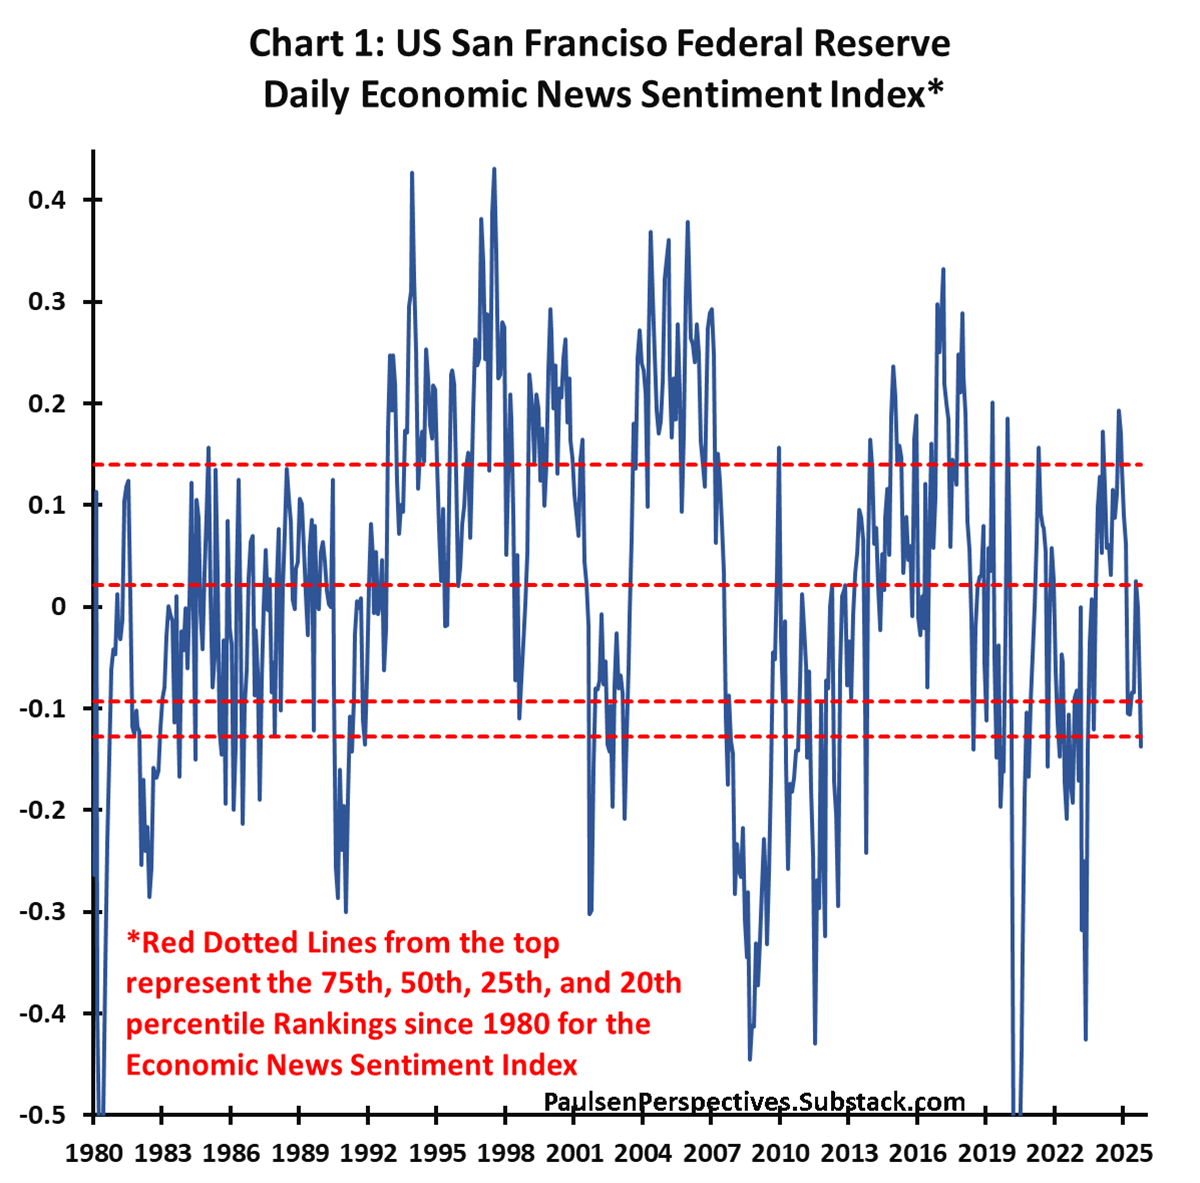
The DNSI provides economic news sentiment scores dating back to 1980. It constructs sentiment scores for economics-related news by analyzing articles from 24 major U.S. newspapers.
It Pays to Stay When the Market Is at All-Time Highs
This table from Schroders illustrates the advantage of staying invested when the market is trading at an all-time high. The footnote accompanying the table said, “Data January 1926–December 2024. Switching strategy moves into cash for the next month whenever the previous month-end was an all-time high and is invested in stocks whenever it wasn’t.”
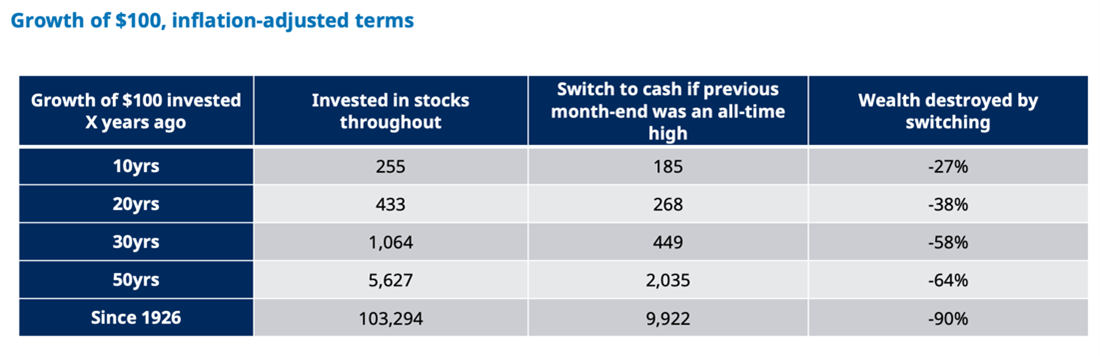
Source: Schroders.
Is Small-Cap Value Starting to Heat Up?
Over the past three months, the iShares Russell 2000 Value ETF  (IWN) has outperformed the iShares Core S&P 500 ETF (IVV). Three months is not enough time to declare a shift in trends, but small-cap value remains historically undervalued relative to large-cap stocks.
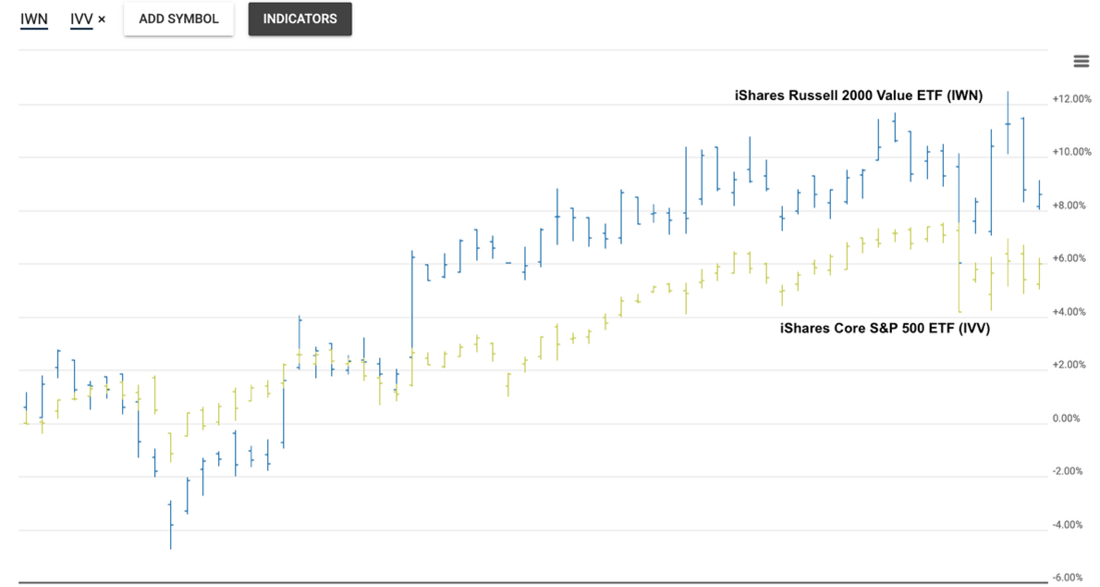
Source: QuoteMedia and AAII.com. Data as of 10/17/2025.
10 Companies Account for 40% of the S&P 500
Just 10 of the 500 companies within the S&P 500 account for 40.4% of the index’s market capitalization. This is an extremely high number.
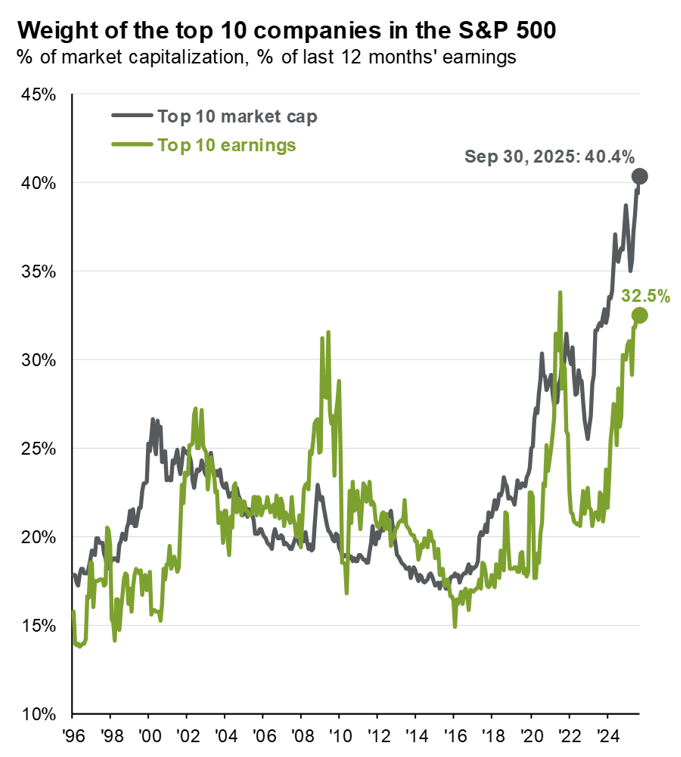
Source: J.P. Morgan Asset Management. Data as of 9/30/2025.
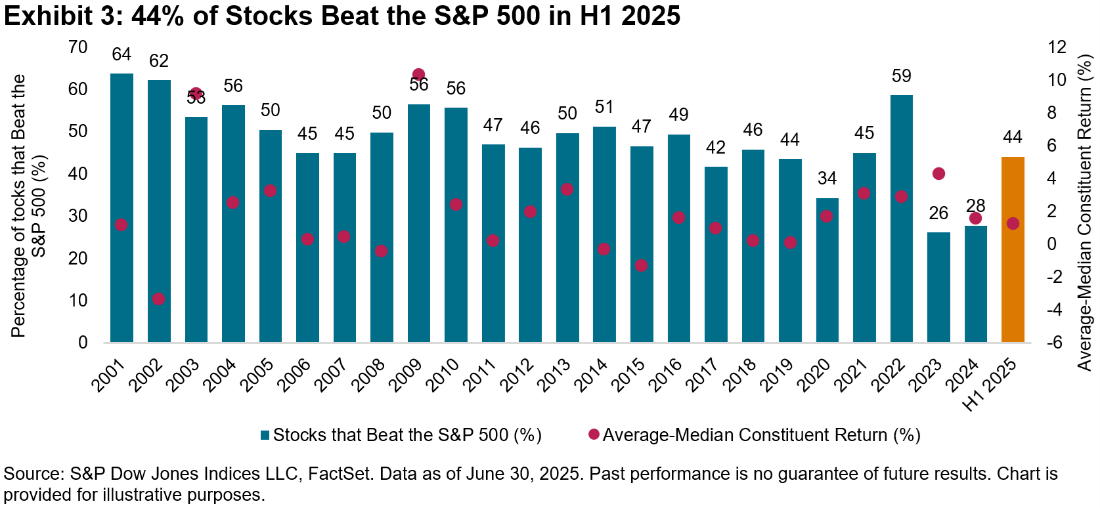
Fewer Than Half of the S&P 500 Stocks Are Beating the Index
Just 44% of the S&P 500’s member stocks outperformed the index during the first half of 2025. This below-average level has made it harder for large-cap stock pickers to outperform. It also explains why strategies that don’t target the so-called Magnificent Seven technology stocks are underperforming.
This Is Not Sustainable
One more chart from Schroders. Nasdaq composite companies with no revenues have realized the highest year-to-date price returns through September 30, 2025. Ranking in third and fourth place were unprofitable companies.
Revenues and earnings matter. Stocks of companies with no revenues implode. Unprofitable companies see their share prices suffer if they are unable to turn their business around. While there are some exceptions to these rules, they are a tiny minority.
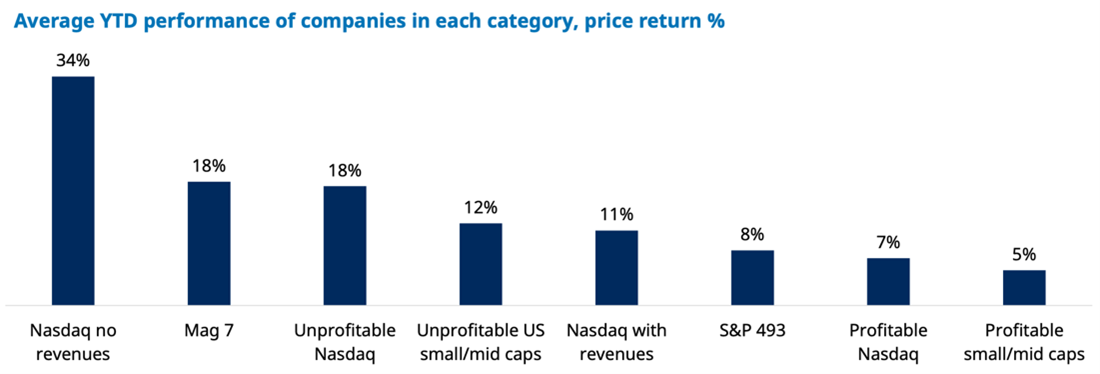
Source: Schroders.
Shoppers to Cap Spending This Holiday Season?
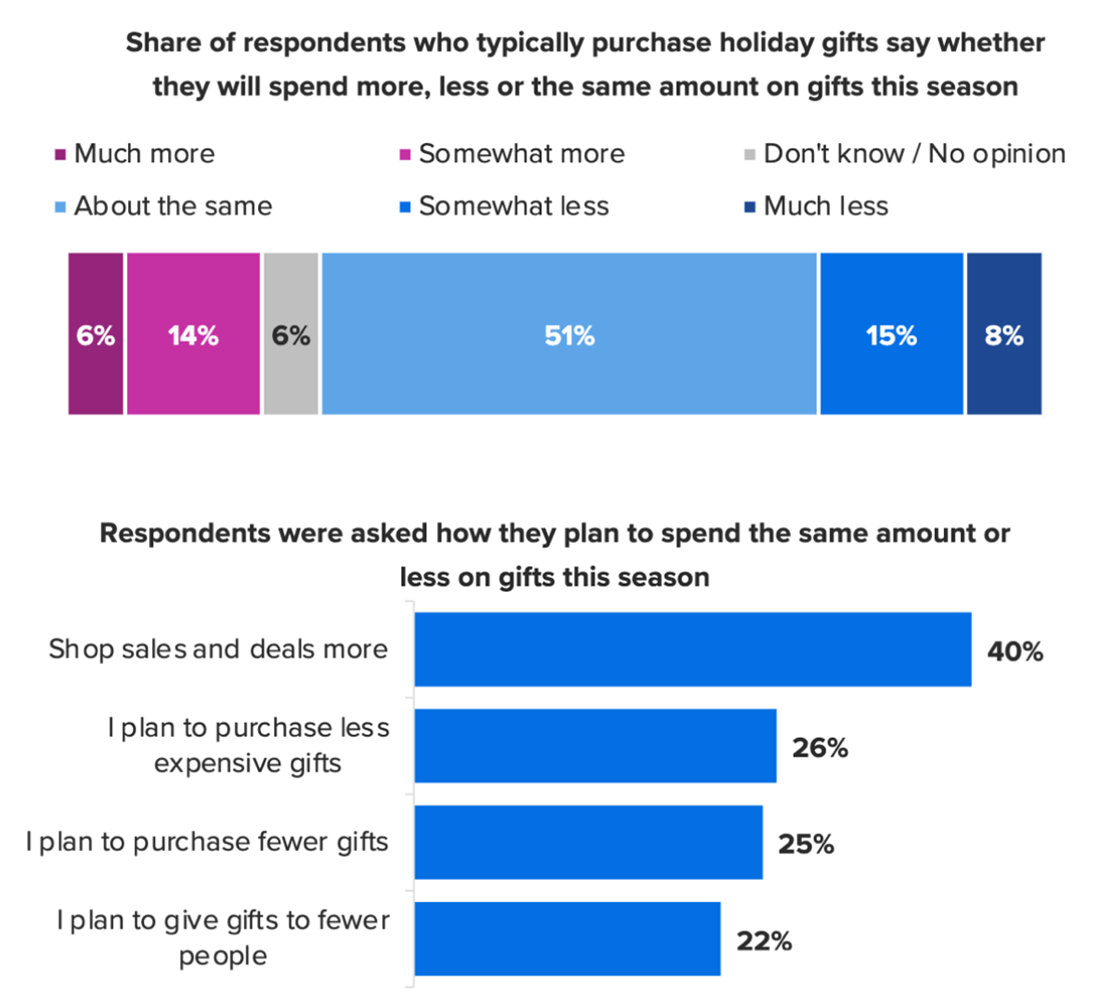
Since there are just 62 shopping days left until Christmas (52 days until Hanukkah), let’s get an early read on consumer spending plans.
“Most shoppers who typically buy holiday gifts (74%) said they plan to spend the same as they usually do, or less, this year,” a Morning Consult survey found. “Those who said they’re spending more are planning to buy more gifts (42%) and say they will give gifts to more people (35%), so their per-gift costs aren’t necessarily increasing as much as the size of their overall shopping list.”

-
The Implications of High Concentration in the S&P 500
Concentration tells you how much of an index’s or portfolio’s returns are influenced by its largest positions. -
Valuing a Company Based on Its Revenues
The price-to-sales ratio is considered to be one of the “cleanest” valuation multiples; it is also more tied to profit margin than you may realize. -
Power Up Your Portfolio With AI: A Practical Guide for Individual Investors
The October 2025 AAII Journal shows how AI tools like ChatGPT and Claude can be used to organize your portfolio, run “what-if” scenarios and test rebalancing strategies.
AAII Sentiment Survey
Pessimism among individual investors about the short-term outlook for stocks decreased in the latest AAII Sentiment Survey. Meanwhile, optimism and neutral sentiment increased.
Bullish sentiment, expectations that stock prices will rise over the next six months, increased 3.2 percentage points to 36.9%. Bullish sentiment is below its historical average of 37.5% for the second time in six weeks.
Neutral sentiment, expectations that stock prices will stay essentially unchanged over the next six months, increased 0.2 percentage points to 20.5%. Neutral sentiment is unusually low and is below its historical average of 31.5% for the 66th time in 68 weeks.
Bearish sentiment, expectations that stock prices will fall over the next six months, decreased 3.4 percentage points to 42.7%. Bearish sentiment is unusually high and is above its historical average of 31.0% for the 47th time in 49 weeks.
The bull-bear spread (bullish minus bearish sentiment) increased 6.6 percentage points to –5.8%. The bull-bear spread is below its historical average of 6.5% for the 35th time in 38 weeks.
This week’s special question asked AAII members if they think other investors are too bullish or too bearish right now.
Here is how they responded:
- They are too bullish: 54.5%
- Their sentiment toward the market is about right: 18.3%
- They are too bearish: 18.3%
- Not sure/no opinion: 9.0%
Bullish: 36.9%, up 3.2 points
Neutral: 20.5%, up 0.2 points
Bearish: 42.7%, down 3.4 points
Bullish: 37.5%
Neutral: 31.5%
Bearish: 31.0%
See more Sentiment Survey results.

October 16, 2025 Gold Soars, but the Reason Isn't Clear
October 9, 2025 More Time Spent on Your Portfolio Can Worsen Returns
October 2, 2025 Mutual Funds to Gain ETF Tax Advantages and Intraday Trading
September 25, 2025 Options for Your Cash as More Fed Rate Cuts Are Likely

Discussion
Barry from TX posted 11 months ago:
Charles, I didn’t get much “joy” out of this set of COIs. If these charts are our Christmas / Hanukkah presents from you, it looks like you might be in the 47% of the “somewhat less” or “much less” Grinches in the Morning Consult chart. Bah! Humbug! To reciprocate the sentiments, I will make a donation in AAII's name to the "Human Fund" like George Costanza did on a "Seinfeld" episode. Merry. Merry. Happy. Happy. And Happy Festivus. "We will begin with the airing of grievances. I will go first." Note: Jerry Stiller as Frank Castanza was the best role of his distinguished career since the Stiller-Meara comedy duo in 1960s - 1970s.
You need to log in as a registered AAII user before commenting.
Create an account