


Related


Portfolio Strategies
Concentration tells you how much of an index’s or portfolio’s returns are influenced by its largest positions.
by Charles Rotblut | July 2024

Charles Rotblut leads a class in AAII's new Essential Investing Video Course. Go to https://www.aaii.com/ves for more information and to subscribe.
“When it comes to measures of the market, May’s elephant in the room is concentration ... At the end of May, weights of the top-10 largest constituents in the S&P 500 summed to 34%,” observed S&P Dow Jones Indices in its May 2024 Factor Indices dashboard report.
Concentration tells you how much of an index’s or portfolio’s returns are influenced by its largest positions. Microsoft Corp.  (MSFT) accounted for 6.96% of the S&P 500 index’s total market capitalization at the end of May 2024, followed by Apple Inc. (AAPL) at 6.30% and Nvidia Corp. (NVDA) at 6.11%. Put another way, three stocks accounted for nearly one-fifth of the S&P 500’s market value and thereby performance.
High levels of concentration have occurred before. Michael Mauboussin and Dan Callahan, CFA, of Morgan Stanley point out that the 10 largest stocks accounted for about 30% of the U.S. stock market’s capitalization at the end of 1963 (“Stock Market Concentration: How Much Is Too Much?,” June 4, 2024). The 10 largest stocks accounted for 38% of the market in 1900. (There were fewer stocks traded in 1900, though.)
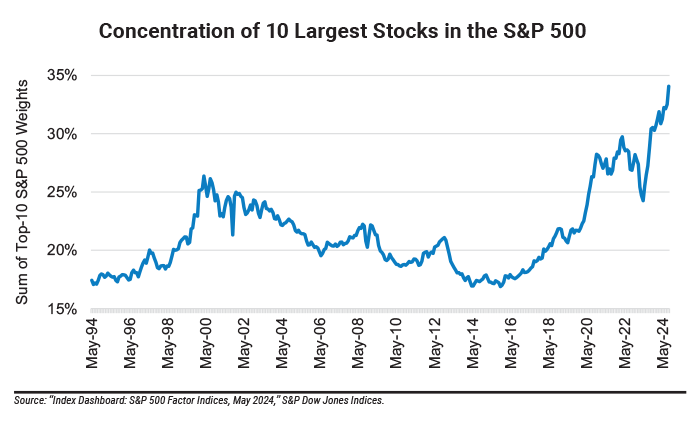
The primary risk of high concentration is that if the largest stocks stumble, the index’s returns will fall too. Large-cap and multi-cap mutual funds and exchange-traded funds (ETFs) will also be hurt.
Investors have a few options. One is to stay the course and continue to hold market-cap-weighted funds like the Vanguard 500 Index Admiral fund (VFIAX) or the iShares Core S&P 500 ETF (IVV). A second is to use equal-weight funds like the Invesco S&P 500 Equal Weight ETF (RSP). This ETF holds the same stocks as the two funds previously mentioned but weights them equally instead proportionately by market cap.
A third option is to focus on stocks providing exposure to factors associated with shareholder friendliness. S&P Dow Jones Indices found that portfolios targeting large-cap stocks engaged in buybacks outperformed the S&P 500 by approximately 10% during the 12 months following a peak in concentration. High dividend yields were a strong second-place finisher with about 8% outperformance. (Dividend strategies overall did well.) Equal-weighting and value strategies also delivered excess performance.
A fourth option is to scale down in size. Small-cap stocks continue to trade at historically large discounts relative to large-cap stocks.
Portfolio Strategies


BARRY J from TX posted over 2 years ago:
You need to log in as a registered AAII user before commenting.
Log InCreate an account