


Charles Rotblut leads a class in AAII's new Essential Investing Video Course. Go to https://www.aaii.com/ves for more information and to subscribe.

Featured Tickers:
The Invesco S&P 500 Equal Weight ETF  (RSP) marked its 20th anniversary in April 2023. The occasion provides an opportunity to look at how equal-weighted mutual funds and exchange-traded funds (ETFs) may fit into individual investors’ allocation strategies and portfolios.
A good place to start is whether there’s a rationale for considering mutual funds and ETFs that follow an equal-weighted approach.
Equal-weighted indexes, and the funds that track them, allocate evenly across all portfolio constituents. These indexes, mutual funds and ETFs rebalance at preset intervals to ensure each stock has the same weighting. This prevents any one stock from becoming too large or too small relative to all other holdings.
The logic rests in part on a common criticism of the S&P 500 index and other market-capitalization-weighted indexes: The largest constituents have the biggest impact on returns. Consider the SPDR S&P 500 ETF Trust (SPY) that tracks the S&P 500 index. Its 10 largest holdings have a 27.8% weight in the portfolio. Put another way, just 2% of stocks in the ETF’s portfolio account for 27.8% of the ETF’s performance.
This is a common occurrence with the market-cap-weighted indexes.
A comparison between the SPDR S&P 500 ETF and the Invesco S&P 500 Equal Weight ETF demonstrates how the market-cap-weighted and equal-weighted funds differ. The largest constituent of the S&P 500 is Apple Inc. (AAPL) with a market cap of $2.74 trillion as of May 5, 2023. It had a 7.5% weighting in SPDR S&P 500 as of May 5. Meanwhile, Invesco S&P 500 Equal Weight allocated 0.23% of its portfolio to Apple—a very big difference.
Now, let’s look at DISH Network Corp. (DISH). This S&P 500 member has a market cap of $3.8 billion as of May 5, or about 0.01% of Apple’s market value. DISH Network had a 0.005% weighting in SPDR S&P 500. Meanwhile, the stock’s weighting in Invesco S&P 500 Equal Weight was 0.13%.
Both ETFs hold the same stocks, but how they allocate to each stock is vastly different.
The impact these weightings have on performance is very noticeable. During the 12-month period ended April 2023, SPDR S&P 500 gained 2.6% while Invesco S&P 500 Equal Weight gained 0.3%.
More Recent Versus Longer-Term Performance
The performance of an equal-weighted index relative to its traditional market-cap-weighted counterpart is dependent in part on how concentrated the market-cap index is. It is the same for mutual funds and ETFs following each type of index.
Historically, the largest stocks in the S&P 500 have had less influence than they currently do. Data compiled by S&P Dow Jones Indices (SPDJI) shows that the five largest stocks accounted for less than 20% of the index continuously between the late 1970s and 2019. Between approximately 1983 and 2017, their combined weight mostly stayed below 15%. As of early May 2023, the five largest stocks in the S&P 500 had a 20.7% weight in SPDR S&P 500’s portfolio.
We point this out because it is key to understanding the returns of large-cap market-cap-weighted versus equal-weighted mutual funds and ETFs. As noted, Invesco S&P 500 Equal Weight has trailed SPDR S&P 500 during the 12-month period ended April 2023. Invesco S&P 500 Equal Weight also trailed SPDR S&P 500 over the past five years—9.8% versus 11.4%, respectively.
The story changes when longer periods are used. Here’s what Invesco wrote to commemorate the 20th anniversary of Invesco S&P 500 Equal Weight: “From when RSP was incepted (April 24, 2003) through December 31, 2022, the fund outperformed the S&P 500 Index by 1.08% on an annualized return at net asset value (NAV) of 10.81% vs. 9.73%, respectively. Based on rolling monthly periods, RSP outperformed the S&P 500 Index 50%, 54%, and 65% of the time over the most recent 3-, 5-, and 10-year periods.”
SPDJI took a longer look back. Using backtested data for the period of December 1970 through January 2003, the firm found that the S&P 500 Equal Weight index realized an annualized return of 12.69%, compared to 10.92% for the market-cap-weighted S&P 500. (The equal-weight index was launched in January 2003).
Why Does Equal Weight Work?
There are a few reasons why the S&P 500 Equal Weight index has outperformed over the long term.
Diversification is one. By limiting the influence that any single stock or small group of stocks can have on returns, equal weighting lessens company-specific risk.
Size is an even bigger reason. More than 50% of the difference in the S&P 500 Equal Weight index’s returns relative to the S&P 500 is attributable to company size. By assigning an equal allocation to all stocks, the equal-weight index allocates more to smaller companies. Since portfolios of smaller companies have outperformed portfolios of larger companies over the long term, so have equal-weighted portfolios relative to their market-cap-weighted counterparts.
Equal-weight strategies are also contrarian in nature. They sell what has done well and buy what hasn’t. This buy low and sell high approach works when there are changes in which stocks lead the market. It also backfires when the largest stocks are the ones sustaining the strongest price momentum. This happened during the latter half of the last decade when large-cap growth (especially technology and internet-based companies) outperformed.
Equal-Weighted Mutual Funds and ETFs
A challenge for individual investors is identifying equal-weighted mutual funds and ETFs. There isn’t an equal-weight category that can be used to identify them. Rather, a bit of legwork is required.
We ran basic screens on the A+ Investor Mutual Fund and ETF Screeners and downloaded spreadsheets with the results. (AAII members can download spreadsheets of fund data from the AAII Mutual Fund and ETF guides.) We then searched in Microsoft Excel to identify funds or indexes with the word “equal” in them.
We found just one no-load domestic mutual fund and nine ETFs that equal weight and are also not tied to sectors or a specific country. These funds are shown in Table 1.
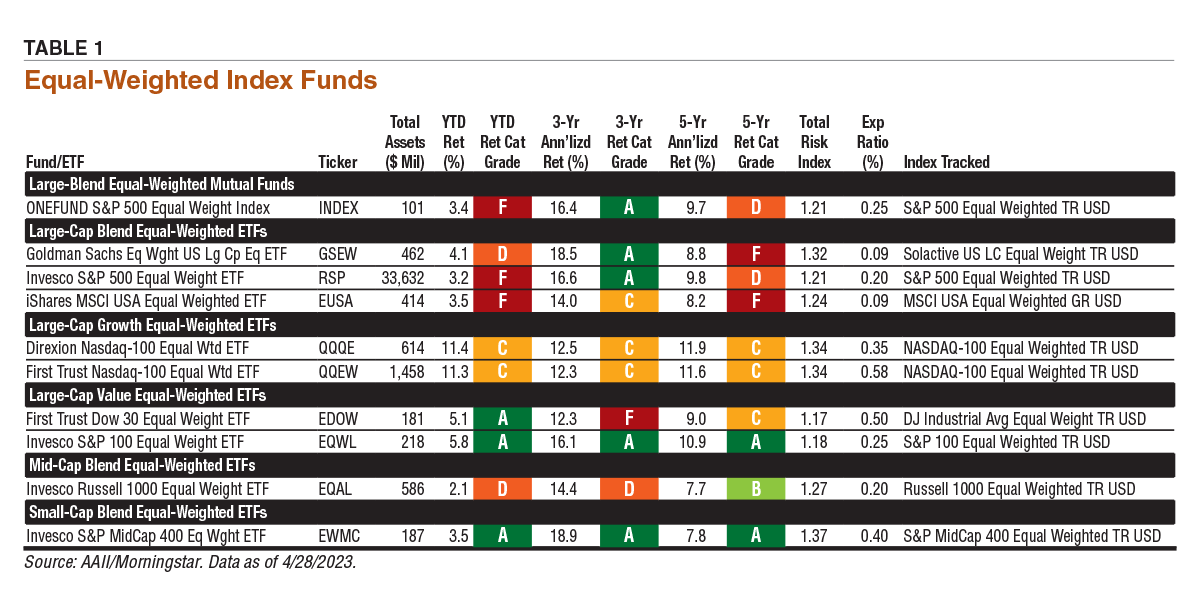
The funds are categorized by their portfolio composition, not by their names. The Direxion Nasdaq-100 Equal Weighted ETF (QQQE) and the First Trust Nasdaq-100 Equal Weighted ETF (QQEW) are both in the large-cap growth category in part due to their hefty exposure to large technology stocks. Conversely, the First Trust Dow 30 Equal Weight ETF (EDOW) equally weights the constituents of the Dow Jones industrial average and is therefore considered to be a large-cap value ETF.
You may also notice that the Invesco Russell 1000 Equal Weight ETF (EQAL) is categorized as a mid-cap fund and the Invesco S&P MidCap 400 Equal Weight ETF (EWMC) is categorized as a small-cap fund. Invesco Russell 1000 Equal Weight holds both large-cap and mid-cap stocks. Its portfolio average market cap was $41.2 billion at the end of March 2023. The average market cap for Invesco S&P MidCap 400 Equal Weight’s portfolio was $5.8 billion at the end of March.
Most of the funds are small in terms of total assets. Only Invesco S&P 500 Equal Weight and First Trust Nasdaq-100 Equal Weighted have more than $1 billion in assets.
Pairing Equal-Weighted Funds With Your Allocation
From the standpoint of portfolio allocation, equal-weighted funds should be viewed in the context of purposely tilting your portfolio allocation toward certain factors. Equal-weighted funds provide exposure to the size factor. Many also tilt toward the value factor.
From the standpoint of allocation, any of the large-cap funds or the mid-cap Invesco Russell 1000 Equal Weight can be used as substitutes for separate large- and mid-cap funds. In such instances, you would combine your large- and mid-cap allocation targets together. For example, instead of allocating 20% individually to large-cap and mid-cap stocks, as the AAII Aggressive Allocation Model calls for, you would simply allocate 40% (20% large cap + 20% mid cap) to an equal-weight fund.
Invesco S&P MidCap 400 Equal Weight could be used for either your mid-cap or a small-cap allocation. It would also work as a mid-cap fund for those who seek out micro-cap stocks for their small-cap allocation, like those held within the AAII Model Shadow Stock Portfolio. The iShares Core S&P Small-Cap ETF (IJR) could serve as a small-cap fund for those who would otherwise use a market-cap-weighted fund that holds larger small caps.
AAII’s former Level3 Passive Portfolio, which was created by AAII founder James Cloonan, allocated 30% to Invesco S&P 500 Equal Weight and 30% to Invesco Russell 1000 Equal Weight, along with 30% to the market-cap-weighted Vanguard Mid-Cap Value ETF (VOE). This blended equal-weighted funds with a market-cap-weighted fund that had a value tilt. The remaining 10% was allocated to the Vanguard Real Estate ETF (VNQ).
My wife and I use both traditional market-cap-weighted funds and Invesco Russell 1000 Equal Weight. This provides a blended approach as opposed to solely choosing a market-cap-weighted or equal-weighted approach. (For full disclosure, we also have a small position in Invesco S&P 500 Equal Weight.)
Tax Considerations for Equal-Weighted Funds
The periodic rebalancing creates some tax liabilities. Tax-cost ratios for most of the funds shown in Table 1 range between 0.6% and 0.8%. This means an investor in the highest tax bracket would incur a drag on returns of approximately 0.6% to 0.8% per year. This drag can be avoided by locating equal-weighted funds in tax-preferred accounts like a traditional or Roth IRA.
ONEFUND S&P 500 Equal Weight Index (INDEX), First Trust Dow 30 Equal Weight and Invesco S&P 100 Equal Weight ETF (EQWL) have tax-cost ratios of 0.8%.
First Trust Nasdaq-100 Equal Weight and Invesco S&P MidCap 400 Equal Weight have the lowest tax-cost ratios at 0.2% and 0.5%, respectively. They also rebalance quarterly.
Equal Weight: Same Stocks, Different Weights
Equal-weighted mutual funds and ETFs hold the same securities as similar market-cap-weighted funds but in different proportions. This reduces stock-specific risk and has historically led to higher long-term returns. The trade-off is periods of underperformance and higher tax-cost ratios.

Related

Portfolio Strategies
Level3 Passive Portfolio Transitions to Asset Allocation Models
Related

Investor Professor
Market Barometers: A Look at Stock Indexes and How They Work
Discussion
FREE REPORT

Get your free copy of our special
report analyzing the tech stocks
most likely to outperform the
market.
DAVE G from TX posted over 3 years ago:
BARRY J from TX posted over 3 years ago:
Jacques G from CAN posted over 3 years ago:
DAVID J from VA posted over 2 years ago:
You need to log in as a registered AAII user before commenting.
Log InCreate an account