


Wayne Thorp leads a class in AAII's new Essential Investing Video Course. Go to https://www.aaii.com/ves for more information and to subscribe.
- How AI tools can help investors organize portfolio data, analyze asset allocation and test rebalancing strategies
- Methods for stress-testing portfolios, spotting hidden risks and creating simple, evidence-based investment frameworks
- Discipline-focused checklists and guardrails for using AI effectively without complexity or overreliance on predictions
Managing an investment portfolio has always required balancing three core tasks: deciding how to allocate assets, preparing for downturns and maintaining discipline through rebalancing. Artificial intelligence (AI) tools like OpenAI’s ChatGPT and Anthropic’s Claude can assist with those tasks—not by replacing your judgment, but by providing structured analysis and alternative perspectives.
For individual investors, this means you can use AI to organize your portfolio, run “what-if” scenarios and test rebalancing strategies—all in plain language. The power of this technology lies not in predicting the future, but in helping you make better-informed decisions grounded in evidence-based principles. What follows is a comprehensive, AAII-style framework for applying AI to portfolio creation and management.
Preparing Your Data
Before asking AI to analyze your portfolio, you need a clean snapshot of what you own. Data discipline comes first. A surprisingly large share of AI “mistakes” in investing come from messy inputs: mislabeled tickers, categories that don’t add up or leaving out a holding that drives most of your portfolio’s risk. Build one simple input you can reuse.
Build Your Holdings List
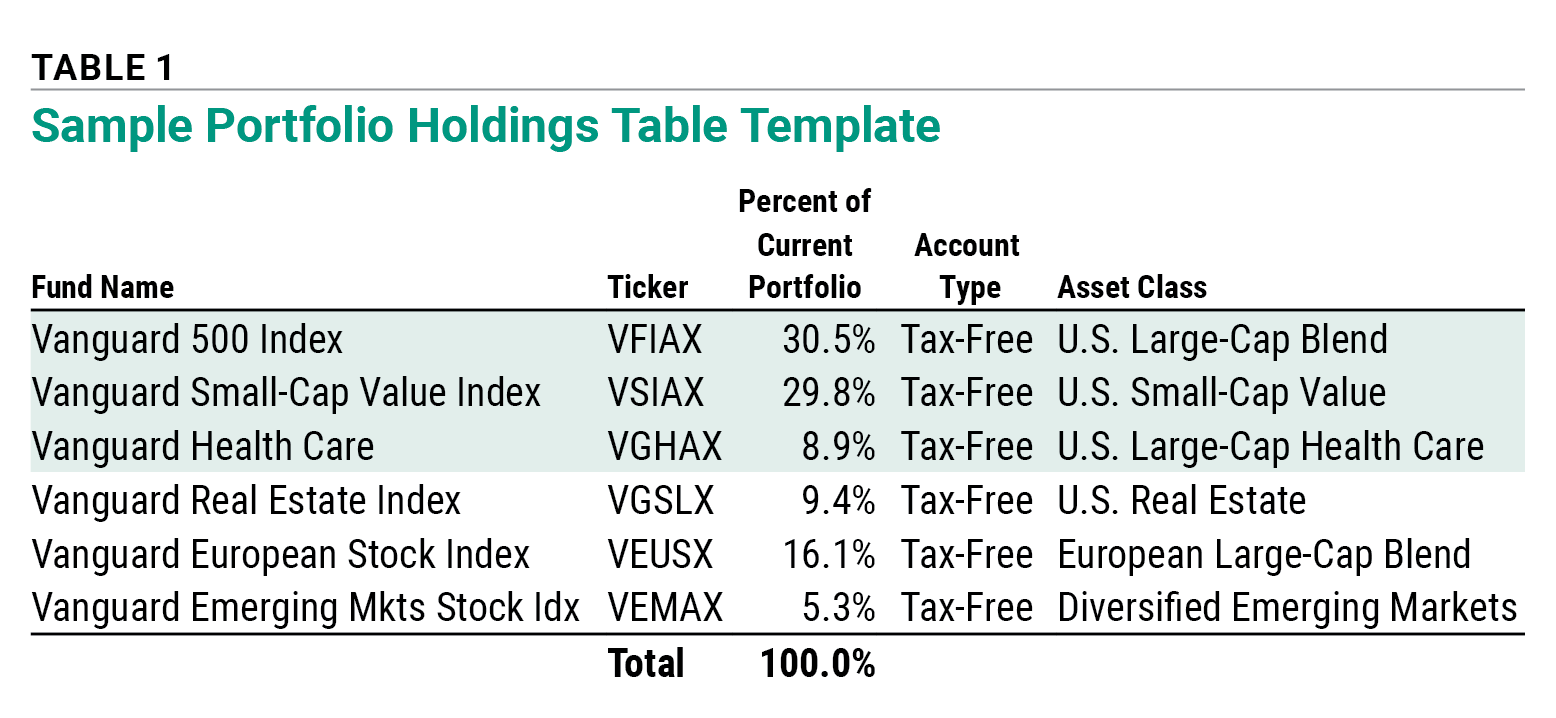
Include the following information in your portfolio list:
- Name—e.g., Vanguard S&P 500 ETF.
- Ticker—e.g., VOO.
- Current weight as a percentage of your total investable portfolio.
- Account location—e.g., taxable, traditional individual retirement account (IRA)/401(k), Roth IRA/401(k) or health savings account (HSA). This matters later for rebalancing and tax placement.
- Asset class—such as U.S. large-cap equity, international developed equity, emerging markets, U.S. aggregate bonds, Treasury inflation-protected securities (TIPS), real estate investment trusts (REITs), cash, etc.
Table 1 shows a sample portfolio holdings list you can use as a template.
Work in Percentages, Not Dollars
AI doesn’t need account balances or personal identifiers. Percentages protect privacy and make scenario comparisons cleaner across time.
Verify Accuracy
Totals must equal 100%. If you include cash, include all types of cash (sweep, settlement and money market). If your percentages sum to 96%, AI may treat the missing 4% as noise, skewing allocation or stress test results.
Use Reliable Sources
Pull holdings data from your brokerage, the fund company or a reputable aggregator. When you paste facts into AI, specify the source in plain language (e.g., “Facts from brokerage statement dated June 30”). That context helps later when you audit changes.
Be Consistent With Names and Categories
Map each ticker to a consistent category. Avoid sometimes labeling the Vanguard Total International Stock ETF (VXUS) as “international stocks” and other times as “foreign equity ex U.S.” Pick one label and keep it consistent so that prompts and follow-ups remain apples-to-apples.
Avoid Common Data Traps
Common data traps you want to be careful to sidestep include:
- Counting the same position twice across accounts.
- Treating a balanced fund (e.g., a 60/40 target-date fund) as 100% equity or 100% fixed income.
- Ignoring embedded cash within bond funds and money market funds.
- Forgetting employer stock or legacy single-stock positions that create hidden concentration.
- Mixing pretax and aftertax accounts without noting the difference.
Example Prompt
Here are my holdings by percentage: 40% VOO (U.S. large cap), 20% VTIAX (international), 25% BND (U.S. bonds), 5% VTIP (TIPS), 10% VNQ (U.S. REITs). Confirm that the total equals 100%, list each asset class, and flag any diversification gaps.
AI for Asset Allocation
Asset allocation—how you split money between stocks, bonds and other assets—is the most critical driver of long-term returns and risk. AI can help tailor familiar allocation frameworks to your circumstances without reinventing the wheel.
Anchor to a Proven Framework, Then Personalize
Start with something familiar: a target-date glide path, a 60% equity/40% fixed income reference mix or one of the AAII Asset Allocation Models. Ask AI to explain the trade-offs of tilting from that base. This keeps the conversation grounded and reduces the risk of overly complex portfolios.
Example Prompt: Use a 60/40 stock bond allocation as a starting point. I’m 45, with 20 years to retirement, and have a moderate risk tolerance. Show two variations: (A) 70/30 and (B) 50/50. For each, list pros/cons and long-run risk/return trade-offs.
Customize Allocation to Investor Profiles
- Accumulation (age 30s–40s): Emphasize equity exposure, diversify internationally and consider small value or quality tilts if desired. Keep fixed income broad (aggregate bonds + some TIPS).
- Pre-retirement (age 50s–early 60s): Lower volatility with more high-quality bonds and cash-like reserves. Increase exposure to TIPS to minimize the effect of inflation.
- Early retirement (first 10 years): Manage sequence risk with a slightly larger bond/cash allocation, a one- to three-year spending reserve and thoughtful rebalancing.
Below are two illustrative model mixes, intended for discussion, not advice.
- Moderate growth (long horizon): 80% stocks (60% U.S., 20% international), 15% bonds (core aggregate + TIPS), 5% REITs.
- Balanced (pre-retirement): 55% stocks (40% U.S., 15% international), 40% bonds (core aggregate + TIPS), 5% REITs.
Spot Concentration and Hidden Risks
Ask AI to diagnose where risk is actually coming from in your portfolio. A handful of mega-cap U.S. technology companies dominate many “diversified” portfolios. Bond allocations may be almost entirely interest rate risk with limited credit diversification.
Example Prompt: Evaluate concentration risks. Show top sectors and their share of total equity exposure. Identify any position contributing >10% of total risk and suggest two simple ways to reduce concentration while preserving the growth objective.
Avoid Needless Complexity
Most investors can reach their goals with three to eight broad funds. AI can tempt you into adding niche exposures that increase cost and noise more than diversification. Treat every additional fund as “guilty until proven useful.”
AAII discipline reminder: Cross-check AI-generated allocations against established models (target-date funds, AAII Asset Allocation Models, comparable benchmark mixes, etc.). Favor simplicity and broad, low-cost index funds.
Stress-Testing Your Portfolio
AI can’t forecast, but it can simulate how your portfolio might behave in stressful environments. Scenario analysis frames the range of outcomes you must be prepared to live with.
Use History as a Teaching Tool
Map your allocation onto past episodes:
- Dot-com crash (2000–2002): Prolonged equity drawdown with a slow, uneven recovery.
- Great Recession (2008–2009): A deep sell-off; high-quality bonds rallied, while credit spreads blew out.
- Pandemic shock (March 2020): A rapid sell-off and speedy recovery amid policy support.
You won’t achieve perfect precision—today’s funds didn’t always exist—but you’ll get a reasonable sense of drawdown magnitude and time to recovery.
Example Prompt
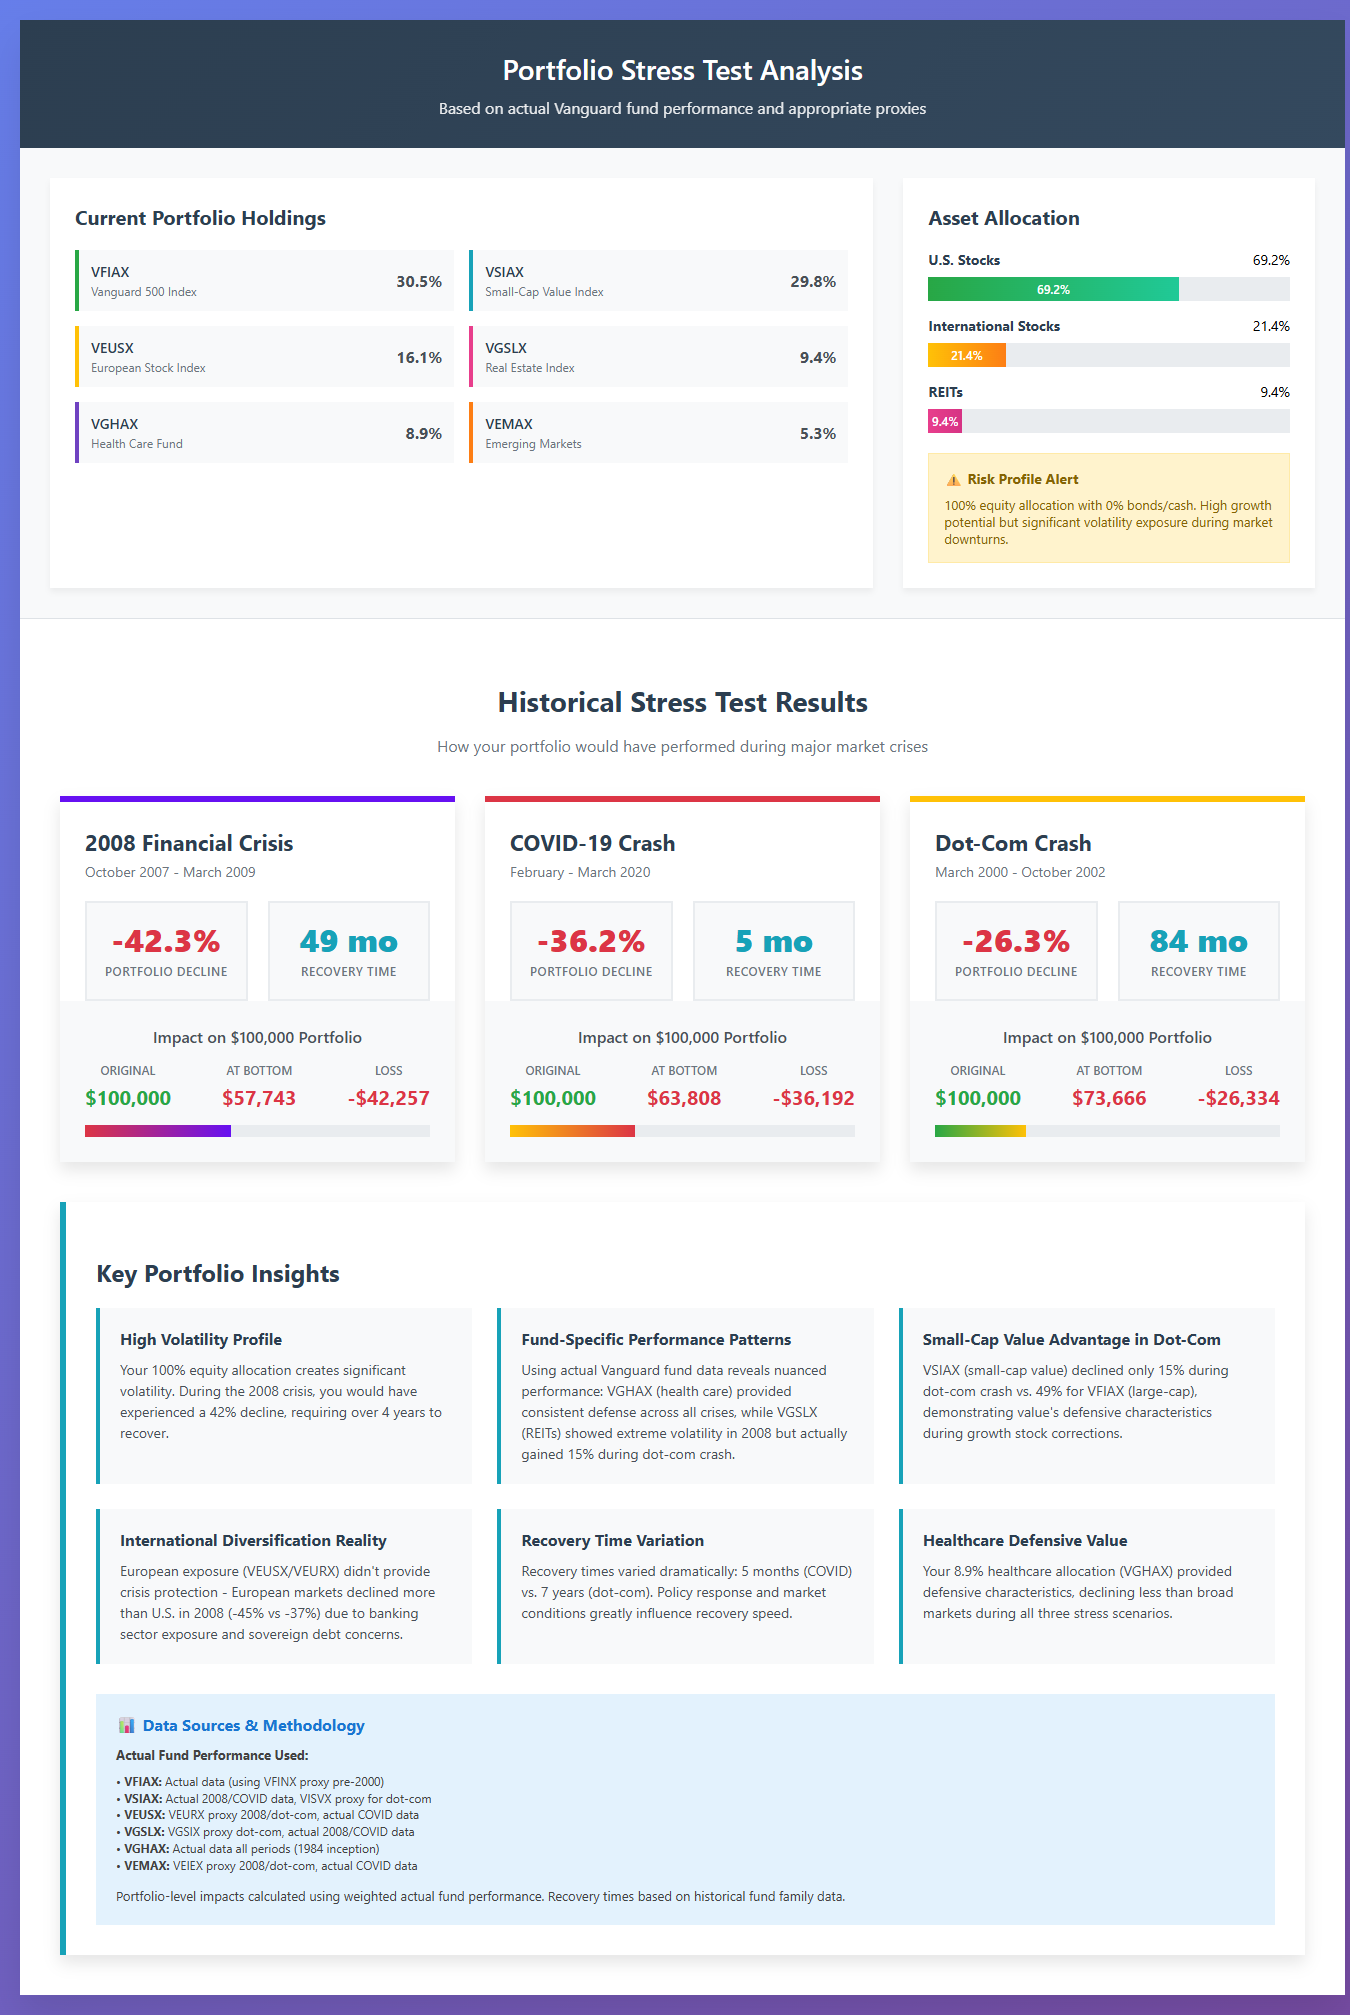
Input: Portfolio holdings with tickers and allocations (stocks, funds, ETFs, any mix)
Required Output:
Historical Performance Research
-
Get actual performance for 2008 Crisis, COVID Crash, Dot-Com Crash
- Use appropriate proxies for pre-inception periods (same fund family —> similar strategy —> benchmark)
-
Document what’s actual vs. proxy data
Portfolio Impact Calculation:
-
Weight each asset’s crisis performance by allocation
-
Calculate total portfolio decline for each scenario
-
Show impact on $100k portfolio and recovery time estimates
Risk Analysis:
-
Identify concentrations (single positions >10%, sectors >25%)
-
Flag 100% equity exposure or other risk factors
-
Note correlation between holdings
Professional Dashboard:
-
Holdings table with asset class breakdown
-
Three crisis scenario cards with decline %, recovery months, dollar impact
-
3-4 key insights specific to this portfolio’s composition
-
Data sources methodology
Quality Standards:
-
Use specific numbers, not estimates
-
Justify proxy selections
-
Provide actionable insights based on actual holdings
-
Professional design suitable for publication
Example: “AAPL 20%, VTSAX 60%, BND 20%” —> Complete stress test with fund-specific data and portfolio-level impact analysis.
Figure 1 shows a partial sample output of a stress test dashboard from Claude.
Design Bespoke Scenarios to Match Your Risks
- Equity shock, such as stocks −35%, bonds +5%.
- Inflation shock, such as inflation +5 percentage points; nominal bonds −10%; TIPS +4%.
- Growth scare with rate cuts, such as U.S. equities −20%; international −15%; long Treasurys +8%.
- Personal liquidity shock, such as need to raise 15% of portfolio for an emergency without breaching target allocation more than necessary.
Example Prompt: My portfolio is 60% stocks (45% U.S., 15% international), 35% bonds (core aggregate + TIPS), 5% REITs. Model three scenarios: (1) equity −30% / bonds +2%; (2) inflation spike: nominal bonds −10% / TIPS +4% / equities −12%; (3) personal cash need: withdraw 10% this year, then resume normal contributions. Show peak to trough loss and estimated years to recover under average historical conditions.
Sequence of Returns Risk for Retirees
For investors taking withdrawals, the order of returns matters as much as the average. Have AI compare two paths with the same 10-year average return but different sequences: one with bad years first and the other with bad years later. You’ll see why a cash/short-term bond buffer (one to three years of withdrawals) can materially reduce failure risk in early retirement.
Example Prompt: Assume a 4% initial withdrawal, inflation-adjusted annually, on a 55/45 portfolio. Compare outcomes when a −25% equity year occurs in year 1 vs. year 6. Show ending balance ranges and years to recover.
Focus on Time to Recovery, Not Just Drawdown
Drawdowns are inevitable. The more useful question to aid decision-making is whether your portfolio recovers on a timeline aligned with your goals. Ask AI to estimate recovery windows under different allocations and to highlight which mix narrows the worst-case recovery time without needless complexity.
Smart Rebalancing With AI
Rebalancing restores your portfolio to its target allocation after market movements. AI can help you test trade-offs among frequency, thresholds, taxes and cash flows—then codify a rule you’ll stick with.
Choose a Simple Rule You Can Live With
- Calendar-based: Review annually or semiannually. Low maintenance; may allow more drift between check-ins.
- Threshold-based: Trade only when an asset class deviates by, say, ±5 percentage points from target. Often, this rule is more tax-efficient in practice by reducing needless trades during small moves.
Side-by-Side Test: Ask AI to outline a 10- to 15-year backtest structure (not a prediction) using reasonable return/volatility assumptions. Compare realized drift, number of trades and approximate tax cost for each rule. You’re not optimizing to the third decimal; you’re selecting a policy you’ll actually follow.
Respect Taxes and Trading Costs
In taxable accounts, rebalancing can result in realized gains. Direct new contributions and dividends into underweight assets first; use sales only when drift exceeds thresholds. In tax-advantaged accounts, you have more flexibility to trade without tax impact.
- Hold higher-yielding bonds and REITs in tax-deferred accounts when possible.
- Use taxable accounts for broad equity index funds with low turnover.
- Place TIPS strategically depending on your tax situation.
Example Prompt: Compare rebalancing my 70/30 stock bond portfolio every 12 months vs. only when allocations drift more than 5%. Assume I hold both taxable and IRA accounts, pay a 22% marginal tax rate, and contribute $500 per month. Show estimated trades per year, typical tax cost in taxable accounts, and whether either rule materially changes long-run risk.
Codify the Plan as “If-Then” Rules
Write the rule so future-you can execute it quickly, even in turbulent markets. AI can draft this plain-language policy based on your preferences.
Example Prompt: Draft a one-page rebalancing policy for a 60/40 investor who prefers threshold rules, wants to use new contributions first, and wants to minimize realized gains in taxable accounts.
Practical Investor Scenarios
To make these concepts tangible, consider three scenarios where AI supports different life stages.
Scenario 1: The 30-Year-Old Growth Investor
Emma is 30 years old, just beginning serious investing. She inputs her 90% stock/10% bond portfolio into ChatGPT and asks it to compare her mix to a 2065 target-date fund. The AI highlights zero international exposure and a significant tilt toward U.S. large-cap growth. With a simple prompt, she gets a revised allocation: 70% U.S. stocks, 20% international stocks and 10% bonds.
Emma stays stock-heavy but diversifies globally and adds a bond cushion. She also has AI draft a one-paragraph investment policy that defines her tolerance bands (±5%) and a calendar review each June/December. Two quarters later, a rally pushes her domestic equities to 78%. Rather than panic, she uses new contributions to top up bonds and international stocks until she’s back within band with no sales or taxes.
Scenario 2: The 55-Year-Old Pre-retiree
David is 55 years old, aiming to retire at 65. He holds 70% in equities, 20% in bonds and 10% in REITs. A stress test of the Great Recession indicates a potential 35% to 40% drawdown, with a six-to-seven-year recovery period. AI suggests reducing equities to 55% and raising bonds to 35% (including TIPS). David adopts a threshold-based rebalancing rule (±5%) and sets an alert to direct quarterly contributions into whichever asset is below target.
When a mini correction hits, AI proposes the fewest trades to restore balance while minimizing realized gains in his taxable account. He executes just two trades in his IRA and points taxable dividends to underweight assets—a tax-aware adjustment that keeps him on plan.
Scenario 3: The 65-Year-Old Retiree
Linda has just retired with a $1 million portfolio, consisting of 60% equities and 40% bonds. She asks AI to model withdrawals under two sequences: a 25% decline in year one versus year six, with a 4% initial withdrawal rate. The model shows that sequence risk could significantly reduce her balance if losses occur early. Linda establishes a three-year cash buffer [laddered certificates of deposit (CDs) and short-term bonds] by trimming equities.
AI drafts a rebalancing policy that taps the buffer first during down years and then refills it during recovery years. A follow-up prompt helps her decide on tax-efficient placement: bonds and REITs in her IRA, broad equity index funds in her taxable account and a small Roth IRA sleeve reserved for future high-growth assets.
A Quarterly AI-Enabled Portfolio Review
A disciplined schedule prevents overreaction to short-term noise. Quarterly or semiannual reviews are plenty. AI can standardize the process so each review is comparable to the last.
Four-Step Review Process
1. Check allocation
- Paste the current portfolio weights and confirm that they match your target within the specified tolerance (e.g., ±5%).
- Ask AI to highlight any asset now outside the band and quantify the drift’s impact on risk.
2. Run two stress tests
- One market-driven (e.g., equity −30% with bonds +3%)
- One personal (e.g., unexpected cash need equal to 10% of the portfolio this year)
- Have AI estimate recovery windows under each.
3. Evaluate rebalancing needs
- Direct new contributions and dividends to underweight assets first.
- If drift exceeds your threshold, ask AI to propose the fewest trades that restore the target within tax constraints.
- For taxable accounts, request a harvested-loss check before selling.
4. Cross-check advice
- Compare against a relevant target-date fund or an AAII Asset Allocation Model for your age/risk. If your mix is significantly off, ensure there’s an apparent, intentional reason.
- Archive a brief “decision memo” generated by AI for your files.
Example Prompt: Summarize my current allocation, test how it would have performed in 2008, and recommend whether rebalancing is necessary given my 60/40 target. Propose trades that minimize realized gains in taxable accounts using new contributions first.
Build a Repeatable Checklist
Ask AI to output the review as a dated checklist with your decisions, rationale and any trades executed. The audit trail enhances discipline and facilitates faster future reviews.
Guardrails and Limitations
AI is a powerful analytical assistant, but without discipline, it can be misused. Keep these guidelines front and center:
- AI does not predict markets. Its analysis is backward-looking or scenario-based. Treat “confidence” in outputs as formatting, not foresight.
- Avoid unnecessary complexity. Most investors can meet goals with three to eight broad funds. Resist portfolios that mushroom into a dozen niche exposures with tiny weights.
- Stick to evidence-based principles. Diversification, low costs and patience remain cornerstones of successful investing. Any AI suggestion that conflicts with these deserves extra scrutiny.
- Verify before acting. Cross-check with fund company resources, brokerage tools or AAII research. If an AI recommendation cannot be explained in plain English, skip it.
- Stay in control. AI’s role is to illuminate trade-offs, surface blind spots and draft rules. It is not to make discretionary decisions for you.
- Mind behavioral pitfalls. Don’t use AI to justify frequent strategy changes. Codify a policy and let AI help you follow it.
- Privacy matters. Don’t paste account numbers, Social Security numbers or full dollar balances; percentages are sufficient.
- Garbage in, garbage out. Poor inputs produce poor outputs. Keep your holdings table clean and consistent over time.
Human Judgment + AI Insights
AI-assisted investing isn’t about turning your portfolio over to a machine. It’s about sharpening established practices: setting an allocation, managing risks and maintaining discipline through rebalancing.
When used appropriately, AI can:
- Highlight risks you might miss.
- Stress-test your allocation under realistic scenarios.
- Suggest efficient, tax-aware rebalancing strategies.
- Produce plain-language checklists that reinforce your process.
The advantage remains where it always has been—with the patient, disciplined investor. AI adds another tool to your decision-making process. Combine human judgment with AI-powered insights to build a portfolio that is resilient, diversified and aligned with your long-term goals.
Appendix: Copy/Paste Prompt Library
-
Clean portfolio snapshot
Create a clean portfolio table with columns for Ticker, Asset Class, Account Type, and % of portfolio from the list below. Check that the percentages sum to 100% and flag any duplicate or overlapping holdings: [paste holdings and weights]. -
Allocation anchored to a reference
Starting from a [60/40] benchmark, propose two alternative allocations suited to a [moderate] risk investor with [20 years] to retirement who already holds [REITs]. For each, list expected volatility differences and the simplest set of index funds to implement. -
Concentration and hidden risks
Analyze sector and geographic concentration in this equity mix. Identifyany sector exceeding [25%] of total equity exposure or any single stock representingmore than [5%] via a fund. Suggest the simplest change to reduce concentration without adding more than two new funds. -
Sequence of returns illustration
With a [55/45] portfolio and a [4%] initialwithdrawal, inflation-adjusted annually, compare two 10-year paths that have the same average return but where the worst year occurs in year [1] vs. year [6]. Show ending balance ranges and the maximumdrawdown through year [10]. -
Threshold versus calendar rebalancing
Compare rebalancing policies: (A) rebalance annually each January; (B) rebalance only when any asset class deviates by more than [±5 percentage points] from target. Assume a taxable account with a [22%] marginal rate and new contributions of [$X] per month. Summarize trades per year and typical tax implications. -
Minimal trade rebalancing plan
Given my current weights and a [60/40] target, propose the fewest trades requiredto bring the portfolio within a [±3%] tolerance band. Prioritize using new contributions first and avoiding sales in taxable accounts. -
Quarterly review checklist
Produce a dated, bullet point review that covers:current allocation vs. target, stress test results for [two] scenarios, rebalancing actions (or none), and any changes to the written policy. Keep to 200–300 words. -
Tax-aware asset location
Given holdings in [taxable], [traditional IRA], and [Roth], suggest a tax-efficient asset location plan that keeps my overall allocation unchanged. Provide a one-paragraph explanation I can keep with my investment policy statement. -
Investment policy statement and rebalancing policy draft
Draft a one-page investment policy statement for a [moderate risk, long horizon] investor using a [threshold-based] rebalancing rule and a [quarterly] review schedule. Include tolerance bands, the role of new contributions, and guardrails for behavior during market stress.

Related

Portfolio Strategies
How Rebalancing Helps When Downturns Strike Early
Related

Portfolio Strategies
Why You Should Consider Volatility When Building a Portfolio
Discussion
FREE REPORT

Get your free copy of our special
report analyzing the tech stocks
most likely to outperform the
market.
BARRY J from TX posted about 1 year ago:
ROBERT A from NC posted about 1 year ago:
D. R from MD posted 28 days ago:
D. R from MD posted 28 days ago:
You need to log in as a registered AAII user before commenting.
Log InCreate an account