


Charles Rotblut leads a class in AAII's new Essential Investing Video Course. Go to https://www.aaii.com/ves for more information and to subscribe.
- Bear markets occurring early in retirement significantly impact portfolio balances when funds are withdrawn annually
- Rebalancing mitigates sequence risk, preserving portfolio wealth during downturns
- Taking withdrawals proportionately based on allocation helps whether or not rebalancing is used
Time in the market matters if you want to harness the power of compounding. How you manage your portfolio during the time you are in the market matters too. Market downturns that occur early within a given period can have a lasting impact on a portfolio if corrective measures are not taken, especially after regular savings contributions have ended.
In this year’s update to my ongoing analysis of portfolio rebalancing, I show how the timing of three of the past four bear markets (the dot-com crash, the global financial crisis and 2022’s stock market decline) combined to have a lasting impact. The impact is evident even with last year’s strong rebound in the S&P 500 index.
Retirees making withdrawals from diversified portfolios who took measures to maintain their allocations—such as rebalancing—had a better outcome than those who did little to preserve their allocation weightings. Those who did not take withdrawals only gave up a small amount of returns to benefit from lower volatility.
Before getting into the details, here are a few takeaways:
- Bear markets have a particularly notable impact when they occur early in retirement. This is because portfolio balances are large, and no additional savings contributions are being made.
- The withdrawal portfolios ended 2023 with their lowest balance of all rolling 25-year periods analyzed because of when the bear markets occurred.
- Ending balances for the rebalanced and non-rebalanced non-withdrawal portfolios were close for the most recent 25-year period ending in 2023. This was the case for both the moderate and aggressive allocations.
- We altered how withdrawals are taken from each asset class group from our prior analysis of rebalancing.
It Matters When a Bad Sequence of Returns Occurs
Sequence risk refers to the chance of incurring ill-timed negative returns. Repeating what I’ve written before, sequence risk matters to those who are currently taking or will need to take withdrawals within the next few years. Sequence risk can also make investors who don’t need withdrawals nervous enough to shift money out of stocks. This nervousness occurs even though sequence risk can be a friend to those who are in the process of building long-term wealth and won’t need to take withdrawals within the foreseeable future.
Consider the 25-year rolling period used for this year’s analysis. It ran from January 1999 through December 2023. During this period, the S&P 500 incurred calendar-year drops of 9.1% in 2000, 12.0% in 2001 and 22.2% in 2002. It then plunged by 37.0% in 2008. These combined for four down years in less than a decade.
A retiree whose portfolio was fully allocated to an S&P 500 fund and used an inflation-adjusted withdrawal rate would have seen their starting balance of $100,000 dwindle to $42,348 by the end of 2008. They would have completely drained their savings before the end of 2019.
The scenario assumes that withdrawals equal to 4.5% of the portfolio’s starting balance were taken and adjusted upward every calendar year to account for inflation. The damage done to the portfolio illustrates the importance of making periodic adjustments along the way. These adjustments can be rebalancing (which we demonstrate here), adjusting the size of withdrawals or a combination of the two.
Rebalancing also worked from a psychological standpoint for investors who were saving. Our models show that the financial trade-off of rebalancing to reduce volatility was nominal for the non-withdrawal portfolios over the most recent 25-year period when done in a tax-preferred account.
For those who took retirement or other withdrawals, rebalancing resulted in larger ending balances over the 1999–2023 period. This advantage occurred when either the aggressive or moderate allocations were followed.
Portfolios and Allocations Used to Test Rebalancing
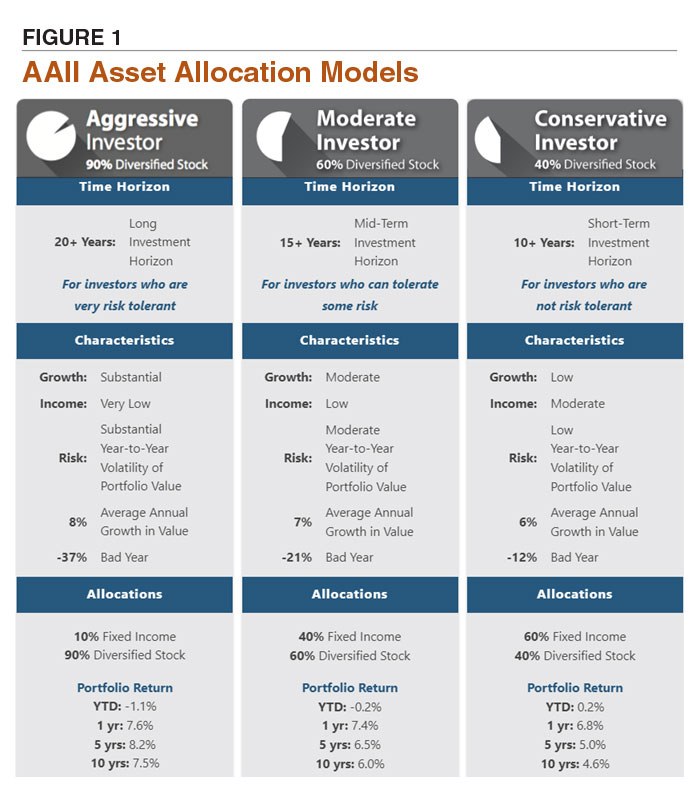
Our analysis of rebalancing is based on hypothetical portfolios using the AAII moderate investor Asset Allocation Model and the AAII aggressive investor Asset Allocation Model.
The moderate allocation model modifies the traditional 60% equity/40% fixed-income allocation strategy by incorporating greater diversification on the equity side and a shorter duration (meaning less interest rate sensitivity) on the bond side. Specifically, the model calls for allocating 20% to large-cap stocks, 15% to mid-cap stocks, 10% to small-cap stocks and 15% to international stocks. On the bond side, it calls for a 30% allocation to intermediate-term bonds and a 10% allocation to short-term bonds. (An intermediate-term bond fund is used for the entire bond allocation in the rebalancing models.)
The aggressive allocation model has 90% in equities and 10% in fixed income. The model calls for allocating 20% to large-cap stocks, 20% to mid-cap stocks, 20% to small-cap stocks, 20% to international stocks and 10% to emerging markets stocks. On the bond side, it calls for a 10% allocation to intermediate-term bonds. (Cash and cash equivalents, such as a money market fund, could be used in lieu of bonds.)
Figure 1 shows the characteristics and hypothetical returns for AAII’s allocation models.
The portfolios use Vanguard mutual funds to replicate the returns an investor could have realized after fund fees are factored in. The Investor share class of funds was used for the period of 1988 through 2017. The Admiral share class of funds was substituted in 2018 because Vanguard stopped offering the Investor shares class to most investors. Part of the goal of this study is to show the returns an investor could have realized in a real-world portfolio, gross of taxes and specific account fees.
Twelve rolling 25-year period models are the subsets, with starting dates ranging from 1988 to 1999.
The hypothetical portfolios are either non-withdrawal or withdrawal. As the name implies, no withdrawals were taken out of the non-withdrawal portfolios.
A Tweak Made to How Withdrawals Are Taken
The withdrawal portfolios assume that a retiree makes annual withdrawals based on an inflation-adjusted 4.5% rate. A withdrawal equal to 4.5% of the portfolios’ balances at the end of the first year was taken. This initial withdrawal rate was then increased each year by the rate of inflation. The strategy is based on research by retired financial planner William Bengen. (Required minimum distributions, or RMDs, were not used because age, account type and life expectancy would impact the calculation of the withdrawal rate.)
The year-over-year change in the consumer price index for all urban consumers (CPI-U) was used to determine the inflation adjustment. This benchmark can be substituted with a different measure.
In our prior articles on rebalancing, withdrawals were taken evenly from each of the funds in the moderate allocation portfolios. We tweaked the strategy this year so that withdrawals are proportionate to the prior year’s portfolio weighting for each fund. For example, the large-cap (S&P 500) fund accounted for 24.4% of the non-rebalanced withdrawal’s portfolio total balance at the end of 2022 when the moderate allocation was used. Therefore, in 2023, 24.4% of the year’s total withdrawal came from the large-cap fund.
This change was made to better approximate what retirees do in terms of deciding which funds to withdraw from. While we can’t model the decisions made by each individual investor, this is a more realistic way of allocating where dollars get withdrawn from within a portfolio.
It also proved to be beneficial to the non-rebalanced withdrawal portfolios. Not once did any of the fund balances fall to $0. Ending balances also increased. The lowest ending balance was $79,435 (for the period of 1999–2023). The ending balance was $25,022 at the end of 2023 for the same portfolio under the older methodology with equity allocations drained down to $0.
How We Rebalanced the Portfolios
Rebalancing took place whenever a specific allocation was more than five percentage points above or below its target at year-end. This threshold band is based on research by Vanguard. It allows the portfolio to benefit from short-term momentum in asset class groups while not straying too far from its targeted allocation.
Rebalancing Limited the Damage of Sequence Risk
A walk through some of the numbers from the 1999–2023 period will allow us to better illustrate the lasting impact of two bear markets occurring early in the investment period. The portfolios had a starting balance of $100,000 in January 1999, as previously noted.
We’ll start with the moderate non-withdrawal portfolios to keep the example simple.
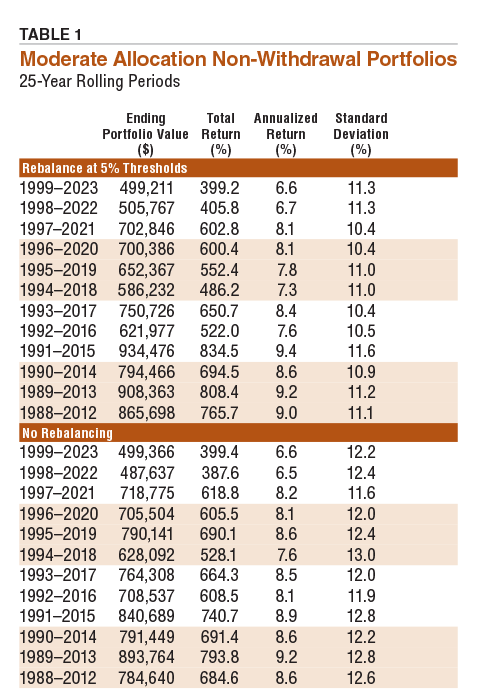
The rebalanced non-withdrawal portfolio had a slight wealth advantage versus the non-rebalanced portfolio after five years: $129,639 versus $126,670. Rebalancing, in this case, involved shifting portfolio dollars into stocks at the end of 2002 following the bear market drop. This led to a larger rebound in the rebalanced portfolio relative to the non-rebalanced portfolio. By the end of 2007, the rebalanced portfolio was worth nearly $5,500 more than the non-rebalanced portfolio ($189,176 versus $183,719).
This advantage widened to more than $13,000 by the end of 2009. Even so, both portfolios had yet to recover from the global financial crisis bear market. (Their balances were $181,229 and $167,955, respectively.) The rebalanced non-withdrawal portfolio went into the financial crisis with a lower allocation to equities than the non-rebalanced portfolio (60.1% versus 65.0% at the end of 2007) because the allocation was adjusted back to target at the end of 2006. It was then rebalanced at the end of 2008 due to the equity allocations falling too far below their allocation targets.
The non-rebalanced portfolio’s equity weighting grew in the years following the global financial crisis from 57.5% at the end of 2009 to 80.2% in 2023. This increasing exposure to equities—particularly large- and mid-cap domestic stocks—helped the portfolio to rebound more strongly during the 2010s and the early 2020s. Despite ending with an 80% allocation to stocks versus 62% for the rebalanced portfolio, its ending balance ($499,366) was just barely higher than the rebalanced portfolio ($499,211), as shown in Table 1.
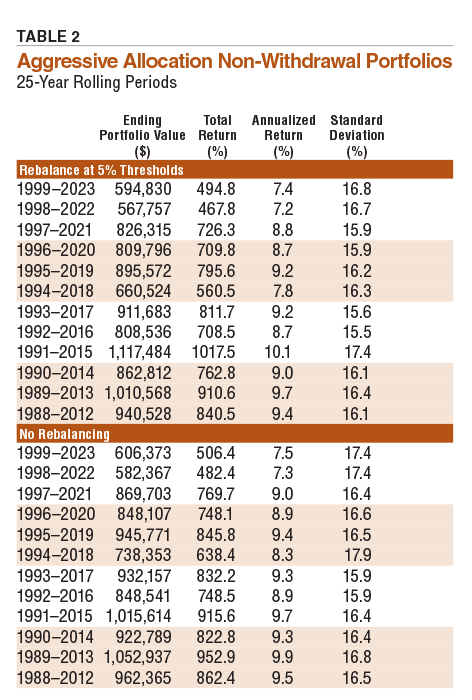
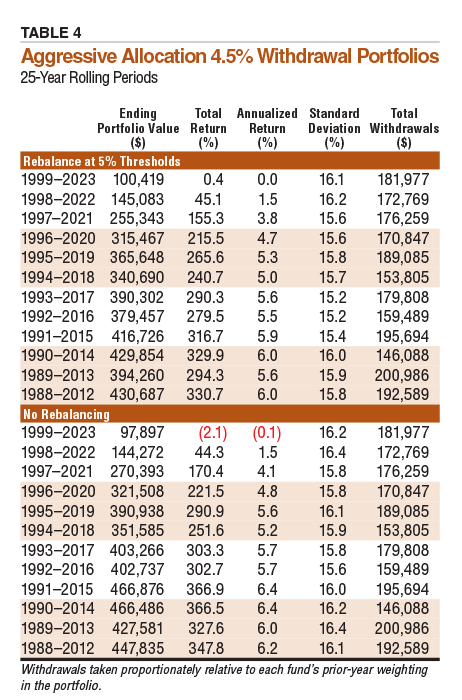
Sequence risk had a similar impact when the aggressive allocation was used. The difference in wealth between the non-rebalanced non-withdrawal portfolio ($606,373) and rebalanced non-withdrawal portfolio ($594,830) was less than 2% (Table 2).
Rebalancing Worked Better When Withdrawals Were Taken
The period of 1999–2023 was the toughest 25-year period for the withdrawal portfolios. The rebalanced withdrawal portfolio following the moderate allocation ended with a balance of $103,327, just slightly above its starting balance of $100,000. The non-rebalanced portfolio fared worse with an ending balance of $79,435 (Table 3).
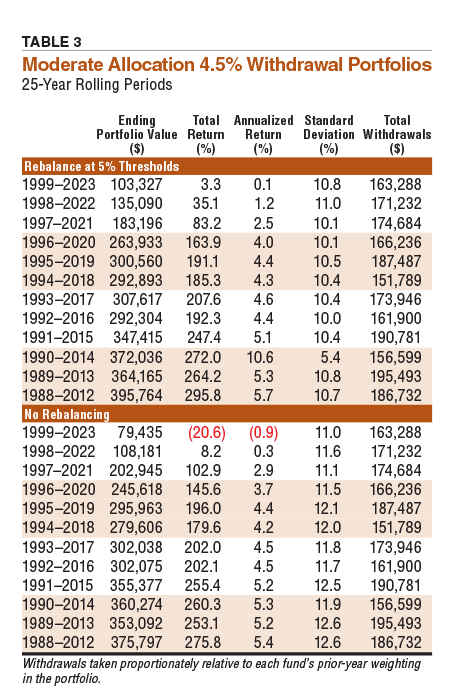
The difference in value between the two portfolios started in 2003. The rebalanced withdrawal portfolio was first rebalanced at the end of 2002. The equity allocation for both portfolios fell from their beginning target of 60% in 1999 to 48%. The rebalanced withdrawal portfolio shifted dollars back into stocks, enabling it to be better positioned to take advantage of the rebound in stock prices in 2003.
A similar thing happened at the end of 2008. The rebalanced withdrawal portfolio rebalanced its allocation back to target while the non-rebalanced portfolio did not. By the end of 2023, the rebalanced withdrawal portfolio was worth 30% more than its non-rebalanced counterpart.
For 10 out of the 12 rolling periods analyzed so far, the rebalanced withdrawal portfolios following the moderate (60%/40%) allocation have ended with larger balances than the non-rebalanced portfolios.
Rebalancing also helped the withdrawal portfolios following the aggressive (90%/10%) allocation. The rebalanced withdrawal portfolio ended the 1999–2023 period with a balance of $100,419. The non-rebalanced portfolio had an ending value of $97,897 (Table 4). Again, it was the timing of the bear markets and the adjustments made that helped the rebalanced portfolio.
Adjustments That Lessen Sequence Risk
There are a few adjustments retirees can make to limit the damage of sequence risk. The first is to periodically rebalance the portfolio. As noted, the rebalanced withdrawal portfolio following the moderate allocation ended 2023 with $103,327 after starting 25 years earlier with a balance of $100,000. During this time, $163,288 in cumulative withdrawals were taken.
Taking withdrawals proportionately based on each asset class group’s allocation helps whether or not rebalancing is used. When we adjusted the withdrawals to match each fund group’s allocation from the prior year, the non-rebalanced portfolio ended 2023 with a balance of $79,435, as previously noted. All its original fund holdings were maintained. This was not the case when we split the annual withdrawal amount evenly across all asset class groups—the strategy we used in previous rebalancing articles.
Flexibility can also be used when determining how much to withdraw each year. This works regardless of the allocation model chosen and whether or not rebalancing is used. It does require the financial flexibility to reduce withdrawals or hold them steady.
Finally, maintaining an allocation to buffer assets like cash can allow you to avoid selling stocks when their prices are down. This is the approach used by AAII’s Level3 withdrawal strategy. See the feature article in this issue for more on the benefits of maintaining a cash position in retirement.

Related

Related

Portfolio Strategies
Insights on Using the 4% Withdrawal Rule From Its Creator
Discussion
FREE REPORT

Get your free copy of our special
report analyzing the tech stocks
most likely to outperform the
market.
JOHN L from NJ posted over 2 years ago:
ROBERT A from NC posted over 2 years ago:
ROBERT A from NC posted over 2 years ago:
ROBERT A from NC posted over 2 years ago:
ROBERT A from NC posted over 2 years ago:
MATTHEW J from WI posted over 2 years ago:
JIM L from MI posted over 2 years ago:
GERALD P from IL posted over 2 years ago:
BARRY J from TX posted over 2 years ago:
JEAN H from IL posted over 2 years ago:
ROBERT A from NC posted over 2 years ago:
J M from NJ posted over 2 years ago:
LISANNE P from OR posted over 2 years ago:
BARRY J from TX posted almost 2 years ago:
You need to log in as a registered AAII user before commenting.
Log InCreate an account