

Related

Level3 Passive Portfolio
The Level3 withdrawal approach allows you to stay invested in assets that offer the greatest potential for long-term wealth growth while satisfying current funding needs with an allocation to short-term (defensive) assets.

The Level3 withdrawal approach allows you to stay invested in assets that offer the greatest potential for long-term wealth growth while satisfying current funding needs and minimizing real risk.
The book “Investing at Level3: Higher Returns With Minimal Risk for the Long-Term Individual Investor” summarizes many of the key investing concepts that James Cloonan observed since he founded the American Association of Individual Investors (AAII) over 40 years ago.
AAII was started with the belief that with the right education, information and discipline, individual investors are fully capable of becoming effective managers of their own assets. “Investing at Level3” lays out a practical framework suited for individuals that helps investors overcome short-term, emotional decisions that hurt long-term performance.
Individual investors have unique needs, opportunities and risks compared to the institutional (professional) investor. Cloonan notes that while individuals have the ability to get out from under the burdens that institutions must bear, the investment services industry has been able to convince individual investors to voluntarily accept and bear the same burdens as the institutions. These burdens include:
“Investing at Level3” explains how individuals can lift these burdens to maximize their long-term wealth.
The book gets its name from the range of approaches employed by investors:
Level 1 is unorganized investing driven by impulse and emotion. It is influenced by random observations and advice and is in a constant state of flux. Unfortunately, this is still the level of investing too many individual investors are at.
Level 2 represents the investing strategy that has evolved from modern portfolio theory. It assumes an efficient market with random events in which investors take rational actions to seek optimal outcomes from models based on statistical measures of return and risk. It has also been formulated without these models but maintaining academic measures of risk. Variations of this model are considered best practices by most investment advisers.
Level3 Investing is the strategy offered by Cloonan that looks to maximize long-term wealth that is specifically geared to the individual investor. It is reality-based rather than mathematically based in that return and risk are derived directly from actual historical data and common sense without attempting to force them into a mathematical distribution or model first.
Cloonan explains that each of the three investing levels are continuums with a range of approaches and theory within each level.
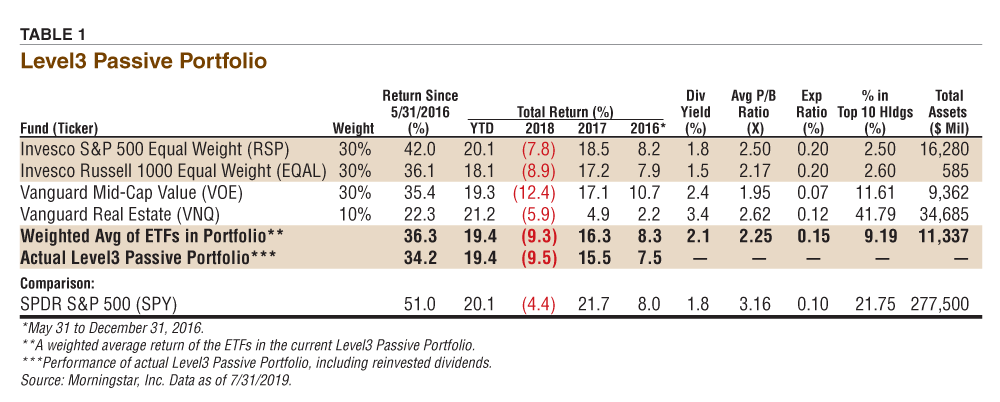
Cloonan envisioned the use of a Level3 Passive Portfolio as a complete equity portfolio for individual investors who wish to manage their own portfolio but do not have the desire to get involved in individual stock selection. It can be used as an equity portion of a whole portfolio for investors interested in selecting some individual stocks and actively managed funds, but with a desire to keep the majority of their portfolio in index funds. A Level3 Passive Portfolio composed of four exchange-traded funds (ETFs) has been tracked since June 2016. Table 1 provides the target weights, recent performance and basic characteristics of the ETFs in the portfolio.
The focus of this article is to present the withdrawal strategy detailed in the Level3 book that allows investors to stay invested in assets that offer the greatest potential for long-term wealth growth while satisfying current funding needs and minimizing real risk.
Cloonan notes that real risk is the chance of investment loss when the funds are needed, not day-to-day volatility.
It’s a mistake to tie short-term volatility to long-term investment risk and let it dictate our long-term investment decisions.
Cloonan’s formal definition of risk is the likelihood that when we must withdraw assets from our portfolio for consumption, they will have a lower value than we could reasonably expect based on our investment strategy.
Volatility is somewhat related to the chance of loss in the short term but has only a limited relationship to it in the long run.
Real risk is therefore the chance of underperformance, while volatility—or as Cloonan terms it “phantom risk”—describes how stock returns vary up and down through time. For short-horizon portfolios, volatility contributes to real risk. For long-horizon portfolios, volatility has a much-reduced role. Reducing short-term volatility tends to reduce our long-term expected return, thereby actually increasing our long-term real risk of not having enough financial assets for our needs. A classic example of this is consistently investing in both stocks and bonds in a long-horizon portfolio in an effort to reduce short-term volatility, with the likely result that you will underperform a 100% stock portfolio over the long term.
Cloonan argues that traders and investors with short-term time horizons trying to avoid market volatility help to push up the returns realized by investors with a long-term investment horizon. The fear index for traders becomes the opportunity index for long-term investors.
It is important not to panic at times of market distress. Selling during a bear market turns a paper loss into a real loss, especially when the market recovers and you are sitting on the sidelines. It helps to be a student of the market and understand that regular market drops are not only possible but likely. It’s likely that every investor will see two or three severe stock market collapses of 40% or more in their investing lifetime. Expecting them will make them easier to endure. Your comfort comes from the understanding that the market has always come back to reach new highs.
Investors need to be smart about market risk and avoid excessive leverage, moderately diversify their investments and time diversify new large investments. Cloonan recommends that investors consider spreading out their investment over 18 months if committing a relatively large investment when the market is within 5% of its high.
It is important to determine where to draw the line between short term and long term in terms of your investment strategy.
Cloonan makes a case for using four years as the length that divides short term from long term. Funds needed in four years or less should be treated as short-term funds and invested in defensive securities such as money market funds and Treasury bills. Funds not needed in the next four years are invested without regard to short-term volatility and are oriented toward maximum return over the long term.
Over the past 50 years, there have been two occasions (1973–1974 and 2007–2008) where the bear market was severe enough that the downturn (time to next stock market high) lasted over five years, using the S&P 500 index as the equity portion of the portfolio. However, if you examine the equal-weighted Wilshire 5000 index, the maximum bear market duration was four years. Protecting a portfolio for five years is not as cost-effective as four years, but Cloonan says that risk-sensitive individuals can use five years if it makes them more comfortable. More aggressive investors can use three years as the safe period.
Funds needed in the short term should be invested in assets safe from significant price volatility as well as safe from default. Cloonan points out that money market funds, short-term Treasuries or insured CDs are very good options.
The Level3 withdrawal strategy builds upon the idea that you should maximize your long-term wealth potential by being fully invested in stocks until you reach a point that you anticipate the need to withdraw funds for expenditures. The primary time that this will happen is at retirement when investors are now faced with short-term risk. While conventional wisdom has investors diversifying into a wide range of assets, Cloonan presents a compelling argument for establishing a short-term defensive allocation and keeping the remainder of your assets in stocks.
The major concern in Level3 when it comes to facing short-term risk is to find an operational definition of “short term” that balances the two bad things that can happen:
You lose capital in down markets if you are forced to sell your equities while the market is down and has not had sufficient time to recover.
Unfortunately, the risk of too low a return and the risk of loss are linked so both can’t be avoided. The superior long-term return of the equity market comes about as compensation for being exposed to volatile short-term market moves. The key is to find an approach that balances risk and return in a rational way. The approach of the Level3 withdrawal strategy is to reduce the need to draw upon your equity assets during a market downturn to fund your regularly anticipated short-term funding needs.
Beginning four years before your retirement date, estimate the annual dollar amount you will need to withdraw with a maximum of 5% of your portfolio and move that amount of assets into defensive investments.
Transfer the same amount in each of the next three years so that when you reach retirement you have four years of necessary portfolio withdrawals in short-term investments.
Cloonan recommends making allocation decisions generally only once a year. There may have to be exceptions to this if your requirements change significantly, but acting only once a year will simplify activity and record-keeping. Making a strategic process as simple as possible greatly increases the chances that it will be followed.
If you don’t retire at the exact end of a year, make a one-time adjustment so that your decisions are always near year end. This makes all kinds of market data easily available and, more importantly, gives you a chance to act just before or just after the calendar year based on income tax considerations.
At decision day each year (January 1), check the level of the S&P 500 at that time and compare it to the all-time highest level of the S&P 500. If the current level is more than 5% below the all-time high of the S&P 500, put your portfolio in defensive mode. Your withdrawal in the year you determine as a down year will be taken from the safe investment part of your portfolio.
Cloonan notes that using 5% is arbitrary. You could use 1%, 10% or even 20%, which is the usual definition of a bear market. The higher the criteria, the less activity there will be. It’s your choice but pick one and stick to it. Consistency will reduce the chance of mistakes coming from behavioral pressures.
Continue withdrawing from the safe portion each year until on a decision day the S&P 500 is above the level that you used to choose defensive mode. At this point, you not only resume annual withdrawals from the equity holdings of your portfolio, but you immediately begin to restore the four-year withdrawal level to the safe investment segment. Cloonan recommends doing this over two years, restoring half of the deficit (the amount below four years of withdrawal) each year. Any restoration would stop if a new down year occurred and withdrawals would revert to the safe portion.
If the defensive mode lasts long enough that the safe investment part of the portfolio is depleted, you would have to withdraw from the equity part, but Cloonan’s research indicates that this has not happened since the stock market crash of 1929.
If a down market occurs at decision time while you are in the process of building the safe investment portion of the portfolio (one to four years before retirement), don’t put the one-year withdrawal amount into the safe investment portion of the portfolio until your definition of the end of defensive mode applies. If the down market continues into the actual withdrawal period, withdraw from any safe assets until they are used up and then sell equities. Build the safe investment portion up again after the market recovers.
There are choices in determining how to measure market highs. The market could be measured by a number of indexes or by your own portfolio. Cloonan selected the S&P 500 because it is generally accepted as the primary market measure. The performance of the S&P 500 is used to represent the weighted average of all portfolios. This is not quite true since there are considerably more than 500 stocks, but the totality of all the remaining stocks is minuscule compared to the 500. In addition, data on the S&P 500 is readily available.
Since we are much more concerned with our own portfolio than with the overall market, why not use your own portfolio as the market indicator? You could, but this involves extensive record-keeping and you would have to make adjustments for withdrawals and additions. Rule simplicity avoids rule violation.
An additional problem involves assigning market highs. We can use intraday levels, closing daily levels or closing levels of the week, month or even year. Cloonan feels that looking at the market only once a year would likely be the wisest thing any of us could do, but in the real world it is unrealistic to think that the vast majority of investors can ignore market behavior in the short run.
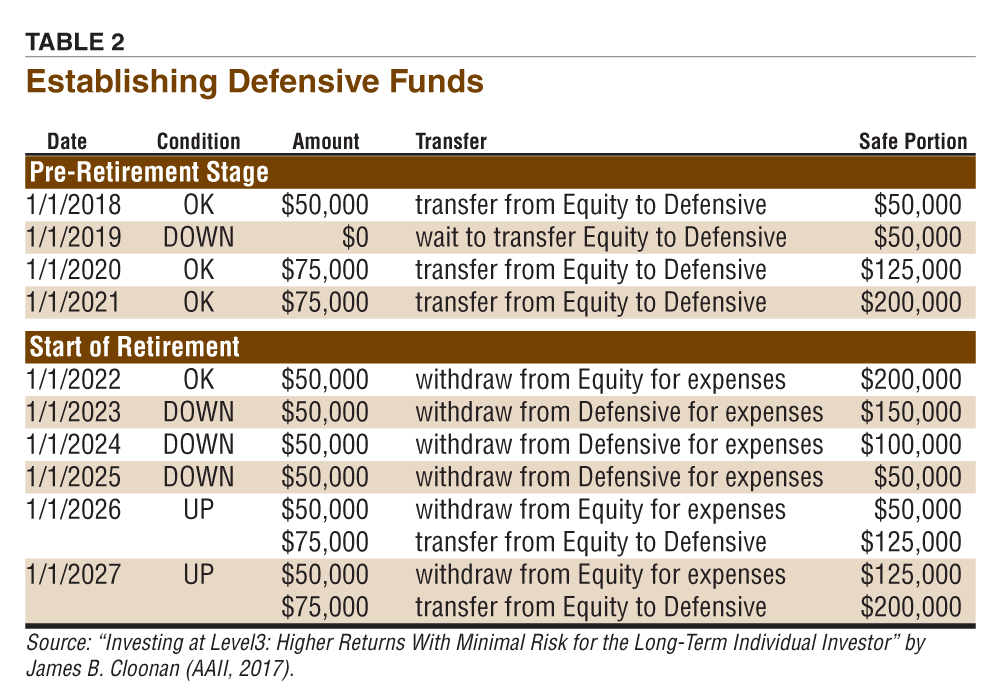
Table 2 illustrates the process of moving into retirement mode and building up a defensive position of $200,000.
As you can see, based on a retirement date of January 1, 2022, the process of shifting money into the defensive portion of the portfolio at one year’s withdrawal rate begins during the four years prior to retirement. Withdrawals are made from the equity portion of the portfolio while the market is in a flat or up mode. However, since the market was off more than 5% from its high at the end of 2018, we hold off selling our equity position to fund the defensive portion that year. Assuming that the market is back to within its 5% high at the end of 2019, we would sell and transfer the annual $50,000 withdrawal along with half the shortfall of the defensive fund (an additional $25,000). If the market is up again the next year, we would finish our funding of the defensive position.
At the start of retirement, withdrawals are made from the equity portion of the portfolio while the market is in a flat or up mode. When on January 1, 2023, the market is 5% below its previous all-time high, we switch to defensive mode. Annual withdrawals are taken from the safe portion of the portfolio until the market returns to within 5% of its previous high. At that time, annual withdrawals once again are taken from the equity portion of the portfolio. Any deficit is restored to the safe portfolio in annual transfers spaced equally over a two-year period.
The key to the strategy is to use your rainy-days fund when it rains. As stated, if the market has not fully recovered in four years then the safe funds may have run out and you may have to liquidate some stock. But this scenario would not have occurred in the last 50 years using the strategies employed by Level3 investors.
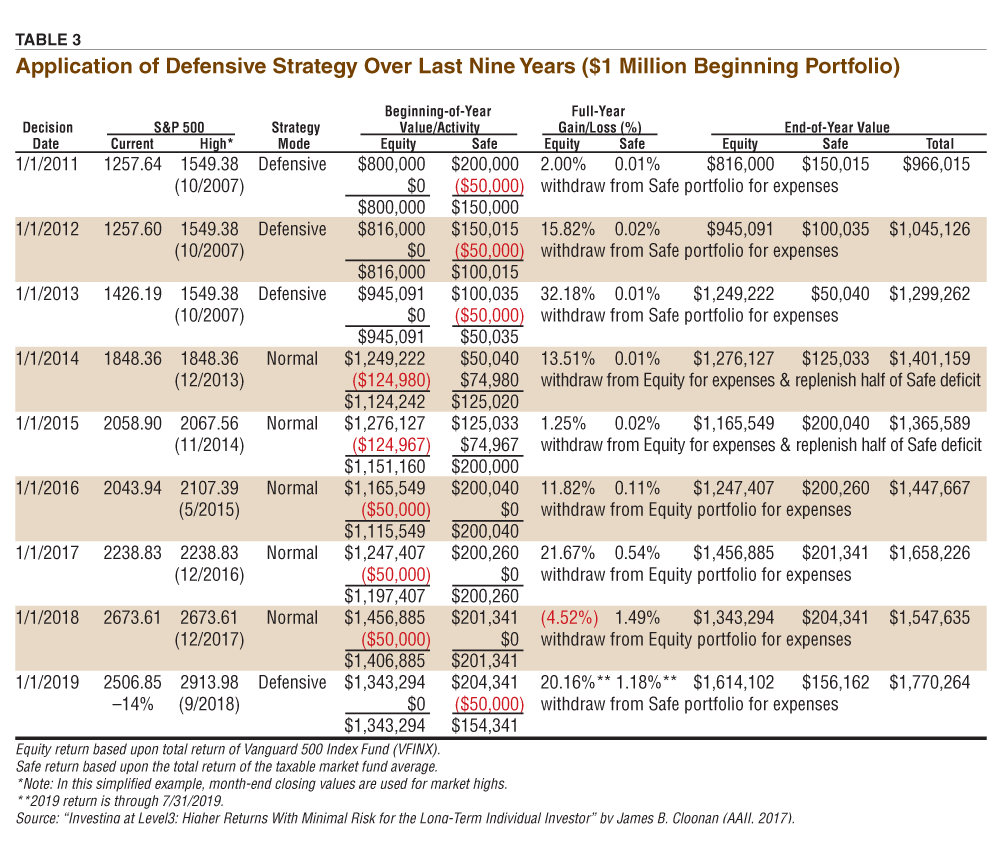
Table 3 traces the Level3 defensive strategy over the last nine years assuming a million-dollar portfolio, a $50,000 annual withdrawal rate and fully funded defensive position at the start of the example. Actual S&P 500 returns are used rather than the advanced or passive Level3 portfolio strategies to illustrate how the defensive approach would have worked during that time. The average money-market rate is used as the return on the defensive investment portion of the portfolio, which could be a blend of short-term Treasuries and other very safe investments.
The impact of inflation is ignored on the $50,000 annual withdrawal in order to simplify the example; inflation was not very significant over this period and would not have impacted any decisions.
It is important to note that the withdrawal amount is in dollars, not in percentage of the portfolio. If the market drops 10%, your mortgage payment doesn’t. You would still need $50,000 a year, even though that is now 5.56% rather than 5% of your portfolio.
In this example, the market starts in defensive mode (current market level more than 5% below the prior market high on decision day) until the end of 2013. This is allowing the equity portion to recover in value. On January 1, 2014, the year-end market value actually hit a new month-end closing high and the strategy reverts to normal mode, taking the $50,000 withdrawal from the equity part of the portfolio along with restoring half ($74,980) of the existing shortfall in the defensive portion.
The market continues being within 5% of successive month-end market highs until the end of 2018, when the year-end close is 14% below its September 2018 month-end high of 2913.98. The last year of the example switches back to the defensive mode and the $50,000 annual withdrawal is taken from the defensive portion of the portfolio while the equity portion is allowed to recover from its unrealized loss.
The very specific defensive approach illustrated in the Level3 example was taken for two reasons:
First, if you have a very specific approach with defined rules, it is easier to avoid deviating randomly and substituting guesses about market direction at various points in time. Certainly, withdrawing a full year’s needs at one time or acting only on the first of the year is not a requirement for the Level3 defensive approach.
Second, a specific version of the Level3 approach was needed to illustrate its application. Different variations of the general approach will give different results, depending on the actual market behavior over time.
Level3 Passive Portfolio

Portfolio Strategies

Portfolio Strategies

Chris from CA posted over 7 years ago:
Ron from OH posted over 7 years ago:
Richard Shaw from AZ posted over 7 years ago:
Brian from NY posted over 7 years ago:
Martin from CA posted over 7 years ago:
Andrew from TX posted over 7 years ago:
Greg from TX posted over 7 years ago:
Herbert Schechter from Minnesota posted over 7 years ago:
Max from VA posted over 7 years ago:
Fitz from CT posted over 7 years ago:
Ann from CA posted over 7 years ago:
Mike from FL posted over 7 years ago:
Nick from NY posted over 7 years ago:
Allen from OH posted over 7 years ago:
DAN M from IL posted over 4 years ago:
You need to log in as a registered AAII user before commenting.
Log InCreate an account