



Portfolios are as varied as the people assembling them, so it’s challenging to “study” all the possibilities. Nevertheless, we can study “representative” portfolios to get a sense of how they behave over time. Toward that end, I’ve built six different portfolio models ranging from 100% stocks to 100% bonds. And to make things more interesting I’ve built a Vanguard version, a T. Rowe Price version and a “variety pack” version.
A 60% equity/40% fixed-income portfolio is highlighted in Table 1.
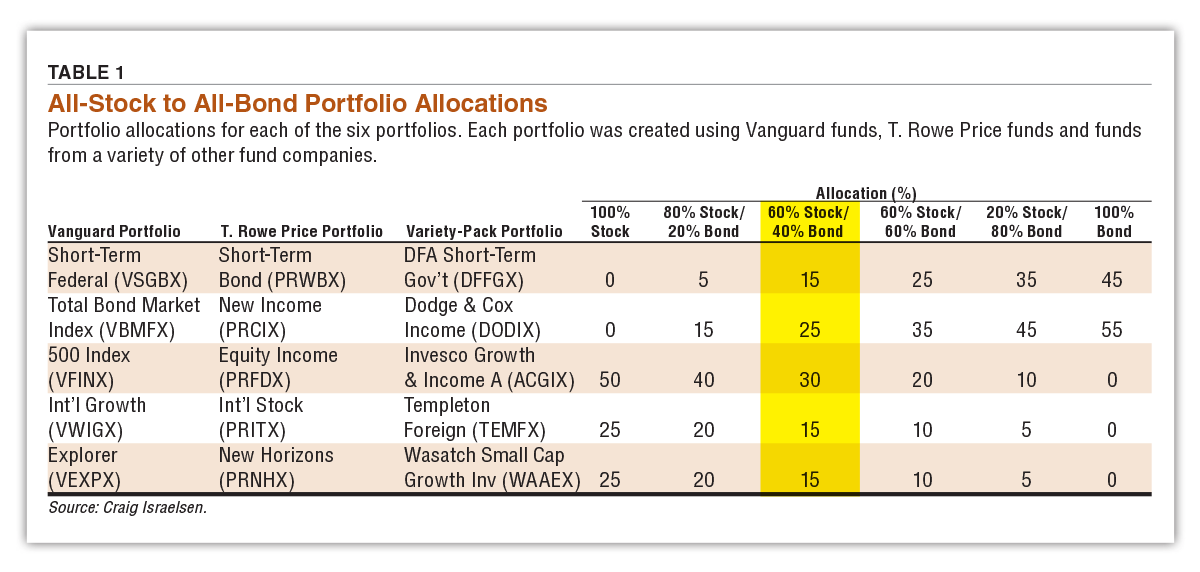
The Vanguard version of the 60%/40% model has a 15% allocation to the Vanguard Short-Term Federal fund  (VSGBX), a 25% allocation to the Vanguard Total Bond Market Index fund (VBMFX), a 30% allocation to the Vanguard 500 Index fund (VFINX), a 15% allocation to the Vanguard International Growth fund (VWIGX) and a 15% allocation to the Vanguard Explorer fund (VEXPX). The allocations to each fund are maintained by monthly rebalancing (not recommended in actual practice but was necessary in this particular analysis).
The 60%/40% T. Rowe Price model has the following allocations: 15% to the T. Rowe Price Short-Term Bond fund (PRWBX), 25% to the T. Rowe Price New Income fund (PRCIX), 30% to the T. Rowe Price Equity Income fund (PRFDX), 15% to the T. Rowe Price International Stock fund (PRITX) and 15% to the T. Rowe Price New Horizons fund (PRNHX). Finally, the variety-pack portfolio utilizes funds from Dimensional Fund Advisors (DFA), Dodge & Cox, Invesco, Templeton and Wasatch Global Investors to build the six different portfolios ranging from all-stock to all-bond.
Portfolio Returns and Volatility
Let’s now examine how these various portfolios performed over the past 32 years (January 1990 to December 2021) as shown in Table 2.
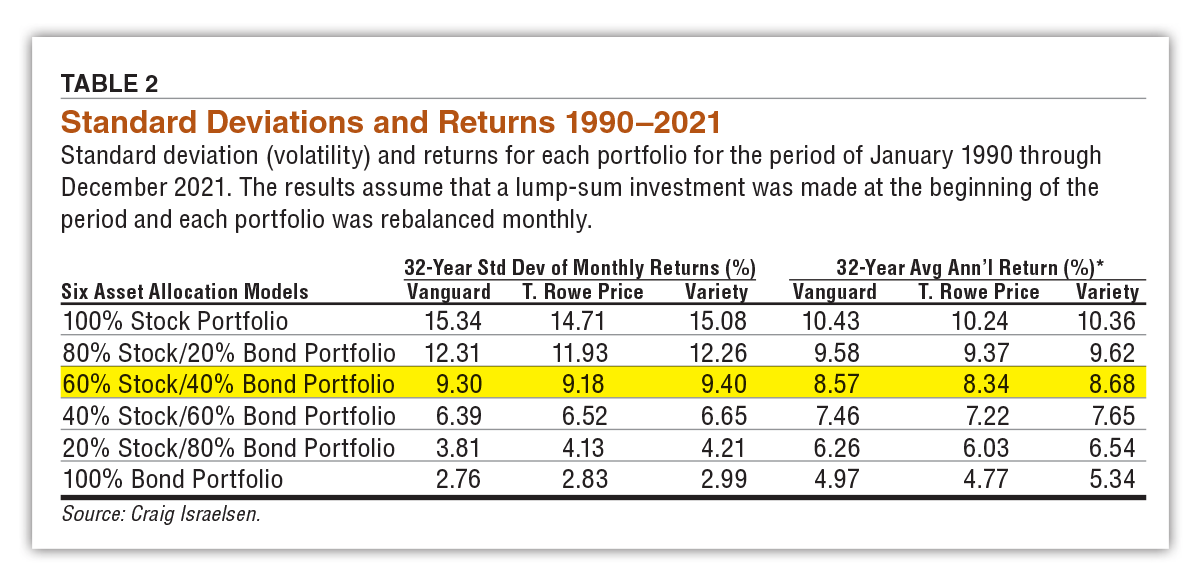
We begin with the 100% equity portfolios. If using the three Vanguard funds shown in Table 1, the 32-year annualized standard deviation of monthly returns was 15.34% and the 32-year annualized return was 10.43%. If using T. Rowe Price funds, the 32-year standard deviation was 14.71% and the 32-year return was 10.24%. The variety-pack portfolio had a standard deviation of 15.08% and a return of 10.36%. The volatility (as measured by standard deviation) and the return of each 100% equity portfolio was remarkably similar between the Vanguard, T. Rowe Price and variety-pack models. Key observation here: Asset allocation is the primary driver of portfolio behavior, not where we buy the funds from.
Consider an 80% equity/20% fixed-income portfolio. The Vanguard version had a 12.31% standard deviation and a 9.58% average annualized return over the past 32 years. The T. Rowe Price model’s standard deviation was 11.93% with a return of 9.37%. The variety pack had a standard deviation of 12.26% and a return of 9.62%. Same observation: strikingly similar levels of volatility and return over a 32-year period. In fact, we see the same pattern in all six asset allocation models—the volatility and performance among the Vanguard, T. Rowe Price and variety-pack models are nearly in lockstep.
There is another key observation in Table 2 that nearly jumps off the page: The differences in standard deviation (aka “risk” or “volatility”) among the various allocations are far greater than the differences in returns. For example, the 100% equity portfolios have a standard deviation of roughly 15% and the 100% fixed-income portfolios have a standard deviation of approximately 3%. That is a 5x difference.
Now, look at performance. The 100% equity portfolios have a return of roughly 10.3% and the 100% bond portfolios generated an annualized return of roughly 5%. That’s basically a 2x difference. In other words, the asset allocation we choose to employ has more potential impact on volatility than it does on performance. Said differently, we have more control over volatility (by our chosen asset allocation) than we do over performance.
Here’s another way to think about this: Over the past 32 years, if we moved from an all-bond to an all-stock portfolio our performance basically doubled, but our volatility increased by a factor of five. We do have to remember that between 1982 and 2021, interest rates were generally in decline. The drop in interest rates was a real boon to U.S. bond funds. Going forward, bonds may not do as well. This could cause the performance gap between an all-bond and an all-stock portfolio to increase in the future.
The Stability of Volatility
Figure 1 shows a rolling 36-month standard deviation and rolling 36-month returns of the Vanguard 60%/40% asset allocation model. The standard deviation is shown by the blue line and the returns are shown by the orange line. Which one is more volatile over rolling 36-month time frames? Rolling returns are far more volatile than standard deviation.

Rather ironic, isn’t it? Standard deviation over rolling 36-month periods tends to operate in a smaller “bandwidth” of roughly 5% to 15%. This is the case because standard deviation of return can never be negative, whereas performance can be negative (as shown by the 2000–2002 and 2006–2008 time frames). By comparison, rolling 36-month returns ranged from –8% to +19%.
What is the implication of this observation? I would propose that portfolios be built to achieve a given level of volatility. (The results in Table 2 provide a starting point for expected levels of volatility and performance for various asset allocation models.) Your expected volatility and your actual experienced volatility will be much closer than your expected return and your experienced return—particularly over short time frames such as three years or less. Even though investing is a long-term commitment (i.e., 20 years or more), most of us check our portfolios far more often than that, so volatility and performance over shorter time periods do matter.
As investors, if we focus on the volatility of our portfolio, it likely won’t shock us in any given three-year period. Portfolio volatility is fairly consistent over time. Alternatively, if we focus solely on performance, there will be three-year periods where returns and our portfolio balance will be far from our expectations—and that can be a bit shocking.
Thus, focusing on the volatility of our portfolio will give us a more reliable measure of how our portfolio is actually behaving—and how volatile it isn’t.

Related

PRISM Wealth-Building Process
How Much Risk Can You Handle and Still Meet Your Goals?
Related

Portfolio Strategies
Clarifying the Purpose of Diversification
Discussion
FREE REPORT

Get your free copy of our special
report analyzing the tech stocks
most likely to outperform the
market.
BARRY J from TX posted over 4 years ago:
ROBERT A from NC posted over 4 years ago:
GREGORY T from WI posted over 3 years ago:
RICHARD H from IL posted over 3 years ago:
BARRY J from TX posted over 2 years ago:
You need to log in as a registered AAII user before commenting.
Log InCreate an account