
Clarifying the Purpose of Diversification

Broad, multi-asset-class diversification allows us to produce an equity-like return while substantially reducing the volatility of returns in the portfolio.

Diversification is for folks who don’t know the future—which is all of us. Think of it this way, if you knew the future perfectly, would you ever diversify your portfolio? Of course not. You would simply pick the single ticker that was destined to produce the highest return. End of story.

So, for the rest of us who don’t own a crystal ball … we diversify. Why? Precisely because we do not know the future. In this article, I examine a variety of asset allocation “recipes” that range from non-diversified to very diversified and how they performed over the past 49 years (from January 1, 1970, to December 31, 2018) both in accumulation mode (pre-retirement) and distribution mode (during retirement). The “purpose” of diversification will become clear.

Allocation Recipes

The first recipe is 100% cash (see Table 1). Having all of one’s investment dollars in a certificate of deposit (CD) or savings account would represent a portfolio of 100% cash. As cash is only one asset class, it does not represent a diversified asset allocation model (which implies at least two asset classes). However, as many investors often hide out in cash when they are afraid of the equities markets or worried about bonds, it’s worth examining the performance of cash over the past 49 years.
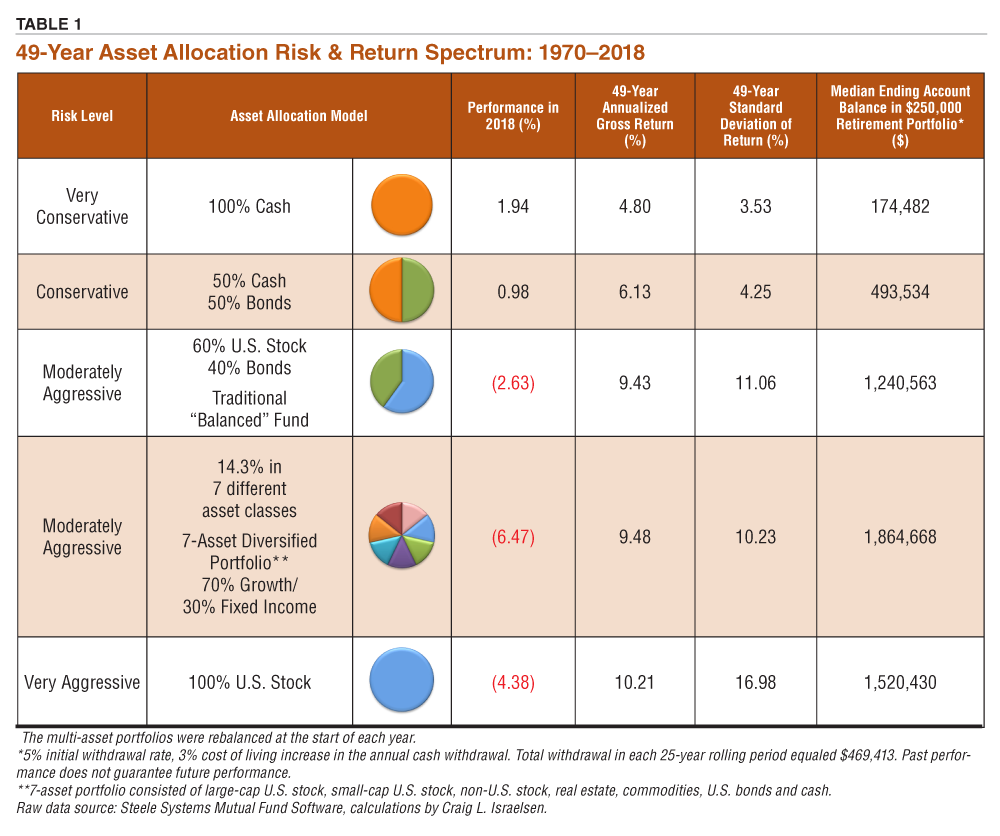
As can be seen, cash produced a return of 1.94% in calendar year 2018—the best return of the group in Table 1. The 49-year average annualized return of a 100% cash investment was 4.80% (accumulation mode performance) with a standard deviation of annual returns of 3.53%. It’s important to recognize that Table 1 is showing nominal returns that have not been adjusted for the impact of inflation (as measured by the consumer price index).

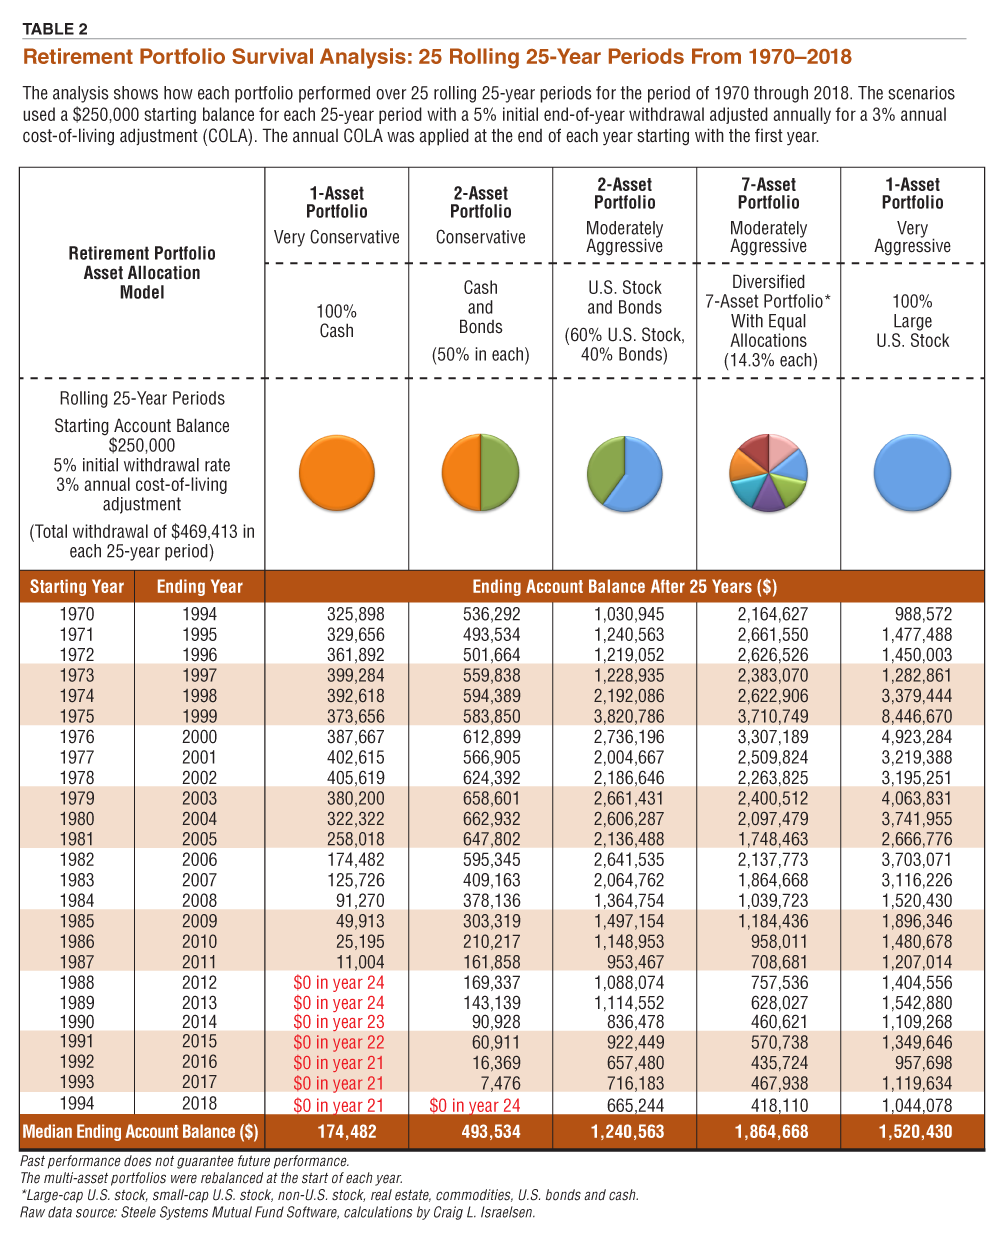
The last column in Table 1 shows the median ending account balance of a retirement portfolio. For an all-cash portfolio, the median ending account balance was $174,482 (distribution mode performance). The median ending account balance was calculated over 25 rolling 25-year periods between 1970 and 2018, where the starting balance was assumed to be $250,000 and a 5% initial withdrawal rate was followed by 3% cost-of-living increases in the subsequent annual cash withdrawals over the next 24 years. The total withdrawal in each 25-year rolling period equaled $469,413. (See Table 2 for the results of each 25-year period).

We now move down the asset allocation food chain to a 50% cash/50% bond portfolio. This 50/50 portfolio represents actual asset allocation (that is, we are using a “recipe” that calls for more than one asset class), albeit a very conservative model. The return of a 50% cash/50% bond portfolio in 2018 was 0.98%. The 49-year annualized return of a 50/50 portfolio was 6.13% and the median ending account balance after 25 years for the retirement portfolio was $493,534.

The next asset allocation model is a 60% large-cap U.S. stock, 40% U.S. bond portfolio that is typically referred to as a “balanced fund.” The 60/40 portfolio lost 2.63% in 2018, whereas the 49-year annualized performance was an impressive 9.43%. The 49-year standard deviation of annual returns was 11.06%. When any type of equity ingredient is added to a fixed-income portfolio, the standard deviation will increase—often substantially. The 60/40 portfolio was rebalanced annually, as was the 50% cash/50% bond portfolio. The median ending account balance in a retirement portfolio that was sustaining annual withdrawals was $1.24 million.

This outcome is quite remarkable in light of the fact that the retirement portfolio began each 25-year period with a starting balance of $250,000.

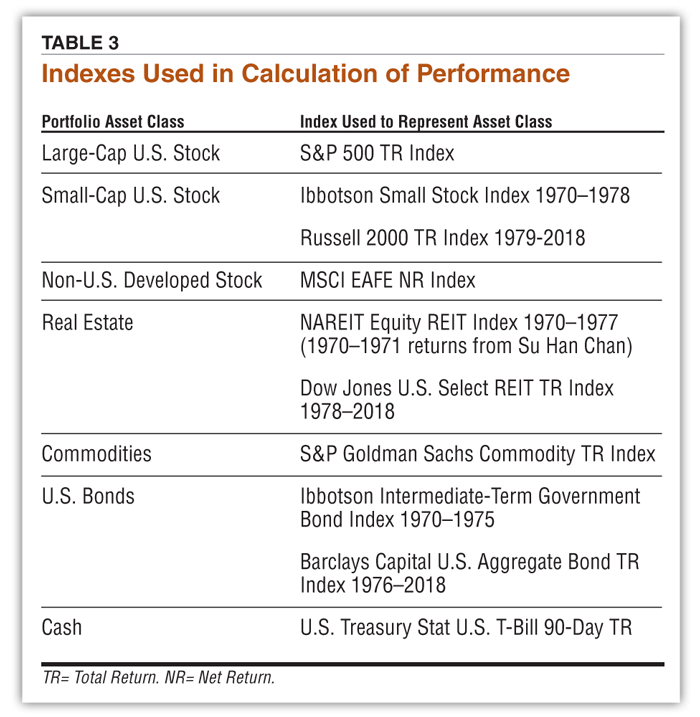
Next, we examine a multi-asset portfolio that included seven different asset classes in equal portions (14.29% each) that was rebalanced annually. The asset classes included large-cap U.S. stock, small-cap U.S. stock, non-U.S. developed stock, real estate, commodities, U.S. bonds and cash. The indexes utilized to represent these asset classes are shown in Table 3.

The seven-asset portfolio lost nearly 6.5% in 2018—only its seventh annual loss over the past 49 years. More indicative is its 49-year average annualized nominal return of 9.48% with a standard deviation of annual returns of 10.23%—slightly better performance with less volatility than the standard 60/40 stock-bond asset allocation model. The median ending balance over 25 rolling 25-year withdrawal periods was $1.86 million—over $620,000 more than the standard 60/40 model.

Finally, we examine a 100% stock model. As with the 100% cash model, this does not represent an asset allocation model (or recipe) because it only includes one asset class. But, as large-cap U.S. stock is a very prominent asset class, it is reviewed here. Large-cap U.S. stock (S&P 500 index) lost 4.38% in 2018. However, the 49-year average annualized return was an impressive 10.21% with a standard deviation of 16.98%. The median ending retirement account balance was just over $1.5 million—roughly $344,000 below the seven-asset portfolio.

Multi-Asset Is the Answer

What are the advantages of building a diversified multi-asset portfolio? Compared to a 60/40 portfolio, a seven-asset equally weighted portfolio produced a five-basis-point (0.05%) higher return over this 49-year period with nearly a 7.5% decrease in volatility. Even more importantly, the seven-asset model outperformed the 60/40 model as a retirement portfolio.

Compared to a 100% large-cap U.S. stock investment, a seven-asset portfolio had a 49-year average annualized real return that was lower by 73 basis points (0.73%), but as compensation had a standard deviation of return that was lower by 40%. Moreover, the seven-asset recipe produced better results during the retirement “distribution phase.”

Retirement Is a Time to Stay Diversified

The analysis of retirement portfolio survival in this article used an initial withdrawal rate of 5%.

This particular rate was used for illustrative purposes and is not a suggested or recommended initial withdrawal rate for any particular retiree. An appropriate withdrawal rate is determined individually after considering a number of factors, including the amount of money in your retirement account, your age, needed income each year, anticipated number of years withdrawals may take place, anticipated annual rate of return of portfolio, anticipated general inflation rate in the overall economy, cost-of-living adjustments—aka, COLA—being imposed, etc.
Portfolio diversification should be a lifelong strategy—both before retirement as well as during retirement. Warning: Diversification is not exciting. That’s by design. Broad diversification tends to smooth out returns, which is crucially important when you start withdrawing money from a portfolio—such as in retirement. Why is it so crucial? Because the sequence-of-returns matters a great deal when money is being withdrawn from a portfolio. The scenario a retiree wants to avoid is one in which their portfolio suffers several annual losses just as they start pulling money out at the start of retirement. This would be a potentially disastrous sequence-of-returns risk that could materially reduce the longevity of their retirement portfolio. Broad diversification does not eliminate sequence-of-returns risk, but it does significantly reduce it. And, for that reason, diversification should be a central tenet in a retiree’s investment philosophy.

So, what is the purpose of diversification? Broad, multi-asset class diversification allows us to produce an equity-like return while substantially reducing the volatility of returns in the portfolio.

Diversified Asset Allocation Is Not Expensive

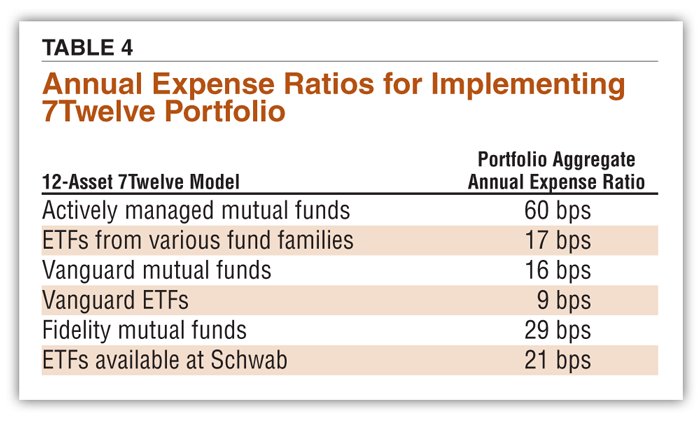
Building a multi-asset portfolio need not be expensive. To illustrate this, I have shown in Table 4 the aggregate expense ratio of a 12-asset class model known as the 7Twelve Portfolio (disclosure: I am the designer of the 7Twelve Portfolio). If using actively managed mutual funds from various fund families, the multi-asset portfolio can be built for 60 basis points (0.60%). If using exchange-traded funds (ETFs), it can be built for 17 basis points (0.17%) If using only Vanguard ETFs, the 12-asset class 7Twelve portfolio aggregate cost can be as low as nine basis points (0.09%).

Discussion

Mike from WA posted over 6 years ago:

The math doesn't seem to make sense in this article. For example, Table 2 states that the 7-asset median ending balance was about $300,000 more than the US large cap, yet it only exceeded the US large cap the first 4 years, then the US large cap exceeded the 7-asset in each succeeding year. This article needs a little proof-reading before publishing. I'd like to see a similar comparison for a 3-asset class, US large caps, US small caps, and US REITs.


Michael E. Ellis from IL posted over 6 years ago:

Might not the sequence of returns account for the difference in ending balance between the 7-asset portfolio and the US large cap portfolio ?


Chris from CA posted over 6 years ago:

I agree with previous poster. I'd like to see this approach compared to other allocations that are not just the 60/40 SP500 and total bond fund. It seems unnecessarily complicated. I know the author has secondary motives for promoting his portfolio which makes it all the more important that he provide data supporting his approach over some of the simpler "lazy"-type portfolios.


Mike from CA posted over 6 years ago:

I question using the median result as a figure of merit. High balances are great but low balances start a person considering how living in a cardboard box might feel. By that logic, looking at the low tail of the distribution seems more relevant. Hence, looking at Table 2, I would rank the 100% Large US Stock strategy as the winner. FWIW...


Miike from WA posted over 6 years ago:

I averaged (mean) the columns of table 2 for 7-way and S&P500 and came up with $1.7M for the 7-way and $2.4M for the S&P500 means. Maybe I fat-fingered the numbers into the calculator. Author appears to be having problems with his spread sheet or the numbers in the columns are not correct. Commodities and cash tend to track the inflation rate over long periods of time and bonds do just slightly better. In theory, a US Large Cap, Small Cap, and REIT allocation should give similar, if not better, long term returns as the S&P500 with significantly less volatility.


steve from me posted over 6 years ago:

Please clarify: does return data assume all stock dividends and all bond interest reinvested? Notes do not confirm this. Likewise, Do "withdrawals" include dividends, capital gains AND bond interest not reinvested?


Paul from NY posted over 6 years ago:

@Mike from WA: I think you're misinterpreting Table 2. Is it not showing accumulated returns year-over-year; it's showing rolling 25 year returns beginning in the year indicated. In other words, if you had invested $250K in the 7-asset portfolio, then 25 years later (1994) you would have had $2,164,627. The numbers at the bottom are the "median ending account balance", meaning half the starting years performed worse and half the starting years performed better (for each individual portfolio). You on the other hand appear to have calculated the "average", which is not the same as "median". I plugged the numbers in the table into Excel and the author's calculations are correct (at least for the 7-asset portfolio which is the only one I checked).


Paul from NY posted over 6 years ago:

@Michael E. Ellis: If both the 7-asset and 100% large cap portfolios were calculated for the same set of rolling 25-year time frames, then sequence of returns would have very little impact on the overall findings since the author looked at 25 different 25-year rolling periods. You can see that the 100% large cap portfolio did indeed outperform the 7-asset portfolio in several of the 25-year rolling periods (specifically all periods starting on or after 1974). Remarkably, even though the 100% large cap portfolio outperformed the 7-asset portfolio in 21 of the 25 rolling 25-year periods, it still had a median performance that was $344K LOWER than the 7-asset portfolio. This is because it had several very poorly performing 25-year periods (1970-1973). It should be noted that AVERAGE for the 100% large cap portfolio over all 25 periods was $2,411,481. So it all depends on what's more important to you: median performance, or average performance?


jeff from connecticut posted over 6 years ago:

A good chunk of these returns include a 20 year bull market. I'm 72 and don't think I'll have a 25 year time horizon. What about a 20 year horizon beginning in 1998 and then running into the 2000-2003 internet bubble and the 2008 sub prime loan debacle? I do believe he's using a 5% withdrawal rate which is more than most professionals recommend.


Michael E. Ellis from IL posted over 6 years ago:

This is in response to Mike from CA questioning whether median returns should be preferred to average returns in evaluating investment strategies. The median figure is much more indicative of what the typical investor will make utilizing the strategy in question than the average is. Of course it depends on the underlying distribution in that the more the distribution resembles a Normal (Gaussian) bell shaped distribution the more likely the average is to be a reliable indicator. For instance for professional golfers the most recent information shows that the average PGA golfer makes $2,232,000 a year but the median PGA golfer makes only $628,000 a year which 75% less than the average https://careertrend.com/average-salary-professional-golfer-33585.html so it is pretty clear that in this case that the median is much more indicative of what the typical PGA golfer makes than the average is. Obviously making a career choice as a professional golfer examining the median income rather than the average income helps one make a better choice. I suspect this is also the case for investors though it is much more difficult to find median figures than average figures.


Bill from MD posted over 6 years ago:

I realize my question is off-topic for the purpose of the article, but can anyone tell me why the Ending Account Balances decrease fairly steadily from starting year 1970 to starting year 1994? I plugged the 7-asset and 2-asset conservative numbers into Excel, graphed the data, and added a linear trend line. The 7-asset linear trend line decreases at over $120k/yr.


Dave G from WA posted over 6 years ago:

I call this article Fooled by the Median. These comments are based on an analysis of the 7 asset Portfolio compared to the 100% S&P 500 Stock Portfolio. Of course, we all should know the median is the midpoint of a distribution, but it doesn’t tell us anything about the numbers on either side. Also, the Standard Deviation tells us how much the numbers moved around, but neither of these numbers tells us which distribution would leave us with more money. I submit we would be happier with the distribution that gives us a better chance of ending up with more money. For that, we can look at how many times in 25 starts one path won out over the other. That number is easy to find as the 1 asset Portfolio won out in 21 of 25 starts. Next, you might want to know which Portfolio won or lost in a big way to the other. Once again a quick glance at the list shows the 1 asset Portfolio had greater than 100% more money in 7 starting years and the 7 asset Portfolio had greater than 100% more money in only one year. One more final test is available for a group of 50 people who want to donate what is left in their portfolio after 25 years to charity. 25 people start one per year, for 25 years from 1970 and invest in the 7 asset Portfolio and put what is left of their money into charity A at the end of the 25 year period. Charity A receives roughly $42 million. Another 25 do the same thing investing in only the S&P 500 index. Their Charity B receives roughly $60 million. Clearly, over the 25 starting years in the study, the winner of these two is the single asset index fund. The above is based on the author’s numbers in table 2.


Gregory M Shea from FL posted over 6 years ago:

In my opinion the case for the diversified portfolio is not supported by the author's data. Keeping it simple, the 60/40 portfolio beat the 7 asset 68% of the time (17 of 25) and the 1 asset beat the 7 asset 84% of the time (21 of 25). In dollar terms, the diverse 7 lagged the 60/40 by 7% and the Large Cap by 66%. I'm not sure I understand the meaning of the dollar figures since I simply calculated the (signed) difference between the year end and vales and summed them. The question I tried to answer was "Were the gains in the good years offset by losses in the bad years". The answer, it seems to me is: "Yes, later losses wiped out the early gains, by a huge margin in the case of the single asset portfolio". I'm a believer in diversification but the data, in this case, does not support the premise. I think the author's diversification choices sank his argument. He needs to find an allocation mix that supports his argument. His work clearly illustrates that diversification for diversification's sake is sub-optimal. If you want to trade yield for reduced volatility, that is another matter but yield was the principal thrust of the work. Unfortunately, or as usual, the devil is in the details.


Tom L from CA posted over 6 years ago:

I enjoyed the article so I purchased the book. In Chapter 13, Dr. Israelsen has data that shows that the "equity premium" does not exist for the period 1970-2009 as it was reduced to 1.54% compared to 6.82% for the period 1926-1969. I looked at the period 1980-2018 and found that the equity premium was 4.92%. Is the equity premium back?


Jerry Bauer from Illinois posted over 6 years ago:

The author shows only large and small cap categories for this model. Where would mid caps fit into the 7 asset class portfolio? The author does break out large, mid, and small in his 12 asset class portfolio.


You need to log in as a registered AAII user before commenting.
Create an account

Log In

Get your free copy of our special report analyzing the tech stocks most likely to outperform the market.

Download the FREE Report Here:

