Navigating Market Cycles With Shiller’s CAPE Ratio

The CAPE ratio empowers long-term investors to navigate volatile markets, forecast returns and make smarter decisions grounded in historical valuation trends.

Wayne Thorp leads a class in AAII's new Essential Investing Video Course. Go to https://www.aaii.com/ves for more information and to subscribe.

  • An introduction to the CAPE ratio as a long-term market valuation tool for rational investing during volatile times
  • Why the CAPE ratio improves on traditional price-earnings (P/E) ratios and how its variants adapt to modern market conditions
  • Ways investors can use the CAPE ratio’s predictive power for long-term returns and strategic planning

The stock market has recently felt like an emotional roller coaster: optimism during bull runs, anxiety during market corrections and despair during crashes. This volatility creates a persistent challenge for individual investors: How do you make rational investing decisions when markets seem increasingly irrational?

This is where Robert Shiller’s cyclically adjusted price-earnings (CAPE) ratio enters the conversation. Unlike many trendy market indicators that come and go, the CAPE ratio has stood the test of time, providing investors with a compass to navigate market cycles over the past century.

The CAPE ratio provides historical context spanning multiple economic eras. This article explores how individual investors can use the indicator to make more informed decisions about asset allocation, market risks and rewards, and long-term returns.

Going Beyond Traditional Metrics

Most investors are familiar with the traditional price-earnings (P/E) ratio, a simple measurement dividing a company’s (or index’s) current price by its annual earnings. Though frequently used, the traditional price-earnings ratio has a significant limitation: Earnings can be highly volatile from year to year, making the ratio jump erratically during economic transitions.

Shiller’s innovation was to smooth out this noise by taking a longer view. The CAPE ratio examines an entire decade of earnings, adjusted for inflation, rather than just the previous 12 months. The formula is:

CAPE Ratio = Current Market Price ÷ 10-Year Average Inflation-Adjusted Earnings

Recent Critiques and Variants

While the CAPE ratio is a powerful long-term valuation tool, several economists—most notably University of Pennsylvania professor Jeremy Siegel—have challenged the CAPE ratio’s effectiveness in more recent times. In the May/June 2016 Financial Analysts Journal (“The Shiller CAPE Ratio: A New Look”), Seigel cautioned that changes to GAAP accounting rules in the early 2000s, particularly those affecting goodwill amortization and pension accounting, may artificially deflate reported earnings during downturns, inflating the CAPE ratio.

Moreover, widespread stock buybacks have altered per-share earnings in ways not fully reflected in historical CAPE ratio calculations. To address these concerns, analysts have developed several adaptations.

  • Forward CAPE Ratio: Based on projected earnings, this ratio is better aligned with market expectations.
  • Median CAPE Ratio: Uses median instead of average earnings to reduce the impact of outlier years.
  • Ex-Volatile CAPE Ratio: Excludes crisis years from the earnings window to produce more stable signals.

These seemingly simple modifications make a profound difference. The CAPE ratio provides a more stable valuation assessment of the market by capturing an entire business cycle, including expansions and contractions.

The Origins of the CAPE Ratio

The concept of the CAPE ratio didn’t originate with Shiller. Value investing pioneers Benjamin Graham and David Dodd first proposed using long-term earnings averages in their classic book “Security Analysis” (McGraw-Hill, 1934). They recognized that annual earnings were too volatile to provide a reliable indication of a company’s true earning power.

Shiller and his colleague John Campbell refined this approach in the late 1980s. In a June 2013 AAII Journal interview, Shiller observed that their data dating back to 1881 showed that “real price divided by 10-year average of earnings does help predict the stock market.” But he clarified that while the CAPE ratio “does not predict what is going to happen next year very well,” it “predicts what will happen over the next five or 10 years” with remarkable consistency.

What the Historical CAPE Ratio Reveals

The power of the CAPE ratio becomes evident when examining its historical record. Over the past century, the U.S. market has averaged a CAPE ratio of approximately 16 to 17. Significant deviations from this average have consistently preceded major market movements.

Figure 1 plots the average annual CAPE ratio values from 1881 through 2024.
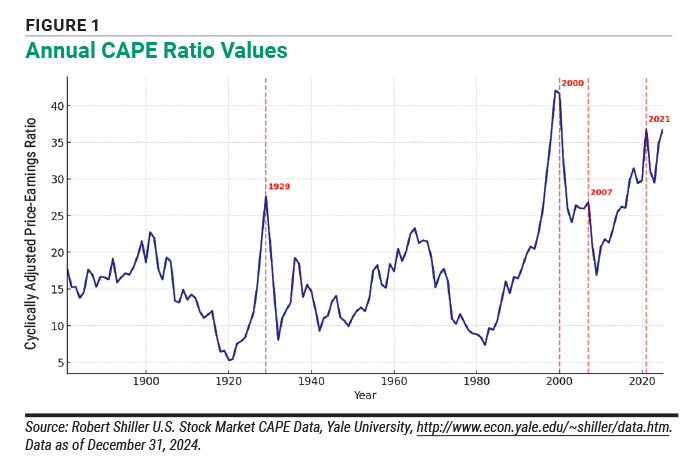
Figure 1. Annual CAPE Ratio Values

Historical CAPE ratio values reveal several critical patterns. The peaks in 1901, 1929, 1966, 1981, 2000 and 2007 all preceded significant market downturns.

Before this year’s early April sell-off, the readings sat in the 95th percentile of historical valuations. This level has only been surpassed twice: during the 1929 peak before the Great Depression and in the 2000 dot-com bubble when the CAPE ratio reached approximately 44.

The CAPE Ratio and Subsequent Returns

What makes the CAPE ratio particularly valuable is its demonstrated relationship with future returns. Research has shown an inverse correlation between starting CAPE ratio values and subsequent 10-year market performance (Figure 2).
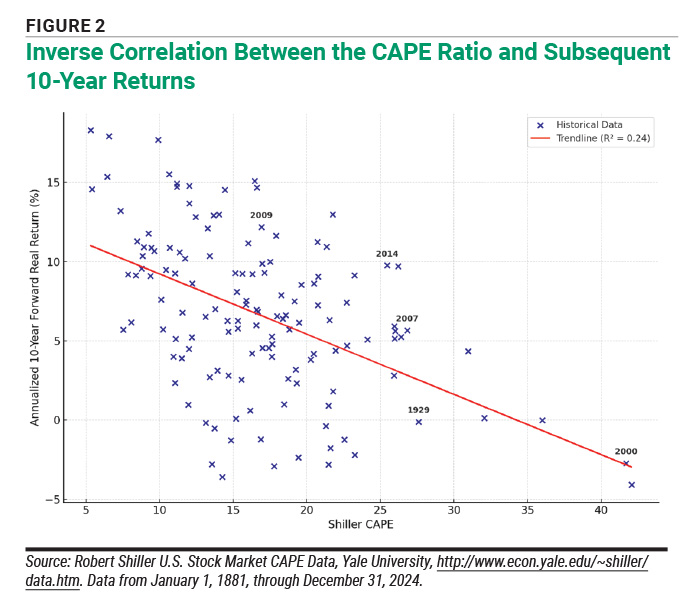
Figure 2. Inverse Correlation Between the CAPE Ratio and Subsequent  10-Year Returns

When the CAPE ratio is low (below 10), subsequent 10-year real (inflation-adjusted) returns have averaged 10.5%, with some periods delivering returns above 15.0%. Conversely, when the CAPE ratio exceeds 30, as it does today, historical 10-year real returns have averaged just 2.9%, with some periods delivering barely positive or even negative real returns.

This relationship makes intuitive sense. When valuations are low, investors enjoy a double benefit: earnings growth and potential price-earnings expansion. However, when valuations are already elevated, future returns face the mathematical headwind of potential price-earnings contraction, even if earnings continue to grow.

While high CAPE ratio values have historically forecast lower long-term returns, they are also associated with increased market volatility and downside risk.

Investors should realize that the CAPE ratio is most useful as a strategic lens—not a trading signal.

The Interest Rate Context

A critical nuance when evaluating the CAPE ratio is the relationship between equity valuations and interest rates. Historically, periods of rising interest rates have often corresponded with declining CAPE ratios and vice versa.

The 1970s and early 1980s exemplified this relationship, with high interest rates coinciding with some of the lowest equity valuations in modern history. The dynamic supported Shiller’s observation that when evaluating current CAPE ratio levels, investors must consider the alternatives available in the fixed-income market. This relative valuation principle helps explain why CAPE ratios have remained elevated during much of the post-2008 period of historically low interest rates.

Academic Research Behind the CAPE Ratio

While Shiller’s original work focused on the U.S. market, subsequent research has demonstrated the CAPE ratio’s predictive value across global markets. Studies by Star Capital, Research Affiliates and others have found similar relationships between the CAPE ratio and future returns in virtually every major equity market examined.

Research by Cambria Investment Management chief investment officer Mebane Faber on global equity allocations is particularly striking. In his self-published book, “Global Value: How to Spot Bubbles, Avoid Market Crashes, and Earn Big Returns in the Stock Market” (2014), Faber showed that if investors had simply allocated capital to the cheapest 25% of countries based on CAPE ratios between 1993 and 2018, they would have earned three times the return of the S&P 500 index (3,052% versus 962%).

The statistical evidence for the CAPE ratio’s predictive power is robust. When comparing CAPE values against subsequent 15-year returns, the correlation is approximately –0.79 (with –1.0 being a perfect inverse relationship). This is among the strongest relationships between any valuation metric and future market performance.

However, it’s important to note that the CAPE ratio’s predictive power increases with time horizon. For one-year returns, the relationship is weak and statistically insignificant. For five-year returns, it becomes more meaningful. For 10- to 20-year returns, it becomes more powerful.

This graduated relationship explains why the CAPE ratio is most valuable for long-term strategic decisions rather than tactical market timing.

Global and Sector Perspectives

One of the CAPE ratio’s most practical applications is comparing valuations across international markets. As of December 31, 2024, data from Siblis Research shows that global CAPE ratios varied widely.

  • India led with a CAPE ratio of 33.68.
  • U.S. large-cap (S&P 500) followed at 32.39.
  • Japan stood at 26.14.
  • European markets like Germany and France were cheaper at 20.64 and 20.21, respectively.
  • Emerging markets such as China (16.03) and Hong Kong (8.61) offered the lowest valuations.

These disparities suggest potential opportunities for geographic diversification, particularly for U.S. investors facing domestic markets at the upper extremes of historical valuation.
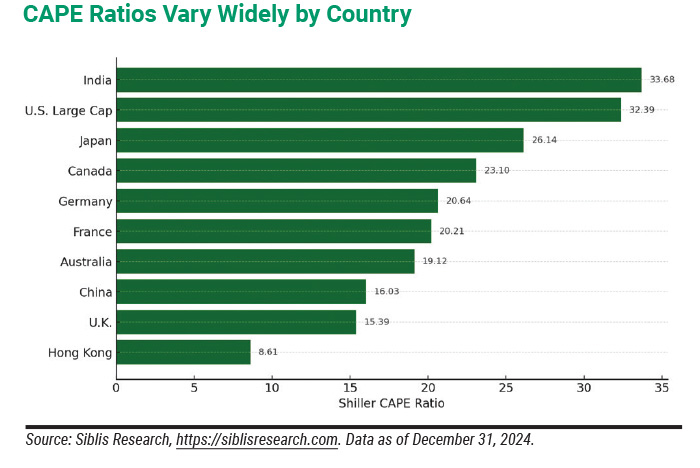
Figure 3. CAPE Ratios Vary Widely by Country

Research by numerous asset managers has demonstrated that a systematic approach of overweighting countries with lower CAPE ratios has consistently outperformed market-capitalization-weighted indexes over the long term. This approach doesn’t require perfectly timing market peaks and troughs—simply gradually shifting allocations toward markets with more reasonable valuations as part of a disciplined rebalancing strategy.

Beyond country-level comparisons, the CAPE ratio can also provide insights into sector valuations within markets. As of April 7, 2025, Morningstar data showed S&P 500 sectors as having large dispersion in CAPE ratios.
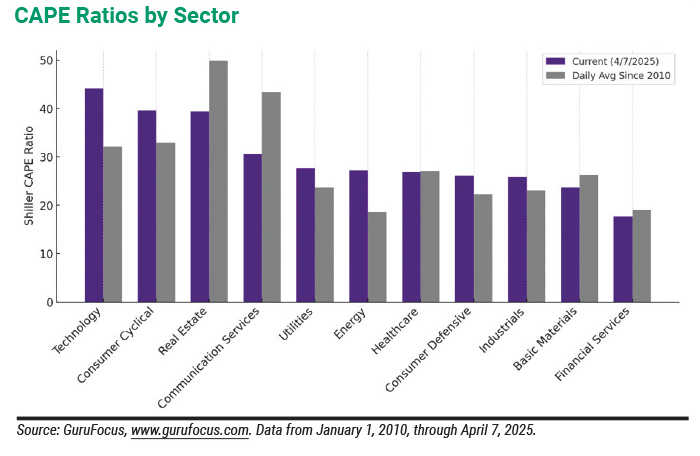
  • Technology led with a CAPE ratio of 44.1.
  • Consumer cyclical followed at 39.6.
  • Real estate stood at 39.3.
  • Basic materials and financial services showed the lowest valuations at 23.7 and 17.6, respectively.
  • Consumer defensive and industrials also showed relatively modest valuations at 26.1 and 25.8, respectively.

Figure 4. CAPE Ratios by Sector

Limitations: When the CAPE Ratio Misleads

Critics of the CAPE ratio often argue that structural changes in the economy justify permanently higher valuation multiples. There are three common arguments.

  • The changing composition of the S&P 500: Technology and asset-light businesses now constitute a much larger portion of major indexes, potentially justifying higher aggregate price-earnings ratios.
  • Accounting standard changes: Revisions to GAAP accounting standards in the 1990s altered how earnings are calculated, potentially making historical comparisons less relevant.
  • The interest rate environment: Higher equity valuations on a relative basis could be justified if interest rates remain moderate or fall to lower levels.

While these arguments have merit, similar claims have accompanied virtually every major market peak throughout history. While valuation norms can shift over time, mean reversion remains a powerful force in financial markets.

In addition, critics such as Siegel have noted that modern accounting changes—especially those related to goodwill impairments, stock-based compensation and mark-to-market accounting—can artificially suppress earnings during downturns, inflating the CAPE ratio. Others argue that widespread share buybacks reduce outstanding shares and elevate per-share earnings, making the traditional CAPE ratio potentially outdated if not adjusted for these structural shifts.

Regional Variations

The CAPE ratio’s predictive ability isn’t perfectly uniform across all markets. Research has identified cases like Sweden and Denmark, which delivered strong returns despite persistently high CAPE ratios. However, these exceptions typically involved markets undergoing significant structural changes: Sweden’s technology transformation and Denmark’s health-care-dominated index, for example.

These exceptions highlight the importance of considering the CAPE ratio in context rather than as a stand-alone metric, particularly for markets undergoing significant structural transitions.

The Feedback Loop

An interesting nuance is the market cycle’s self-reinforcing nature.

This feedback loop becomes particularly evident during economic transitions. During market booms, rising stock prices boost consumer confidence and spending, which, in turn, lifts corporate revenues and earnings. During downturns, this same mechanism operates in reverse, potentially amplifying economic contractions.

This dynamic helps explain why the CAPE ratio tends to reach extremes during market peaks and troughs, making it an imperfect timing tool for short-term market moves.

Measured Approaches to Using the CAPE Ratio

It’s critical to remember that the CAPE ratio is not a short-term market timing tool. It does not reliably forecast returns over the next six to 12 months, and basing investment decisions solely on it can lead to poor outcomes. Its strength lies in informing long-term expectations and strategic allocation decisions, not in predicting immediate market moves.

Rather than making dramatic portfolio changes based solely on the CAPE ratio, consider the following measured approaches.

  • Sector Rotation: Within U.S. equity allocations, consider overweighting sectors with lower CAPE ratios, while being selective in highly valued sectors.
  • Value Tilt: Keep an eye on value-oriented strategies, as these historically outperform during periods following high market-wide CAPE readings.
  • Disciplined Rebalancing: Implement a systematic rebalancing strategy that naturally sells appreciated assets and buys underperforming ones, helping harvest the volatility that typically follows extreme CAPE readings.
  • Reserve Dry Powder: Consider maintaining a modest cash reserve to deploy during significant market corrections, which historical patterns suggest become more likely as the CAPE ratio reaches extreme levels.

Perhaps most importantly, the CAPE ratio provides a valuable psychological framework for navigating market cycles. By understanding the historical context of current valuations, investors can better prepare for the increased volatility and potential underperformance that typically follow extreme CAPE readings.

The CAPE ratio acts as a reality check that helps moderate the emotional extremes of both greed and fear that typically lead to poor investment decisions.

Individual investors can use the CAPE ratio to help set realistic expectations for future returns. The strong inverse relationship between starting CAPE values and subsequent 10-year returns provides a valuable planning tool, particularly for retirement portfolios.

With a CAPE ratio of 31.1 as of April 7, 2025, down from 37.1 at the start of 2025, history suggests potential annualized real returns from U.S. equities in the range of 2% to 4% over the next decade. Such returns would be significantly below the 7% to 10% range many investors have grown accustomed to during the post-2008 bull market.

This does not imply avoiding equities entirely, but it does argue for adjusting savings rates, withdrawal strategies and asset allocations to reflect these more modest return possibilities.

Given current valuations, value-oriented strategies could be poised to outperform going forward, particularly in sectors with more reasonable CAPE ratios.

Conclusion: The Long View

In an investing landscape increasingly dominated by algorithms and short-term thinking, Shiller’s CAPE ratio offers a rare historical context spanning multiple economic eras. The brilliance of the CAPE ratio lies not in promising precise market timing but in grounding investors in fundamental valuation principles that have remained relevant through world wars, depressions, technological revolutions and monetary policy experiments. 

Discussion

JOHN L from NJ posted over 1 year ago:

So the CAPE Ratio and subsequent 10 year returns has a correlation coefficient of 0.24. That means that the Cape Ratio explains 24% of the 10 year return while everything else is 76%. That is not much of a "demonstrated relationship".


Wayne T from IL posted over 1 year ago:

@John Thank you for your comment. This is a valuable observation that deserves a deeper look. You’re absolutely right that a correlation coefficient of 0.24 implies that roughly 5.8% (not 24%) of the variance in 10-year returns can be explained by the CAPE ratio, using the square of the correlation (R²). This suggests that CAPE, by itself, is not a definitive forecasting tool, which is something I fully acknowledge in the article. However, there are a few important nuances to consider: 1. CAPE’s Role Is Strategic, Not Tactical The CAPE ratio is not presented as a precise return predictor or a short-term market timer. The article notes that its strength lies in offering directional insight over long-term horizons. When valuations are historically high, future 10- to 20-year returns tend to be lower. Not perfectly predicted, but statistically and economically meaningful. Indeed, research has shown a much stronger inverse correlation, as high as –0.79, when looking at longer horizons (15+ years), which implies that nearly 62% of return variability over that horizon can be attributed to CAPE values. 2. Statistical Correlation Doesn't Equal Uselessness A moderate correlation like 0.24 may not be impressive in a lab setting, but in the chaotic, noisy real world of financial markets, where countless variables interact, any statistically significant relationship that is both persistent and intuitive can be incredibly useful for long-term investors. Even low R² models are used effectively in economics and finance when the predictive direction is stable and actionable over time. 3. Complementary Use with Other Metrics CAPE shouldn’t be used in isolation. The article outlines that it’s most useful when combined with other macro indicators like interest rates, earnings trends, and global valuation spreads. For example, in today's low interest rate environment, an elevated CAPE may still be “less overvalued” than it would be in a high-rate regime. 4. Empirical Record Despite its statistical limitations, the CAPE ratio has consistently offered valuable warning signals before major market events, such as the 1929 crash, the 2000 tech bubble, and the 2007 financial crisis. These historical markers bolster its credibility as a long-term risk and valuation gauge. In summary, the CAPE ratio is not a crystal ball but rather a compass. Like any single metric, it shouldn't be followed blindly. But when used to guide expectations, manage risk, and build strategic asset allocations, it becomes a powerful piece of a long-term investor’s toolkit. Thanks again for engaging with the piece—this discussion helps sharpen our understanding.


JOHN L from NJ posted over 1 year ago:

Wayne; thanks for the clarification. The stock market is not efficient (price does not equal value). My research suggests that overall market price moves irregularly between twice and one half fair value. At best we can know about how much the market is over or under valued at present. CAPE attempts to measure current valuation as does PE, Q and other measures such as price to book. What no one knows is how much the market will be over or under valued in 10 years or other future date. And that makes valuation measures poor guides to future returns. However, because stock market investment annual return, as demonstrated by Jeremy Siegel, approaches 6.7% plus inflation as time increases to infinity; long term investors in the overall stock market who dollar cost average should be ambivalent to current market value both when purchasing (saving for retirement) and selling (in retirement). That makes CAPE and other valuation measures irrelevant.


Wayne T from IL posted over 1 year ago:

@John You're correct that markets are not perfectly efficient and that prices oscillate above and below fair value, often irrationally so. This is precisely why valuation measures like CAPE, PE, Q, and price-to-book are valuable: they help investors gauge where we are in the cycle, even if they can't pinpoint when sentiment will revert. I respectfully disagree, however, with the view that CAPE and other valuation tools are irrelevant. While they are indeed poor predictors of short-term returns, their utility improves materially over longer horizons. Historical data shows that CAPE has a meaningful inverse correlation with subsequent 10- to 15-year real equity returns. It’s not a crystal ball, but neither is it noise. Ignoring it may lead investors to misalign expectations, overextend risk, or miscalculate withdrawal strategies in retirement. Jeremy Siegel has criticized CAPE, mainly due to accounting shifts over time, but he has conceded that valuation matters. Unlike those just starting to accumulate, investors approaching retirement do not have the luxury of ignoring present valuations when sequencing risk and managing drawdown exposure. For long-term dollar-cost average investors, I agree that valuation shouldn't dominate decision-making. But for those managing asset allocation or assessing the trade-off between future return potential and current portfolio risk, valuation tools—used prudently—remain essential. CAPE is best viewed not as a timing signal but as a strategic compass for navigating long-term expectations and risk posture. Thanks again for contributing to the conversation!


JOHN L from NJ posted over 1 year ago:

Wayne T - We could debate our opinion differences but I think we can agree that CAPE has value as a planning tool. Perhaps you could write an article showing AAII members how to use CAPE in planning retirement withdraws or Roth conversions. Here is an idea for a future article for you to consider: If stock market valuation is low enough (50% of fair value) it could be economical to move 100% of IRA funds to Roth at the highest income tax rate rather than doing smaller amounts over multiple years.


ROBERT A from NC posted over 1 year ago:

Wayne says: “for those managing asset allocation or assessing the trade-off between future return potential and current portfolio risk, valuation tools—used prudently—remain essential.” Having been retired for more than 12 years and being entirely reliant on portfolio income from 100% equities, I guess I’m just a fool destined for poverty, because I’ve never even considered the CAPE, the VIX, or any other “essential” tools for managing my “risk.” As far as I’m concerned, they are irrelevant distractions. But I’ll be sure to let you know when I apply for food stamps.


ROBERT A from NC posted over 1 year ago:

Wayne, maybe you ought to create a shadow portfolio based on the CAPE, the VIX, and your other essential signals, so we can all see how well they work. Alternatively, you could create a portfolio parallel to the existing shadow stock portfolio and apply CAPE and VIX signals to it so we can see how well those constructs enhance the portfolio's returns.


Wayne T from IL posted over 1 year ago:

@Robert I wouldn’t call you a fool, and I doubt the food stamp line is forming any time soon. But your situation illustrates exactly the point I was making. You’ve had the benefit of a 12-year equity bull market to support a 100% stock portfolio in retirement—a remarkable run, especially given where valuations were when you retired. That historical tailwind has done a lot of heavy lifting. But not every retiree will be so lucky with their starting point. The CAPE, like any valuation metric, doesn’t hand out guarantees—but it does offer a statistically grounded lens for understanding the starting conditions of an investment journey. For someone entering retirement today, with valuations in the 95th percentile, the road ahead looks very different than it did in 2012. My point isn’t that every investor must worship at the altar of CAPE or VIX. It’s that tools like these can help inform better expectations—and in some cases, help retirees avoid the kind of sequence-of-returns risk that even a strong stomach or 12 years of market success can’t immunize against. You’ve had a good run, and I’m genuinely glad for that. But extrapolating personal fortune into universal truth is a dangerous game in markets. History tends to be an unforgiving teacher. The CAPE wasn’t designed to drive tactical trading signals or to be the engine behind a real-time, signal-triggered portfolio. It’s a strategic valuation lens—one that helps investors frame long-term expectations rather than outguess next quarter’s market move. Creating a “shadow portfolio” to test how well CAPE or VIX “work” would be a bit like judging the usefulness of a weather forecast for planning a harvest by checking whether it rained tomorrow. You might get interesting noise, but you'd miss the entire signal. --Wayne


ROBERT A from NC posted over 1 year ago:

Wayne, to your statement: "But extrapolating personal fortune into universal truth is a dangerous game in markets." I'm not the one who is trying to promote a "universal truth." I'm merely disputing YOUR "universal truth" that the CAPE and VIX are "essential." They're no more essential than regarding volatility as risk. You suggest testing your theories about the CAPE and VIX would be like testing a weather forecast. I disagree. It would be more like testing a TOOL for weather forecasting to see if it is truly useful. If your tools are so "essential," then put them to the test, which is real-world investing. If they have any validity at all, then a shadow portfolio based on their "essential" utility should produce superior returns over time. My low opinion of market-timing signals isn't based on 12 years of success. It's based on more than 40 years of success with 100% equities through some significant bear markets. I'm not trying to tell anyone that my way of investing is "THE" way or that my methods are "essential." YOU are doing that. I'm here simply to provide a voice of opposition, because I think it does a disservice, especially to young investors, to confuse them with irrelevancies that you call "essential." If you want to rely on the CAPE, the VIX, or any other "signals" to drive your investing, that's all well and good, but you shouldn't be telling others that your way is "essential." I'm living proof that it isn't.


Wayne T from IL posted over 1 year ago:

@Robert your conviction is evident—and earned. Surviving 40 years in 100% equities, including multiple bear markets, is no small feat. However, to clarify, I’m not trying to invalidate your path. I’m pointing out that your outcome is not a substitute for evidence-based guidance aimed at broader audiences with different goals, timelines, and tolerances for risk. You say I’m promoting a “universal truth” by calling CAPE and similar tools “essential.” I’m not. I’m promoting prudence. Tools that offer long-term valuation context are essential for investors, especially those managing withdrawals, retirement income, or navigating inflated expectations about future returns. Not because they deliver perfect precision, but because they help ground decisions in history rather than hope. Your analogy that we should “test the tool” is fair on the surface, but it oversimplifies. The CAPE ratio is not designed to deliver a superior return stream but to forecast return conditions, much like altitude helps a pilot prepare for turbulence without claiming to steer the plane. As for VIX and CAPE being “market timing signals,” I never said that. In fact, I explicitly cautioned against that interpretation in my article. If there’s any disservice to young investors, it’s encouraging them to ignore risk entirely because one seasoned investor rode out history’s bull markets with steel nerves and an iron stomach. You’re not “just offering a voice of opposition.” You’re positioning your personal experience as proof that risk metrics and valuation signals are irrelevant. That is, functionally, a universal claim. You’re entitled to that view, but don’t mistake strong opinions for strong evidence. Ultimately, my goal isn’t to win a rhetorical sparring match—it’s to equip investors with a fuller toolkit than “just hold on and hope it works out.” You may not need CAPE. That doesn’t mean it isn’t essential to someone else’s understanding of risk, expectations, or resilience. --Wayne


ROBERT A from NC posted over 1 year ago:

Sorry, but I don't see the "evidence" in your "evidence-based guidance." At least the experience I related was from real-world results.


Wayne T from IL posted over 1 year ago:

@Robert Lived experience has value, but it’s not the same as evidence. Real-world outcomes are anecdotes. Evidence-based guidance draws on broad data, repeatable patterns, and statistical relationships observed across time periods, geographies, and market regimes. Your results are real, but they’re one outcome among many. They don’t override decades of global research on valuation and forward returns, nor invalidate the utility of tools like CAPE for long-term planning. You’re welcome to your approach. AAII has always advocated that there is no singular approach for everyone. My goal is to build frameworks that serve a broader spectrum of investors. Thank you for the dialogue.


ROBERT A from NC posted over 1 year ago:

You have it completely backwards. All the research, statistics, theories, and backward-looking correlations in the world don't trump the best evidence, which is real-world outcomes. You can twist and fake a lot of things, but real results tell the tale.


Wayne T from IL posted over 1 year ago:

@Robert I understand that you place a premium on your personal outcomes. But framing them as "the best evidence" reflects a fundamental misunderstanding of how evidence works in finance, or any discipline grounded in data. Anecdote, even spanning 40 years, is still anecdote. It’s a single sample path, not a statistically valid test of a hypothesis. That’s not to diminish your experience, but let’s be precise: “real-world results” are not inherently superior when they lack replicability, context, or control. That’s why researchers test theories across thousands of market environments, time periods, and geographies, not just one investor’s portfolio. You’re not the control group, Robert. You’re an outlier with a strong constitution and a tailwind from one of history's most exceptional bull markets. You insist that research and statistical evidence are irrelevant because they don’t align with their personal journey. That’s not intellectual opposition; that’s self-confirmation bias.


JOHN L from NJ posted over 1 year ago:

Wayne, Robert A makes a good point when he suggests that you should set up a shadow portfolio and use CAPE to enhance returns to prove the usefulness of CAPE. Unfortunately to beat the market you need to know something that others don't. And CAPE is so widely known and followed that it and all the other valuation measures don't provide this edge. You are in a difficult position. There is no widely known way to beat the market. CAPE could be a useful planning tool for retirement withdraws but it won't enhance market returns. Robert A however, like many others have discovered that investment return can be greatly enhanced by enduring volatility. And it is the widespread fear of this volatility that makes Robert A's approach work and not a lucky bull market. He is investing at Level 3. Certainly if everyone was like Robert A, this might not work. But there is little chance that will happen.


Wayne T from IL posted over 1 year ago:

Hello John: You’re absolutely right that beating the market consistently is extremely difficult, and any tool—CAPE included—must be approached with clear eyes about what it can and cannot do. CAPE is not designed to provide a short-term trading edge or serve as a secret weapon for outperforming the market. Rather, its strength lies in helping investors set reasonable long-term expectations and make more informed strategic decisions. As highlighted in the article, the CAPE ratio has a robust inverse correlation with subsequent 10- to 15-year real returns (correlation of –0.79), but it has very little predictive power over one-year horizons. In other words, it’s a planning tool, not a timing mechanism. Its most effective use is in shaping decisions around withdrawal rates, savings goals, and long-term asset allocation. The idea of using a shadow portfolio to “prove” CAPE’s usefulness through return enhancement misses the mark because the CAPE ratio was never intended to act as an alpha-generating signal. As you rightly note, markets are quite efficient (in the long run), and CAPE’s value is in helping investors avoid unrealistic return assumptions, especially when valuations are stretched. It provides a framework to temper expectations and navigate future volatility with a more grounded perspective. I also respect Robert's approach and the recognition that the willingness to endure volatility is a powerful differentiator. Using tools like CAPE to anticipate heightened volatility during periods of elevated valuations can help prepare investors psychologically to stay the course, reinforcing, rather than contradicting, a Level 3 mindset. Thank you again for your comments. These discussions help clarify how tools like CAPE can support disciplined, long-term investing rather than trying to outguess the market.


ROBERT A from NC posted over 1 year ago:

John L is absolutely correct (as usual). It's my approach that works; it has nothing to do with being "lucky" in my timing. I know many other buy-and-hold investors who have achieved great wealth over time by staying the course and not panicking or letting "signals" drive their investment decisions. My point is NOT to show that the CAPE has no validity. It's just that it is of no use to me (and many other investors). Thus, it is not essential, and teaching investors that it is essential is a disservice. I realize that the CAPE can be used as an indicator of whether the market is overvalued, but it is far from essential in that regard. Without any reference to the CAPE, I believed the general market was overvalued when I retired 12+ years ago. In my opinion, it's been overvalued ever since. Even the late 2018 crash and the Covid panic barely brought down general prices anywhere close to reasonable territory. I assume, but do not know, that the CAPE probably supports my view in this regard. Nevertheless, even my relative certainty about the market being overvalued has not affected my investment habits or my general propensity to stay the course. Wayne, I do not take issue with you presenting your views on the CAPE, the VIX, or any other construct you believe to have value. The only issue I have is your presentation of such constructs as "essential," as if every investor must pay attention to them and presumably let them influence their investment decisions. I also maintain that my results, as well as the results of a host of others who practice methods similar to mine, provide solid EVIDENCE to support my point.


ROBERT A from NC posted over 1 year ago:

A lighter point. A child can discover that fire is hot through anecdotal experience. He doesn't need a triple-blind study, statistical evidence, or any correlation coefficients. The mere fact that he gets burned once is quite sufficient EVIDENCE that fire is hot.


Wayne T from IL posted over 1 year ago:

@Robert Yes, a child learns fire is hot by getting burned. That’s direct, personal evidence. But if we based fire safety standards on anecdotal burns instead of broader testing, research, and predictable behavior of heat under different conditions, we'd have a lot more house fires. Your personal experience isn't necessarily a framework for teaching others how to navigate markets. I have never argued that every investor must use CAPE. I said it’s essential to understand the long-term relationship between valuations and expected returns. That’s not dogma. It’s decades of research across hundreds of data sets and global markets. You may ignore it. Others may not. But your success, and that of like-minded investors, does not make valuation irrelevant—it just means you chose a strategy that didn’t require it. That’s not evidence against CAPE. It’s evidence of your comfort with risk, time, and volatility. Your “certainty” that the market has been overvalued for 12 years didn’t lead to any portfolio change. That’s fine. But it doesn’t make tools for measuring valuation unnecessary. It just means you chose not to use them. Your choice not to use CAPE doesn't disprove its utility to the broader populace. You're simply saying you don't find it useful. That's your preference, and it's worked for you. I hope your approach continues to bring you success!


ROBERT A from NC posted over 1 year ago:

"I have never argued that every investor must use CAPE." I appreciate your concession that the CAPE is not "essential," but your statement on fire safety standards is backwards. If we waited for "broader testing, research, and predictable behavior of heat under different conditions" to develop safety standards, we'd have a lot more deaths from house fires. Such standards have been driven by catastrophic (anecdotal) events and have largely been developed in direct response to those events long before any research would have required them. I, like many successful investors, choose real-world experience over some academician's construct that does not put dollars in our pockets. If you want to ignore our success and experience, that's fine. But it is wrong of you to try to convince novices of the superiority of methods that have not been demonstrated to produce superior results.


Wayne T from IL posted over 1 year ago:

@Robert You keep reframing your personal success—and that of like-minded investors—as a refutation of valuation tools. It isn’t. It’s evidence that your approach worked, in a specific historical window, under specific market conditions. That’s not a system. Your interpretation of “essential” seems to rest on the idea that anything not universally adopted or required must be nonessential. Seatbelts aren’t needed in every crash. That doesn’t make them nonessential. CAPE isn’t needed in every investment plan. That doesn’t make it irrelevant. And no, fire safety standards are not the product of a few people getting burned. They’re based on pattern recognition across millions of data points, analyzed to prevent broader harm. That’s what valuation tools like CAPE do: They offer probabilistic guardrails to reduce long-term regret, especially for investors without 40 years of composure or context. You prefer intuition. I prefer historical context and tested frameworks. That’s a philosophical divide. I wish you continued success.


ROBERT A from NC posted over 1 year ago:

I prefer judgment, not intuition, and I don't "refute" valuation tools. I simply express skepticism about the efficacy of the ones you're touting with the methods in which you propose they be used. In your article, you proposed certain ways to use the CAPE ratio, based on what would have happened "in a specific historical window, under specific market conditions." I propose that you create one or more shadow stock portfolios to test the efficacy of those proposals over the next 10 to 20 years. You set the rules using the CAPE ratio, and you can even throw in your VIX signals if you wish. You can educate us all and make a bundle in the process, can't you? I will certainly be continuing my methods with my own portfolio, and I'll be happy to form a competing shadow portfolio so we can compare results. In fact, I would probably go with one or two low-expense-ratio domestic equity index ETFs and leave it at that. Whoever has the highest value in, say, 15 years, wins. If you beat me using your CAPE/VIX methods, I'll buy you a beer. Surely you can beat some lowly index ETFs. Let's show everybody what works and what doesn't. Game?


Wayne T from IL posted over 1 year ago:

Robert, I think we’re operating from fundamentally different premises about what valuation tools like the CAPE ratio are meant to do and how they should be judged. The CAPE and VIX aren’t trading signals or systems designed to maximize short- or long-term returns. They’re frameworks for understanding conditions, not outcomes. They aim to help investors better manage expectations, calibrate risk, and stay grounded when sentiment runs high or low. Trying to evaluate them based solely on portfolio value in 15 years is like assessing a seatbelt based on how fast the car goes. It misses the point. I’m not dismissing your index-based approach—it’s time-tested, and it’s exactly the right path for many investors. However, the idea that using valuation data to inform strategic decisions is somehow a competing philosophy to passive investing is a false dichotomy. These tools are not about "beating" anyone but about thinking more clearly. I think I've shown that I’m always open to reasoned dialogue. But I won’t turn a framework for perspective into a scoreboard. That’s not what this conversation was meant to be or what those tools were built for. So with respect, I’ll leave the competition to others. I’ll continue doing my best to help investors understand the market in context, whether or not they choose to use that lens.


ROBERT A from NC posted over 1 year ago:

Yeah, I get it. The CAPE ratio and the VIX are sort of Nostradamus-type oracular tools that sort of predict things, but you can't really rely on them. We can certainly look backward and see correlations between their computed values and what sometimes happened afterward, but we don't know for sure whether it will happen again. And that's when I start scratching my head and wondering why I should pay any attention to them at all. I thus conclude that they have no value to me unless I'm going to use them in making buy and sell decisions, which I won't. I've been quite successful without them. I know many other people that have been enormously successful without them. Yet there are statistics and correlation coefficients and theories out the wazoo about how important they are. Yeah, I get it. To all those who wish to waste their time and energy with such constructs: Good luck! I've certainly wasted enough of mine in this discussion.


Wayne T from IL posted over 1 year ago:

Robert. Understood. You've made your position clear and I respect your decision to ignore tools that don’t serve your approach. No one’s forcing you to use them, and no one’s questioning the fact that you’ve had success without them. But as I’ve said from the start, success in investing doesn’t hinge on any single strategy, and sharing evidence-based tools—whether or not everyone chooses to use them—is not a disservice. It’s education. You’ll continue with what works for you. That’s more than fair. Wishing you continued success—and peace of mind.


ROBERT A from NC posted over 1 year ago:

Wayne, the more I think about it, the more I agree with John L that it’s probably a good thing more people don’t invest the way I do. For the coming decades, my children will also benefit from its relative rarity. Thus, I actually owe you a debt of gratitude instead of disdain. Thank you!


Wayne T from IL posted over 1 year ago:

@Robert You're welcome! If your legacy depends on others avoiding the path you've taken, then I’m glad to be of service. Fortunately, my work isn’t about convincing everyone to invest like you—or like me. It’s about helping people understand their options, the trade-offs involved, and the historical context behind their decisions. Either way, I’m glad your children will benefit.


BARRY J from TX posted over 1 year ago:

As I read this interaction, I felt like Howard Cosell at ringside at the "Thrilla in Manilla" -- rope-a-dopes and pulled punches leading up to a TKO after 14 rounds. And EVERYBODY made money. Lots of good learning here. Let's see if I paid attention (although I did drop my bowl of popcorn a few times.) #1 CAPE uses 10 to 15-year backward-looking periods to calculate relative market pricing/valuations, and #2 CAPE can be/is updated continually (on the Yale website) to provide a rolling historical perspective of relative market cycle impacts, and #3 incorporates consideration of the impact of contemporaneous interest rates, then #4 an investor can extrapolate past CAPE data for similar periods of interest rates/inflation rates to #5 navigate market cycles and #6 estimate or bracket future market opportunities which can #7 inform the strategic fit of alternative investment strategies. #8 The article presents a “pop-up” disadvantage every time it outlines a specific CAPE advantage. Like I said, it reminds me of the Thrilla in Manilla -- a TKO after 14 rounds.


Wayne T from IL posted over 1 year ago:

@Barry I appreciate the ringside commentary and the fact that you held onto at least some of your popcorn. Your eight-point summary is remarkably well distilled, and yes, it shows you were paying attention. You also picked up on something important: the article doesn’t treat CAPE as a magic wand. Every strength is presented with context, and limitations are acknowledged alongside use cases. That’s by design. CAPE isn’t a trigger; it’s a lens. One that sharpens as the time horizon lengthens and the noise recedes. If readers walked away understanding that valuation is not timing, that tools inform rather than dictate, and that the market has never rewarded rigidity, then it was worth the bruises. And as you noted, everybody made money. I’ll take that outcome, popcorn spills and all.


DAVE G from TX posted about 1 year ago:

Wayne, Yes, I agree CAPE is not a magic wand to make you money, in fact many years ago I decided much like John L, that it was relatively useless by putting Shiller's CAPE data in my own spreadsheet and much like John, it seemed like noise. The reason is easy to see if you take the red line out of figure 2 above. It shows very clearly the predictive value of any particular CAPE number based on history. Let's say we are looking at the predictive value of CAPE 20. It looks to me like it is predicting (and I use that term loosely) a 10 year forward annualized return of -3% to +13%. Wow, if you read Malkiel, his random walk predicts 10 year annualize returns go from about -3% to +15%. I'll take Malkiel over Shiller any day. If you remember Shiller's book back in 2000, he himself would describe what was going on as more of an attempt on the part of academics and popular thinkers to rationalize market bubbles. On the cover of said book is a quote by "The Economist" which calls it "A modern classic of serious economics that demands to be read, and can be enjoyed, by the interested nonspecialist." [nothing more and nothing less - my comment]. In other words, if you have seriously read and listened to Shiller over the years you would understand the quote on the back of his book, which to paraphrase slightly says "The point of Irrational Exuberance is not to help investors....it is to deepen our understanding of the events we are watching as one bubble gives birth to the next.


Wayne T from IL posted about 1 year ago:

Dave, I appreciate your taking the time to look at the CAPE data yourself—that’s more than most are willing to do. But I think the takeaway may not be as conclusive as you’re suggesting. You mention that CAPE “predicts” a 10-year return range of about –3% to +13%, and compare that to Malkiel’s “random walk” range of –3% to +15%. That’s a fair observation—but it glosses over two things: First, CAPE isn’t designed to deliver pinpoint predictions. It’s a probabilistic framework, not a crystal ball. The key isn’t the range, it’s the skew. Lower CAPE levels tilt the probability of higher future returns; higher CAPE levels tilt them lower. It’s not about certainty; it’s about informed expectation. Second, randomness is not the benchmark CAPE competes against. Investors use CAPE to avoid being surprised by lower-than-expected returns when valuations are stretched or lulled into complacency when everything seems euphoric. It’s not a trading signal; it’s a strategic lens. As for Irrational Exuberance, you’re absolutely right. Shiller’s aim wasn’t to hand investors a buy/sell manual. It was to help explain the psychological and structural forces behind bubbles and mispricings. But that doesn’t mean his work lacks practical value. On the contrary, understanding when the market is priced for disappointment has helped many investors calibrate risk, adjust withdrawal rates, or diversify more deliberately. If you walked away thinking CAPE is just noise, I respect that. But I’d offer this: not all tools are meant to be sharp-edged trading instruments. Some are dashboards. And if you use them for what they’re built to show, not what you wish they’d predict, they tend to work remarkably well. Thank you for your thoughtful comments!


DAVE G from TX posted about 1 year ago:

Wayne, I respectfully disagree with your comment; "Second, randomness is not the benchmark CAPE competes against." It absolutely is, look at the history closely of figure 2. For CAPEs anywhere between about 13 to 23 the chart tells us your results for the next 10 years can be within the variance I listed above, -3% to +13%, with maybe a 25% chance it falls around your trendline. I certainly agree it is not a pinpoint measurement, which means that by "tilting" your portfolio based on this imprecise measurement you will get the "scatter dots" not in any kind of predictable order in time, so it is reasonable to believe that low returns or high returns have equal chance of coming first or last. In fact, the chart tells me that first you have a 25% chance of hitting the trend line, but I can't tell you when. Second, think of what the chart is predicting and what you are making changes for --- the next 10 years. In year 2 you get another CAPE and it changes in an up direction, followed by year 3 which moves in a down direction -- rinse and repeat a few more times. Are you adjusting your tilt yearly based on this "noise." If not, what good is the CAPE, if yes, then I suggest you are adjusting your account to 75% noise and your returns will reflect that. Finally, look at the absolute value of the points on the chart, and then draw a BIG red line horizontally at about 10% annualized returns, which over the last 60 years is very close to what you would have gotten investing in the S&P500, without any "tilting" at all. I will take my odds on 10%, because I know there is a very good chance that any really blunt instrument will just reduce my returns. That is what most all the academic studies have shown and what I have learned the hard way. Now "tilting" for 50+ years with small to mid-caps, that is much better odds than "tilting" with CAPE, IMHO.


Wayne T from IL posted about 1 year ago:

Dave, your take is thoughtful, and I genuinely appreciate your engagement—but I still think you’re framing CAPE’s utility in a way it was never meant to deliver. First, you're absolutely right that there's wide dispersion in forward 10-year returns within mid-range CAPE values. That’s not news, and it’s precisely why CAPE is not—and has never been marketed as—a short-term allocation signal. It’s a valuation context tool. Its role isn’t to beat randomness on a one-year rolling basis—it’s to help investors make more informed strategic decisions when valuations get extremely stretched or historically depressed. Second, the “randomness” you cite isn’t the benchmark for usefulness; it’s the environment the tool helps you understand. The trendline in Figure 2 doesn’t promise precision, but it does highlight a clear inverse relationship: higher starting valuations have historically led to lower subsequent returns. The correlation (–0.79 over 15-year periods, as noted in the article) is among the strongest in financial markets. And you’re right, CAPE doesn’t tell you when the return drag from high valuations kicks in. Sometimes the market keeps running. Sometimes it doesn’t. But in planning, the “when” matters less than the “what if.” That’s why CAPE is helpful for calibrating expectations, not dictating trades. It helps with questions like: • Is now the time to increase savings or lower withdrawal rates? • Should my long-term return assumption still be 10%, or something lower? • Is now the moment to go all-in, or pull back risk exposure slightly? Your red line at 10% long-term S&P returns is valid historically. But CAPE isn’t meant to beat that, it’s meant to warn when that baseline may be less likely going forward. Ignoring that signal might work out fine. But for investors trying to manage sequence-of-returns risk, or build resilient retirement plans, even a modest tilt in awareness, not allocation, can make a meaningful difference. As for small/mid-cap tilts: I agree completely. That’s a data-supported structural tilt with strong empirical grounding. CAPE isn’t in conflict with that, it just offers another layer of long-term perspective. Used well, it doesn’t replace fundamentals or diversification. It adds caution when caution is warranted. Bottom line: CAPE isn’t about predicting what comes next. It’s about not being surprised when the long-term math eventually kicks in.


DAVE G from TX posted about 1 year ago:

Wayne, previously you said - ".understanding when the market is priced for disappointment has helped many investors calibrate risk, adjust withdrawal rates, or diversify more deliberately.." This seems to indicate you are going to take some action based on this very noisy signal. In other words, it sort of suggests you don't understand your risk tolerance and you are letting this very unprecise signal dictate what you do, or in your words at least tilt you more towards doing something. If your own risk tolerance is not solid enough to withstand this noise, what do you think is going to happen when with only a couple months warning the market drops 35-50% for some of your assets ... ala 2020 March? How about the other end of the risk, when like now 2023 & 2024 were up about a combined 50%, do I need ANY kind of measurement to tell me if the mean return of the market is 10% that it is probably overvalued by now. How long is it going to take "CAPE noise" to adjust -- what am I going to do with any of this knowledge. I haven't really done anything, because my retirement income withdrawal of less than 2% is not going to be affected by any of it. If I was withdrawing 6% maybe I would be more worried, but I would be taking my signals from something else more concrete like the Level 3 strategy and tuning out the "other" noise. That is how you stay "grounded" in your own strategy and avoid what a Vanguard study pointed to a number of years ago, in that investors lose on average somewhere around 2% by selling investments early based on emotion. You say in your most recent response; "But for investors trying to manage sequence-of-returns risk, or build resilient retirement plans, even a modest tilt in awareness, not allocation, can make a meaningful difference." The time to manage and build your retirement is before you retire and the proper method for doing this is like you say to add caution, if you build in caution and knowledge in the form of market expectations, you are not surprised at all when those expectations show up and you don't need to make any changes because of them. IMHO CAPE is just not something that is going to help anyone sleep better, in fact with the size of its unknowns, it may just do the opposite, especially for those that do not understand it, and those that do understand don't really need it.


Wayne T from IL posted about 1 year ago:

Dave, I respect your clarity and consistency, and I don’t think we’re as far apart as it may seem. But I want to correct a key misinterpretation: using CAPE to “calibrate expectations” is not the same as reacting to noise, nor does it imply my risk tolerance is shaky. Quite the opposite. A strong risk tolerance doesn’t mean ignoring data. It means knowing how to put it in proper perspective. CAPE isn’t a signal to act every time it moves. It’s a tool for understanding the background conditions so when volatility shows up—whether in 2020 or 2008 or the next time—I’m not surprised by the magnitude or the math behind potential outcomes. You ask, “What am I going to do with this knowledge?” In my case: I plan, I temper assumptions, and I avoid building strategies on the rearview 10% return line without checking whether we’re starting from a 10th percentile or 90th percentile valuation environment. That doesn’t mean I abandon equities. It means I build portfolios—especially for retirees or near-retirees—on more conservative assumptions when valuations are stretched. You’re absolutely right: the real damage comes from reactive behavior—panic selling, performance chasing, loss of discipline. But that’s precisely what CAPE is meant to prevent. It gives long-term investors a framework for adjusting expectations before emotions take over. It’s not about triggering allocation changes every year. It’s about understanding where you are in the long game. And if someone has a sub-2% withdrawal rate, full confidence in their strategy, and no need to adjust anything based on return expectations—that’s great. Truly. But that doesn’t make the CAPE useless. It just means your situation doesn’t require the same level of forward-planning sensitivity. So no, I don’t consider CAPE noise. I consider it signal—but only for the right questions.


CHUCK M from GA posted about 1 year ago:

In July 2017, AAII Journal published an article about the Shiller Index ("Three Value-Investing Benchmarks," by Gary Smith). All three of the indices in that article are fairly easy to calculate with data readily available. Is there a reason why AAII doesn't publish on their website historical graphs of these indices?


Edward M from AZ posted about 1 year ago:

I think many things historical, including CAPE values, are going to be less relevant in the market than those things in the last 20 years. When I started investing in the mid 1980's I had to buy "round lots" of 100 shares and I paid, at a minimum, $49 in commissions in and out of every trade. Today I can buy a single share if I want with no commission. Just that change has resulted in a significant increase in the number of "retail investors" and increased the amount of money available to invest in the stock market many times over. From a purely macroeconomic perspective, that alone is going to result in overall higher valuations. While a CAPE of 25 in the 1930's might have indicated an overvalued market that would result in lower overall returns over the next decade, today that same CAPE of 25 would be indicative of a properly valued market condition. If you plot the linear regression of the CAPE from 1920 to 2020 on the graph in the article, it would have a significant upslope. For whatever reason, as time goes on, valuations once considered high become valuations considered the norm.


You need to log in as a registered AAII user before commenting.
Create an account

Log In

Get your free copy of our special report analyzing the tech stocks most likely to outperform the market.

Download the FREE Report Here: