

The Stock Market at Midyear: Big Gains Fueled by Earnings Growth
by Charles Rotblut | July 02, 2026
As we gear up to celebrate the U.S.’ 250th Fourth of July (aka the semiquincentennial), the S&P 500 index is coming off its best quarterly gain in six years. The large-cap index surged 15.2% in the second quarter of 2026. The S&P SmallCap 600 index performed even better, soaring 19.7%.
Year to date, the S&P 500 has set 24 new all-time highs. This puts 2026 among the top 20 years since World War II for record highs set during the first half of the year, according to CFRA Research chief investment strategist Sam Stovall.
What is notable about the market’s run is that there is earnings growth behind it. Only three of the 11 S&P 500 sectors failed to report double-digit growth in first-quarter 2026, according to LSEG I/B/E/S. Large-cap consumer staples companies gained 8.1%. The energy and healthcare sectors reported declines of 0.8% and 3.4%, respectively.
The earnings growth is being fueled by widening profit margins, as illustrated by the chart below from J.P. Morgan Asset Management’s Guide to the Markets. The gray shading in each column is the contribution of profit margins to growth.
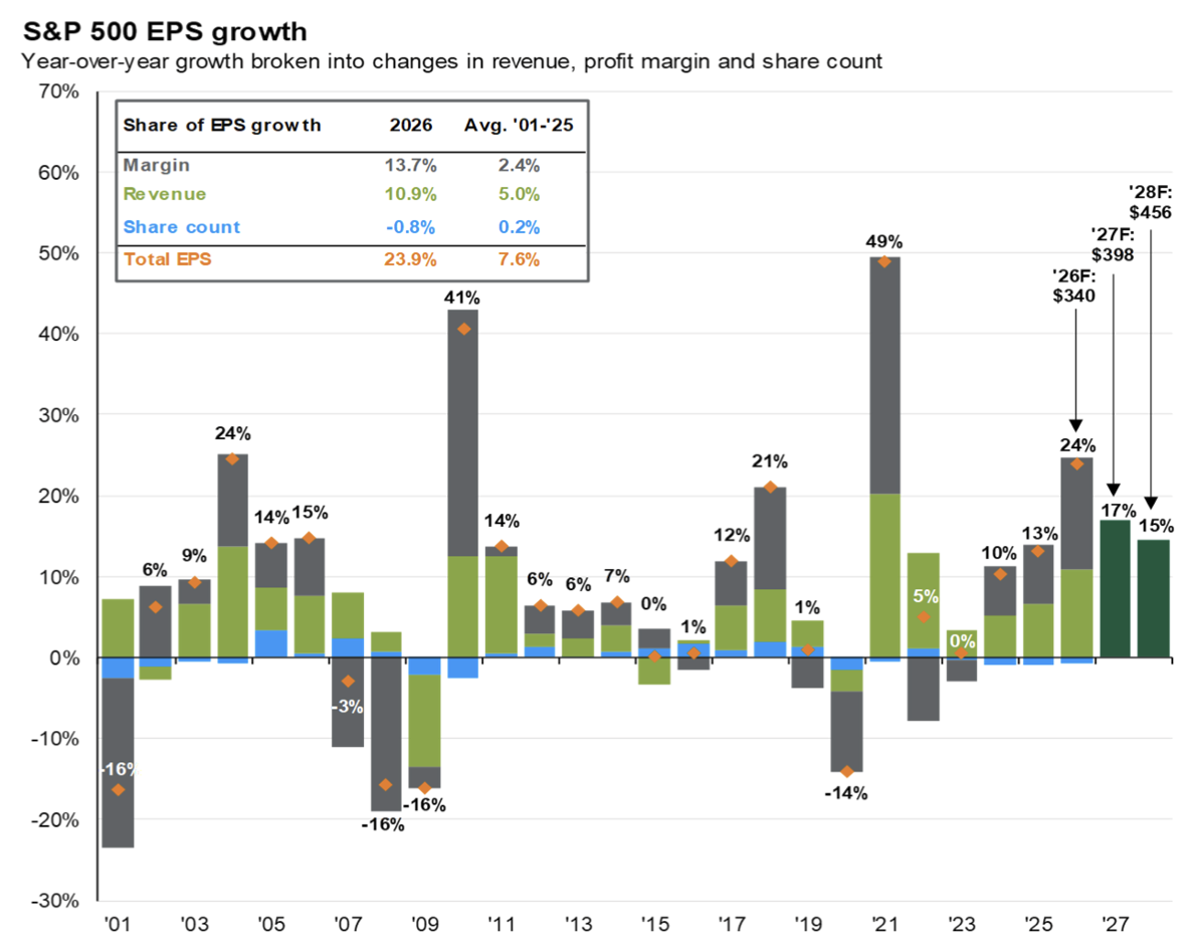
Source: J.P. Morgan Asset Management.
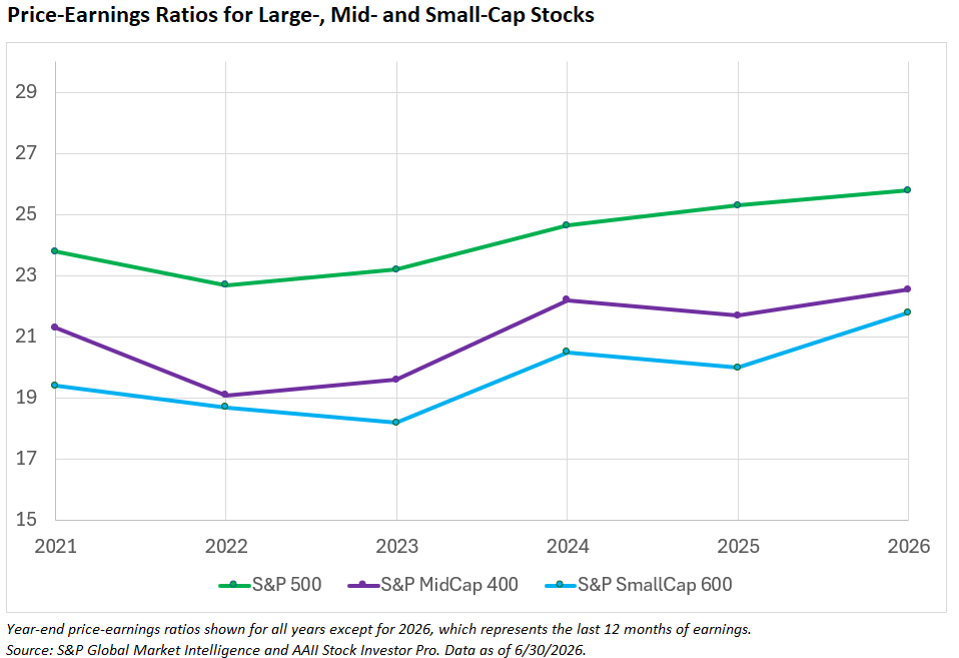
Valuations for the median stock have been rising, though at a slower pace than the price gains. The trailing 12-month price-earnings (P/E) ratio for the median S&P 500 stock is 25.8. The index’s five-year average price-earnings ratio is 23.9.
This isn’t to say that S&P 500 valuations are cheap, but it does show that we are not seeing a big multiple expansion. (Multiple expansion occurs when valuation ratios rise faster than the fundamental metric on which they are based.) This is a positive for the stock market. More attractive valuations continue to be found among mid-cap (median price-earnings ratio of 22.6) and small-cap (21.8) stocks.
Among the AAII Stock Screens, those incorporating growth or momentum measures fared best during the first half of the year. The Driehaus Revised screen soared 60.1% year to date. The original Driehaus screen ranks in second place with a 46.3% year-to-date return. Though both require recent accelerations in earnings growth, the revised screen also has relative strength criteria.
The outperformance of growth- and momentum-related screens is not surprising. The S&P 500 Momentum index and the S&P 500 Growth index were two of the best S&P 500 subindexes during the first half of 2026. They rose 44.1% and 21.9%, respectively.
Looking to the Second Half of 2026
Based on historical data, the 24 all-time highs set during the first half of the year are a lucky sign. In the other years ranking in the top 20 years for first-half record highs, the S&P 500 gained an additional 6% on average and rose in price 80% of the time in the second half of the year, according to Stovall.
Earnings growth lends support to these odds. Analyst forecasts compiled by LSEG I/B/E/S call for earnings to rise in the third and fourth quarters of 2026 for both S&P 500 and Russell 2000 index companies.
Valuations are not cheap, but they’re not excessive either. The median forward price-earnings ratio for S&P 500 companies is 19.0. Small-cap stocks are cheaper with a median forward price-earnings ratio of 16.0.
The geopolitical and macroeconomic pictures are wild cards. Though oil prices have come down, traffic in the Strait of Hormuz remains well below pre-war levels. Traders continue to price in the possibility of the Federal Reserve raising interest rates twice before the end of the year.
Downside volatility during the third quarter of a calendar year is not unusual. Pullbacks (declines of 5% to 10%) are a normal part of stock market behavior. Predicting their timing requires a working crystal ball.
Long-term, disciplined investors learn not to get giddy about bull market runs or anxious about market drops. Still, it is always more enjoyable when Mr. Market is in a good mood.
Holiday Schedule
The U.S. financial markets and the AAII office will be closed on Friday, July 3, in observance of Independence Day. We at AAII wish you and your family a safe and enjoyable Fourth of July weekend.

-
Navigating Market Cycles With Shiller’s CAPE Ratio
The CAPE ratio empowers long-term investors to navigate volatile markets, forecast returns and make smarter decisions grounded in historical valuation trends. -
Driehaus Revised Screen
The "father of momentum investing," Richard Driehaus, devised an approach that seeks out companies with accelerating earnings growth, rising earnings estimates and meaningful positive earnings surprises. -
Outperformance and 10 Changes for the Model Shadow Stock Portfolio
The newly released July 2026 AAII Journal includes a quarterly review of the model portfolio, which resulted in five deletions and five additions.
AAII Sentiment Survey
Optimism among individual investors about the short-term outlook for stocks decreased in the latest AAII Sentiment Survey. Meanwhile, neutral sentiment and pessimism increased.
Bullish sentiment, expectations that stock prices will rise over the next six months, decreased 13.6 percentage points to 31.4%. Bullish sentiment is below its historical average of 37.5% for the sixth time in seven weeks.
Neutral sentiment, expectations that stock prices will stay essentially unchanged over the next six months, increased 7.4 percentage points to 26.4%. Neutral sentiment is below its historical average of 31.5% for the 102nd time in 104 weeks.
Bearish sentiment, expectations that stock prices will fall over the next six months, increased 6.1 percentage points to 42.3%. Pessimism is unusually high and is above its historical average of 31.0% for the 21st consecutive week.
The bull-bear spread (bullish minus bearish sentiment) decreased 19.7 percentage points to 10.9%. The bull-bear spread is below its historical average of 6.5% for the 19th time in 21 weeks.
This week’s special question asked AAII members if their portfolios are "all American," or if they also diversify internationally [via stocks, exchange-traded funds (ETFs) and/or mutual funds]?
Here is how they responded:
- Most of my portfolio is domestic, with just a small allocation to foreign companies: 54.5%
- I hold a mix of domestic and foreign investments: 29.8%
- I solely invest in domestic companies: 12.4%
- Prefer not to answer: 1.7%
Bullish: 31.4%, down 13.6 points
Neutral: 26.4%, up 7.4 points
Bearish: 42.3%, up 6.1 points
Bullish: 37.5%
Neutral: 31.5%
Bearish: 31.0%
See more Sentiment Survey results.

AAII Asset Allocation Survey
Individual investors’ allocations to stocks increased while bond and cash allocations decreased in the June AAII Asset Allocation Survey.
Stock and stock fund allocations increased 1.2 percentage points to 71.0%. Stock and stock fund allocations are above their historical average of 61.5% for the 73rd consecutive month.
Bond and bond fund allocations decreased 0.5 percentage points to 14.4%. Bond and bond fund allocations are below their historical average of 16.0% for the eighth time in nine months.
Cash allocations decreased 0.7 percentage points to 14.6%. Cash allocations are below their historical average of 22.5% for the 43rd consecutive month.
- Stocks and Stock Funds: 71.0%, up 1.3 percentage points
- Bonds and Bond Funds: 14.4%, down 0.5 percentage points
- Cash: 14.6%, down 0.7 percentage points
- Stocks: 30.9%, down 1.1 percentage points
- Stocks Funds: 40.2%, up 2.4 percentage points
- Bonds: 3.6%, down 0.4 percentage points
- Bond Funds: 10.8%, down 0.2 percentage points
- Stocks/Stock Funds: 62.0%
- Bonds/Bond Funds: 16.0%
- Cash: 22.0%
Take the Asset Allocation Survey.
June 25, 2026 What Makes Perpetual Futures So Risky?
June 18, 2026 June Charts of Interest: A New Fed Chair and Rising Rate Expectations
June 11, 2026 Three Ways to Diversify From a Top-Heavy S&P 500
June 4, 2026 Hold or Cash In Your Semiconductor Chip Stocks?

Discussion
Barry from TX posted 3 months ago:
Reversion to the Mean (RTM) is much more than a buzzkill for “the good times.” #1 Getting careless and letting all the noise and hoopla distract you can be dangerous to your “monetary” growth. #2 In the striated bar chart, I see 3 prior “build-up” periods where markets peaked and then RTM. (1) 2002-2004 peaked at 24% with 2004 RTM @14%; (2) 2016-2018 peaked at 21% and 2019 RTM at 1%; and (3) 2024-2026 peaked at 26% and a “projected” RTM at 17% in 2027. #3 I see 4 “market cycles” peaking in 2004, 2010, 2018, and 2025 and RTM troughs in 2001, 2008, 2015, 2019, and … 2027?. #4 The peak-to-peak periods are 5, 7, 3, and 4 years = a 5 year average. #5 We are in year 4 of the current 4-year cycle, facing the peak 5-year average in 2027. #6 An analogy. Everyone who ignored the signals from (a) the train’s loud horn and (b) bright search light, (c) the bumpy, shiny steel tracks, (d) the clanging bells and (5) flashing lights and (6) clanging bells at the crossing, and still ignored these multiple caution signals to their detriment, and the few who survived, all claim they never saw or heard anything. Why? Because that’s what they wanted to see and hear. They were in a rush to get somewhere (in this case, get rich), and they paid dearly for their inattention. #7 RTM is a mathematical feature of statistical movements. #7 So, where are we in this scenario? Is this a classic Bernoulli Paradox? We won the latest coin flip (2026) and pocketed big winnings. Do we flip again, facing 50/50 odds? We get to double our winnings … OR … lose our winnings. Do we take the cash and pass on flipping? #8 Everyone’s luck runs out eventually when they lose the next coin flip. That’s the decision that might play out in 3Q/4Q26. #9 All I see are coins spinning in the air for so many big issues that have not been resolved or addressed by key policy officials and national leaders across the globe. #10 Charles elided over the signal-to-noise ratios in the geopolitical environment and focused on the market (RR crossing?) signals. His analysis “ass-u-me” the data series provided will be uniformly beneficial in the near-term future referenced. We were cursed to live in interesting times. #11 Pass on the flip? #12 Pocket the cash? #13 Buy the RTM dip.
You need to log in as a registered AAII user before commenting.
Create an account