

How We Define Risk
by Charles Rotblut | November 01, 2018
The potential of losing money by investing in the stock market has become front and center over the past several weeks. The decline in the S&P 500 index and the bigger drops in other indexes and stocks has drawn attention. It has also led to the usual chatter about what the downside volatility means and whether investors should be concerned.
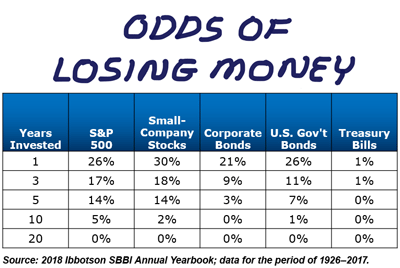
At AAII, we believe there is too much focus on the short-term swings in stock prices. Yes, downward moves in stock prices are not enjoyable. They can inflict psychological pain and lead to temporary decreases in wealth. But price volatility is not how we define risk.
Rather, as our founder James Cloonan wrote in “Investing at Level3” (AAII, 2017), “Risk is the likelihood that when we must withdraw assets from our portfolio for consumption, they will have a lower value than we could reasonably expect based on our investment strategy.” It is the chance of losing all or a significant enough percentage of portfolio value to the extent that the wealth cannot be recovered.
In absolute terms, if one puts their money into safe assets such as short-term Treasury bills, money market funds, certificates of deposit (CDs) and savings accounts, the odds of losing wealth in absolute terms are near zero. In real terms, which factor in inflation, the risk of losing purchasing power is high.
Putting the money into stocks does increase the chance of an impairment of value in absolute terms. Hold just a few stocks, make bad investment decisions or invest for too short of a period of time, and you will most likely end up with far less wealth than desired. Diversify properly, save regularly, follow a disciplined approach and invest for the long term, and the risk of wealth shortfall will drop considerably. As the table above shows, the odds of an absolute loss for investing in stocks over periods of 10 years or longer is extremely low. Even the so-called lost decade of 2000–2009 was an exception, not the norm.
This is why investors should think long term. Reacting to the short-term variations in returns or being fearful of the next large drop occurring carries the cost of missing out on the big long-term gains needed to grow your portfolio throughout your lifetime. There is a high price to pay in terms of forfeited wealth by trying to limit the pain of short-term volatility.
The pursuit of long-term returns does need to be balanced against the shorter-term needs of cash flow. This can be accomplished through allocation strategies that consider streams of income. Employment, savings accounts, Social Security, pensions, annuities and high-quality bonds can fund shorter-term needs and allow you to withstand higher levels of price volatility in your portfolio. You will be able to financially withstand a larger level of price volatility if either you have enough cash flow to cover expenses for the next two to five years and/or there is a long period of time before withdrawals will be needed from your investment portfolio.
As the pundits argue over what level of exposure investors should have to stocks, realize the discussion shouldn’t influence your portfolio allocations. Rather, the key determinant of how much you should have allocated to stocks is the length of your investment time horizon, the extent to which your shorter-term cash flow needs are covered and your psychological ability not to react to down markets.

- A Lifetime Investment Strategy – This AAII guide puts risk into perspective and gives practical steps for long-term investors.
- The Role of Risk-Free Assets in Your Long-Term Portfolio – This April 2009 AAII Journal article addresses a question some of you may have now, how much cash should your portfolio hold?
Optimism among individual investors about the short-term direction of stock prices rebounded strongly but continues to stay below average. The latest AAII Sentiment Survey also shows drops in neutral and bearish sentiment.
Bullish sentiment, expectations that stock prices will rise over the next six months, jumped by 10.0 percentage points to 37.9%. Bullish sentiment was last higher on October 3, 2018 (45.7%). Even though this is a four-week high, optimism remains below its historical average of 38.5% for the fourth consecutive week and the seventh time in eight weeks.
Neutral sentiment, expectations that stock prices will stay essentially unchanged over the next six months, fell 3.4 percentage points to 27.6%. Neutral sentiment was last lower on January 31, 2018 (26.5%). This is just the third time in 37 weeks that neutral sentiment is below its historical average of 31.0%.
Bearish sentiment, expectations that stock prices will fall over the next six months, pulled back by 6.5 percentage points to 34.5%. Even with the decline, pessimism remains above its historical average of 30.5% for the seventh time in eight weeks.
This week’s rise in optimism follows last week’s unusually low bullish sentiment reading of 28.0%. Year to date, there have been four weeks when optimism has risen by 10 percentage points or more and five weeks when optimism has fallen by at least 10 percentage points.
At current levels, all three indicators are within their historical average ranges.
The majority of the responses to this week’s survey were recorded before Tuesday’s and Wednesday’s rise in stock prices. Our survey period runs from Thursday through Wednesday with reminder emails to take the survey sent to a rotating group of AAII members each Monday.
Some AAII members were anticipating a decline in stock prices prior to the recent downward volatility and, as the responses to this week’s special question shows, some—but not the majority—used the recent drop to buy stocks. Tariffs and the possibility of an escalating trade war remain front and center in the minds of many individual investors. Also influencing sentiment is Washington politics (including President Donald Trump), midterm elections, economic growth, valuations and corporate profits.
This week’s special question asked AAII members what actions they have taken, if any, in response to the increased volatility that the market has experienced since late September. Approximately 37% of respondents did not take any actions, with several describing themselves as long-term or buy-and-hold investors. A nearly equal number of respondents (36%) say they sold stocks. Some of these respondents purposely reduced their exposure to equities, while others used the drop as a reason to pull out of underperforming or otherwise disappointing stocks. Just 21% say they bought stocks or entered orders to do so.
Here is a sampling of the responses:
- “Sold three losing stocks and nothing else. I’m taking the big swings in stride.”
- “I have strengthened my resolve to ride it out and reminded myself that my investments are for the long term.”
- “I have been selling and am waiting until I see a confirmed uptrend in the market.”
- “Bought new shares and added to existing shares. It’s a good buying environment.”
- “I rebalance quarterly and let it ride.”

Bullish: 37.9%, up 10.0 points
Neutral: 27.6%, down 3.4 points
Bearish: 34.5%, down 6.5 points
Bullish: 38.5%
Neutral: 31.0%
Bearish: 30.5%
October 27, 2018
October 25, 2018 Credit Spreads Aren’t a Reason to Alter Bond Allocations
October 18, 2018 Actionable Steps for the Current Market
October 11, 2018 It’s Been a Tougher Year Than the Headline Numbers Suggest

Discussion
No comments have been added yet. Add your thoughts to the discussion!
You need to log in as a registered AAII user before commenting.
Create an account