

It’s Been a Tougher Year Than the Headline Numbers Suggest
by Charles Rotblut | October 11, 2018
Yesterday’s 3.29% decline in the S&P 500 index was the biggest such move since February. Yet it only put the S&P 500 a mere 4.9% below its record closing high. If it felt like the drop was worse, there are two big reasons why.
The first is the relative headline calm we’ve become accustomed to. Prior to yesterday, the S&P 500 had gone 74 trading days without closing up or down by 1% or more. The large-cap index had also gone 129 days without experiencing a move of 2% or more. Based on these measures, 2018 remains on pace to be less volatile than either 2015 or 2016.
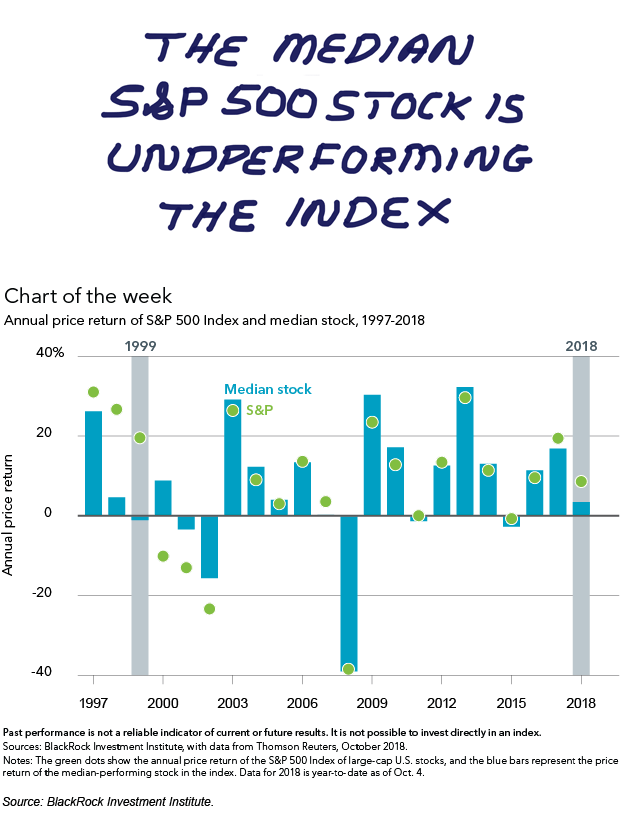
The second reason is that this has been a much tougher year for individual stocks than the headline index numbers suggest. Through Tuesday, the S&P 500 was up 7.73% year to date. Meanwhile, the S&P Equal Weight index has returned just 4.00% over the same period. (Yesterday’s drop knocked down the respective year-to-date returns to 4.19% and 0.99%.)
BlackRock’s chart of the week plotted the performance of the median stock in the S&P 500 (blue bars) against the returns of the index itself (green dot). Though the chart itself is small, the difference in returns is apparent (you can click on the chart to enlarge it). Through October 4, the median stock was underperforming the very index it is a part of by the widest margin in several years.
The same pattern can be seen elsewhere. A simple calculation of year-to-date returns I ran yesterday morning found that slightly more than 40% of S&P 500 stocks were down on a year-to-date basis (even before yesterday’s drop). A little less than half of the S&P 500 stocks were trading above their respective 200-day moving average (a measure of longer-term price trends).
Going beyond the S&P 500, there has been quite a bit of churn. Homebuilding, metal, semiconductor and electronic component maker stocks were all showing signs of good price momentum based on their 26-week relative strength indexes. Since mid-September, transportation stocks have weakened considerably, preceding this week’s notable drop in the Dow Jones transportation average. (Adherents to Dow Theory view such drops as a warning sign of a larger market fall.)
None of this is meant to strike fear or to encourage you to pull out of the market. Rather, I’m simply providing some color on the trends I’ve been noticing. As investors, we can’t choose the market conditions that will exist over our lifetime; we can only choose how we’ll react to them.
There are a few things you can do. First, if you’ve been disappointed with your portfolio’s performance, take a deep breath and realize that it may not be your (or your adviser’s or favorite newsletter writer’s) fault. The process followed is far more important than the actual results. A good, repeatable process greatly increases the odds of achieving the best possible outcome given uncontrollable circumstances. Second, keep your investing time horizon in mind. On a daily, monthly or even yearly basis, the stock market can be very volatile. Over periods of five years or longer, the likelihood of positive returns rises dramatically. Third, ensure that your shorter-term needs for cash flow (aka “liquidity”) are covered. Having these needs met increases your financial ability to tolerate downside volatility. Finally, realize that the less frequently you look at your portfolio and the financial markets, the less volatile they will seem.

- A Question of Proportions: How Various Indexes Are Weighted – Because the S&P 500 is market-capitalization weighted, its returns are disproportionately influenced by its largest holdings.
- Charles Dow’s Theory Still Valid for the 21st Century – The relative returns of transportation stocks play a key role in this technical analysis strategy.
The proportion of individual investors who anticipate a decline in stock prices is at a three-month high, according to the latest AAII Sentiment Survey. Optimism, conversely, fell sharply after having reached an eight-month high last week.
Bullish sentiment, expectations that stock prices will rise over the next six months, plunged 15.1 percentage points to 30.6%. Optimism was last lower on August 1, 2018. The drop more than reverses last week’s gain and puts bullish sentiment back below its historical average of 38.5% for the fourth time in five weeks.
Neutral sentiment, expectations that stock prices will stay essentially unchanged over the next six months, rose 4.7 percentage points to 33.9%. Neutral sentiment is above its historical average of 31.0% for the 32nd time in the past 34 weeks.
Bearish sentiment, expectations that stock prices will fall over the next six months, jumped 10.3 percentage points to 35.5%. Pessimism was last higher on July 4, 2018 (39.3%). Pessimism is above its historical average of 30.5% for the fourth time in five weeks.
At current levels, all three indicators are within their typical historical ranges. A bullish sentiment reading below 28.1% would be unusually low.
The majority of this week’s responses were recorded before yesterday’s drop. The survey period runs from Thursday through Wednesday with reminders to participate sent to a rotating group of AAII members every Monday.
Tariffs and the possibility of an escalating trade war remain front and center on the minds of many individual investors. Also influencing sentiment are Washington politics (including President Donald Trump), midterm elections, economic growth, valuations and corporate profits. Some AAII members have been anticipating a decline in stock prices; whether the recent pullback is steep enough to prompt them to act remains to be seen.
Most of this week’s responses were recorded before yesterday’s drop in the major indexes. This week’s special question asked AAII members how, if at all, they’ve recently adjusted their stock investing strategy. More than a third of all respondents (35%) say they have not altered their strategy. Many of these respondents describe themselves as long-term investors. About 20% of respondents say they have altered the type of stocks and/or equity ETFs they focus on, with value and, secondarily, dividend-paying stocks cited the most often. Nearly 19% of respondents are increasing their cash allocations, either directly or by not reinvesting dividends and the proceeds of sales. Other respondents say they are favoring index funds more or increasing their portfolio’s diversification. Some respondents list more than one change, primarily reducing equity exposure and increasing their cash positions.
Here is a sampling of the responses:
- “I have not changed it. I put most of my portfolio into passively managed vehicles with low costs.”
- “Slowly changing to more value-based ETFs and stocks. Also building a cash reserve.”
- “I am slowly trimming my portfolio to make cash available to purchase stocks when they go on sale.”
- “More focus on value, and especially those value stocks that pay dividends.”
- “No change. I’m not a fan of market timing and while I think the Federal Reserve’s rate hikes are bearish, I could be wrong, so I will stay fully invested.”

Bullish: 30.6%, down 15.1 points
Neutral: 33.9%, up 4.7 points
Bearish: 35.5%, up 10.3 points
Bullish: 38.5%
Neutral: 31.0%
Bearish: 30.5%
October 4, 2018 Diversification Cushions the Blow of Drawdowns, But at a Cost
September 27, 2018 Increasingly, Just One Analyst Is Behind a Stock’s Long-Term Earnings Forecast
September 20, 2018 SEC to End Five-Cent Spreads on Small-Company Stocks
September 13, 2018 Mr. Market Has Reverted Back to a Calm State

Discussion
No comments have been added yet. Add your thoughts to the discussion!
You need to log in as a registered AAII user before commenting.
Create an account