

Seeking More Than One Factor Can Boost Returns
by Charles Rotblut | August 02, 2018
One of the current trends within the investment industry is to focus on factors. Also referred to by the monikers “smart beta” and “strategic beta,” factor investing involves buying stocks with certain, quantifiable characteristics. Factors include low valuation, small size, price momentum and many others.
There has also been a proliferation of factor exchange-traded funds (ETFs). Even Vanguard joined the party earlier this year with its own factor ETFs. Some of these offerings from the various ETF providers have a singular focus [e.g., iShares Edge MSCI USA Momentum Factor ETF (MTUM)], while others use several factors [e.g., SPDR MSCI USA StrategicFactorsSM ETF (QUS)]. With this proliferation, a natural question emerges: Which is better?
A new study sought out the answer. Its insight has relevance for both ETF investors and those of you who prefer to invest in individual stocks. Before going into the details and discussing how it relates to what we do with the AAII portfolios, I’ll jump right to the conclusion: returns are better if factors are mixed rather than targeted on a single basis. In other words, don’t just focus on value, but combine value with additional factors. The same goes for many other factors, such as momentum and size.
The study’s authors used six factors: size (smaller is better), value (cheaper is better), profitability (higher is better), investment (less relative growth in assets is better), momentum (stronger relative price performance is better) and market beta (the market’s volatility). Five of them are used in professors Eugene Fama and Kenneth French’s five-factor model for explaining stock price returns. Momentum is the sixth factor that rests outside of the model, though Fama and French “augmented” their model with it due to “popular demand” (their words, not mine).
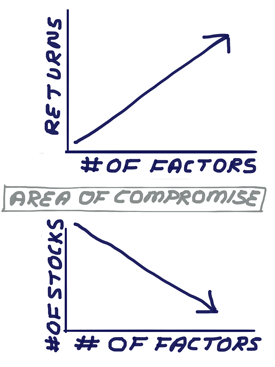
The hypothetical portfolios used were first constructed from stocks ranking favorably on a specific factor. When these portfolios were adjusted to exclude stocks that ranked unfavorably on one or more additional factors, monthly returns improved. The improvement held true for each factor. The trade-off was that as the number of factors increased, the number of stocks held fell.
The value factor portfolio exemplifies the impact. Monthly returns rose from 0.23% per month (for the period of 1963 through 2017) when just value was required to 0.69% when size, profitability, investment and momentum were also required. Simultaneously, the average number of stocks held fell from 302 to just 13. What the averages don’t reveal is how many times the fully enhanced portfolio found few or no stocks. The change in volatility wasn’t reported.
The idea of combining factors is nothing new; portfolio managers and individual investors have been doing this for years. Even the AAII portfolios combine factors. Our Model Shadow Stock Portfolio combines size and value. AAII Dividend Investing uses yield and value. Our VMQ Stocks portfolio seeks out value, momentum and quality.
For those of you investing in individual stocks, the lesson is to seek out stocks with more than one attractive trait. If you’re a value investor, also seek underlying quality, momentum, yield, etc. If you use technical analysis, incorporate fundamental analysis. If your preference is growth, investment or profitability can play a role. The basic idea is to find more than one reason why the stock should rise in price. In doing so, be careful not to be so restrictive that you’re left with only a few stocks to invest in. As investors, we don’t need stocks to be perfect, rather we just need them to be priced below what someone else might be willing to pay for them in the future.

- Weight by Fundamentals, Not by Price – Robert Arnott is one of the people credited with popularizing smart beta strategies. He explained why allocating based on fundamentals instead of market capitalization makes more sense.
- How to Take Advantage of Risk Factors – Factors are not only useful for identifying attractive stocks, they can also help you to diversify your portfolio.
Optimism among individual investors about the short-term direction of the stock market fell further in the latest AAII Sentiment Survey. Neutral sentiment also declined as pessimism rose above 30%.
Bullish sentiment, expectations that stock prices will rise over the next six months, declined 2.4 percentage points to 29.1%. This is a four-week low. The drop keeps optimism below its historical average of 38.5% for the fifth time in six weeks.
Neutral sentiment, expectations that stock prices will stay essentially unchanged over the next six months, pulled back by 2.8 percentage points to 38.8%. Neutral sentiment is above its historical average of 31.0% for the 23rd time in 24 weeks.
Bearish sentiment, expectations that stock prices will fall over the next six months, rose 5.2 percentage points to 32.1%. This is the first time pessimism is above its historical average of 30.5% in four weeks.
Optimism is near the bottom of its typical historical range. Readings below 28.1% are unusually low. Neutral sentiment is back within its typical range.
Most of this week’s results were tabulated before the Federal Reserve Open Market Committee released its meeting statement yesterday. Some AAII members have previously cited rising interest rates as one of the factors they are paying attention to. Many of these members have also said that they are not concerned about rate hikes as long as increases occur at a gradual and moderate pace.
Also influencing individual investor sentiment are tariffs and the possibility of a trade war, Washington politics (particularly President Trump), economic growth, valuations and corporate profits.
This week’s special question asked AAII members what their comfort level is with the current valuation of stocks. Slightly less than half of all respondents (49%) describe themselves as not being comfortable. Reasons are varied but include high valuations for growth [particularly Facebook, Amazon, Netflix and Google (FANG)] stocks, concerns about the economic cycle being at/past its peak, tariffs, politics, how current valuations compare to historical norms and a lack of room for upside/margin for error. Almost 25% of respondents describe themselves as being comfortable with valuations. These respondents primarily cite corporate earnings and economic growth as the reason why. About 5% say they are finding some stocks attractively valued, but not others (particularly the FANG stocks).
Here is a sampling of the responses:
- “I feel like most stocks are at or near their peak. Some of the tech stocks are way overvalued!”
- “I’m fine with it. Earnings are increasing significantly and there are no good alternatives to stocks.”
- “Overall, they appear to be historically high.”
- “Stocks are fully priced, especially if the economy slows.”
- “Valuations are on the high side, but the current growth numbers seem to support it.”
- “Comfortable with value stocks. Not comfortable with FANG stocks or tech in general.”

Bullish: 29.1%, down 2.4 points
Neutral: 38.8%, down 2.8 points
Bearish: 32.1%, up 5.2 points
Bullish: 38.5%
Neutral: 31.0%
Bearish: 30.5%
July 26, 2018 Bitcoin and Other Notes From the CFA's Financial Analysts Seminar
July 19, 2018 Some Thoughts About Allocating to Cash
July 12, 2018 Projecting an Aging Parent’s Finances
July 5, 2018 Second-Quarter Earnings and Tips on Analyzing the Numbers

Discussion
No comments have been added yet. Add your thoughts to the discussion!
You need to log in as a registered AAII user before commenting.
Create an account